Abstract
The role of the channels and cavities present in the catalase from Proteus mirabilis (PMC) was investigated using molecular dynamics (MD) simulations. The reactant and products of the reaction, H2O2 →1/2 O2 + H2O, catalyzed by the enzyme were allowed to diffuse to and from the active site. Dynamic fluctuations in the structure are found necessary for the opening of the major channel, ideied in the X-ray model, which allows access to the active site. This channel is the only pathway to the active site observed during the dynamics, and both the products and reactant use it. H2O and O2 are also detected in a cavity defined by the heme and Ser196, which could play an important role during the reaction. Free energy profiles of the ligands diffusing through the major channel indicate that the barriers to ligand diffusion are less than 20 kJ mol−1 for each of the species. It is not clear from our study that minor channels play a role for access to the protein active site or to the protein surface.
Keywords: Catalase, cavities, channels, ligand diffusion, molecular dynamics, free energy
Numerous globular proteins are known to possess permanent cavities and channels (Hubbard et al. 1994; Carugo and Argos 1998). Some are polar and filled with water while others are lined mostly by hydrophobic residues and are empty (Montet et al. 1997) or are only partially occupied (Otting et al. 1997). The question of substrate access to the active site arises when the latter is buried deep within the enzyme. Thus, for example, the degradation of hydrogen peroxide by heme-containing catalases occurs at the heme that lies about 30 Å from the protein surface, but the remarkable rapidity of the catalase reaction suggests that the channels present in these enzymes have an important role in facilitating the reaction (Bravo et al. 1997).
Heme-containing catalases are homotetramers, and each monomer contains a major channel that starts at the protein surface and ends at the buried heme (Gouet et al. 1995; Bravo et al. 1997). Among the family of heme catalases, certain enzymes can use NADPH as a special electron donor to protect themselves against inactivation by H2O2. In these catalases, two minor channels start at the binding site of NADPH on the monomer surface. One reaches the major channel 13 Å from the heme (on the distal side), whereas the other leads to the heme that is close to a serine residue in several catalases, such as Ser196 of the Proteus mirabilis catalase (PMC) (Gouet et al. 1995; Bravo et al. 1999; Maté et al. 1999; Nicholls et al. 2001). Several studies have tried to understand how a single entrance/exit channel that narrows in the vicinity of the active site could give rise to a turnover of 2 to 10 million molecules of H2O2 per second for mammalian catalases (Nicholls et al. 2001), and the role of the two lateral channels to eliminate the products has also been questioned (Maté et al. 1999; Sevinc et al. 1999).
Substrate diffusion through pre-existing cavities and channels and the contribution of dynamic fluctuations have been the subject of numerous theoretical studies, most notably for the protein myoglobin (Case and Karplus 1979; Tilton et al. 1986, 1988; Brunori 2000). More recently, pathways for the diffusion of camphor in cytochrome P450cam have been revealed using the random expulsion molecular dynamics technique (Lüdemann et al. 2000a), and steered molecular dynamics was employed to isolate the most probable entrance/exit pathway (Lüdemann et al. 2000b). A similar study has also been performed on cytochrome P450BM-3 (Chang and Loew 1999). Another protein that has received attention is the acetylcholinesterase from Torpedo californica for which free energy profiles were calculated and used to compare the routes taken by products of the reaction, including acetic acid and the acetate ion, to escape from the active site (Enyedy et al. 1998). Structural modifications of the channels of another acetylcholinesterase, purified from the mouse, upon binding of an inhibitor, huperzine A, have also been analyzed using MD simulations (Tara et al. 1999).
The local enhanced sampling (LES) algorithm is a powerful technique that was developed to understand the diffusion of carbon monoxide and xenon in myoglobin (Elber and Karplus 1990; Brunori et al. 1999). It is based on the time-dependent Hartree approximation, and allows the diffusion of several molecules, which are treated independently, to be studied from a single protein trajectory. We have used the LES method to follow the diffusion of H2 and xenon to the active site of hydrogenase from Desulfovibrio gigas that is buried 30 Å from the protein surface (Montet et al. 1997). It was found that the hydrophobic cavities present in the enzyme played a crucial role in H2 storage and in access to the active site.
In this work, we present MD simulations of the reactant and products of the catalase reaction diffusing to and from the active site of the catalase from Proteus mirabilis (Gouet et al. 1995; P. Andreoletti, G. Sainz, V. Stojanoff, and H.M. Jouve, in prep.), using the LES approximation. Possible routes for ligand access and the role of existing channels in the enzyme were analyzed, and free energy profiles for the passage of the ligands through the channels were determined to obtain information for time scales unobtainable with the free dynamics.
Results
Validating the model
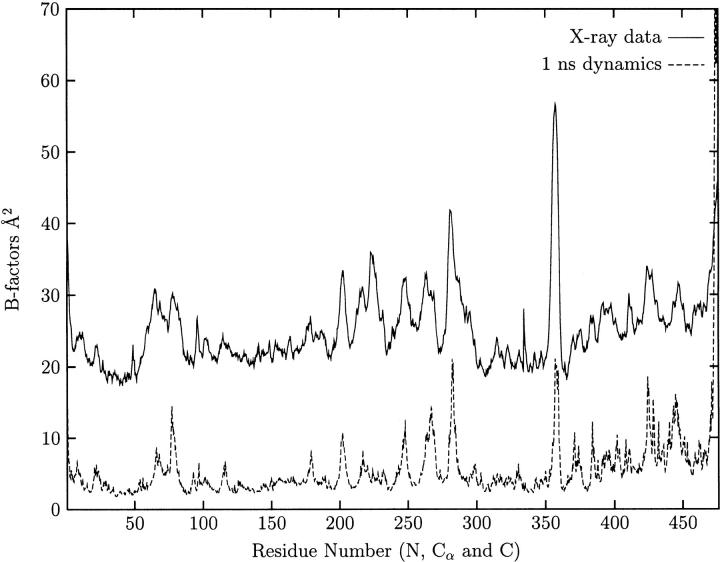
pKa calculations on our model led to an isoelectric point of 5.7, which is close to the experimental value of 4.8 (Jouve et al. 1983). After minimizing our model, the root mean square coordinate deviation (rmsd) of our structure from the X-ray model was 0.3 Å on the backbone and 0.5 Å on all atoms, excluding hydrogens. A 1-ns MD simulation was performed on the free enzyme (i.e., without ligands), and the rmsd of the backbone atoms from the starting model stabilizes at approximately 1 Å after about 600 ps. A comparison of the MD-derived atomic fluctuations and the crystallographic B-factors (Fig. 1 ▶) shows that their shapes correlate very well, but that the amplitudes of the simulated B-factors are smaller, possibly due to the absence of the static disorder term in the simulation. We also note that the unfavorable main-chain conformation of Ser196 observed in the X-ray model is maintained throughout the 1-ns simulation with average φ and ɛ angles of −66° and 77°, respectively.
Fig. 1.
The crystallographic B-factors (solid line) and the B-factors determined from the 2000 structures taken from the 1-ns dynamic trajectory (dotted line).
We chose our starting structure for the rest of our study to be the one at the end of the 1-ns simulation. The ligand-diffusion simulations were performed on the full homotetramer with four groups of ligands being simulated simultaneously, one per monomer. As we observed very similar patterns of behavior for all the monomers, we will restrict the discussion of our results to a single monomer, except when there is an unusual event in a specific monomer.
Cavities and channels
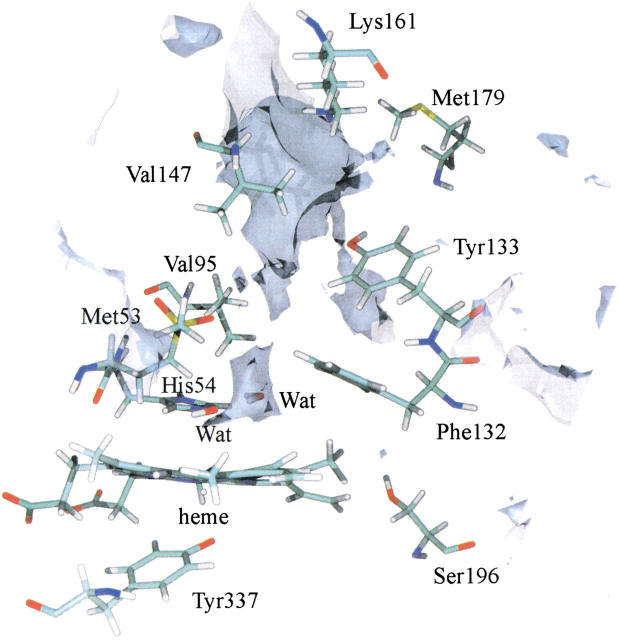
A cavity calculation, performed on the X-ray model of the monomer, is shown in Figure 2 ▶, and reveals the main channel starting from the surface and leading to the active site where a small cavity is visible. The channel is interrupted at the region defined by Met53, Val95, and Phe132 (called the gate from now on), which blocks the way to the heme. Cavity maps were also determined from the structures obtained from the 1-ns MD simulation (see the Materials and Methods section for a definition of the maps). The average cavity map taken from the structures is similar to the one displayed in Figure 2 ▶, so it is not shown. The minimal map reveals a small permanent cavity lined by Val147, Lys161, and Met179, whereas in the maximal map the gate is open, although the data show that it is a rare event on the time scale of the simulation. A small cavity close to Ser196 is also present in the maximal map.
Fig. 2.
Cavity map of the X-ray model (with hydrogens, without water molecules) obtained with the program CAVEnv (Volbeda 1999). Residues along the main channel are represented as sticks as are two water molecules of the X-ray model that are important in the subsequent discussion.
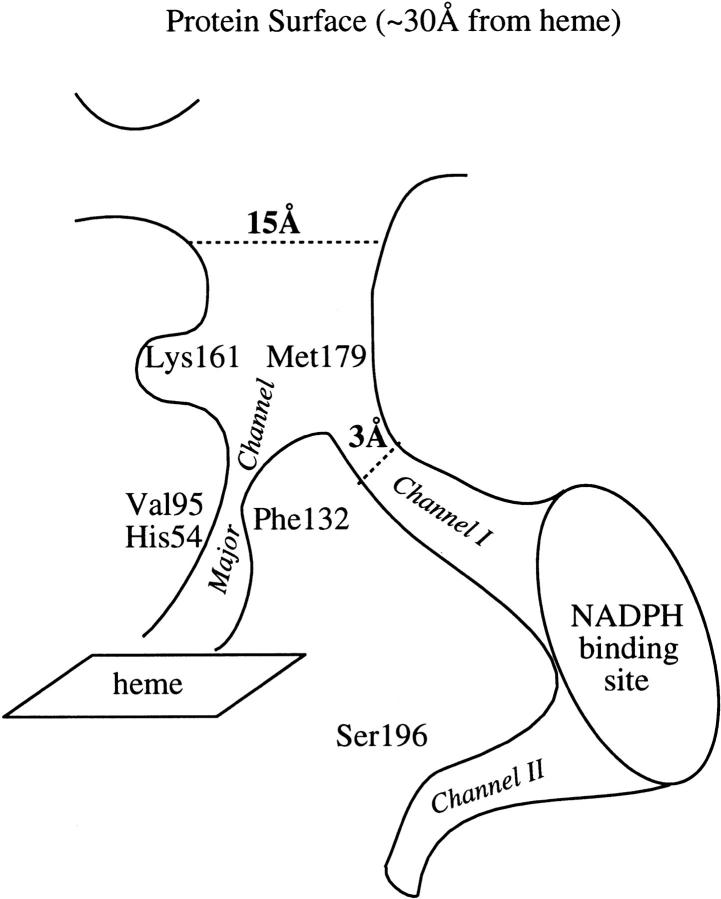
A schematic of the channel network in the catalase monomer with the major channel and the alternate channels I and II is presented in Figure 3 ▶. For those catalases that bind NADPH, channels I and II are blocked and cannot lead to the protein surface, which seems to point to the major channel as the best candidate for ligand diffusion (Maté et al. 1999).
Fig. 3.
Schematic of the channel network leading to the active site, derived from the cavity calculations on the simulated and crystallographic structures of PMC.
Diffusion of H2O2
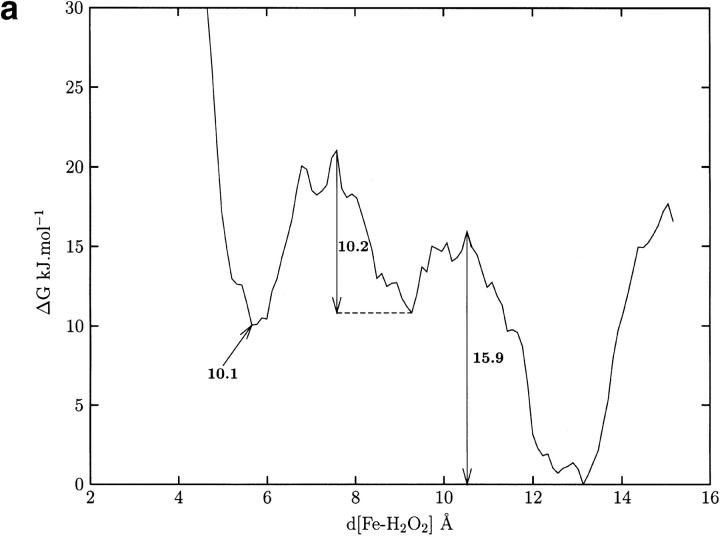
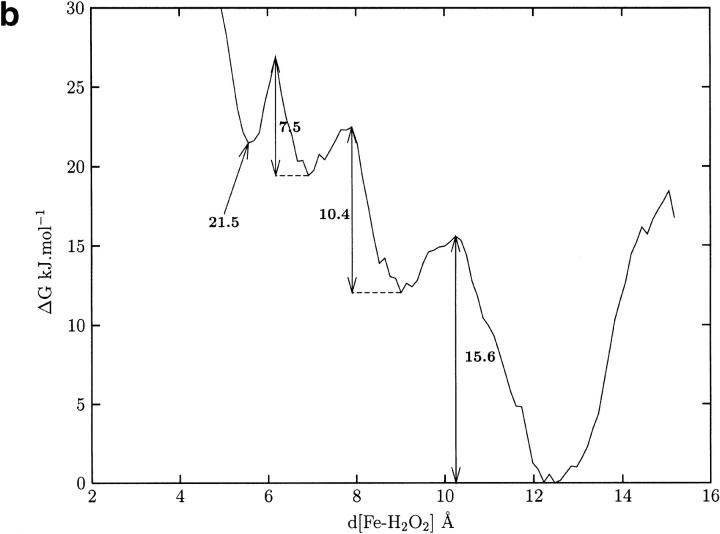
Fifty H2O2 molecules were placed at the entrance of the hydrophobic funnel in each monomer and allowed to diffuse for 500 ps. In most trajectories the ligands explored the large funnel, were stopped near Val95, and then returned to the protein surface. Only 2% of the trajectories brought the ligand to the narrow entrance of the active site. An example is shown in Figure 4 ▶, where the ligand diffuses to the gate and then returns to its starting point. The analysis of the ligand probability map for all four monomers confirms the predominance of the ligand in the minimal cavity and in the funnel towards the gate and the lack of reactant at the active site. To evaluate the energy cost of the migration of a H2O2 molecule to the active site, it is necessary to calculate the free energy profile going from the entrance of the main channel to the vicinity of the heme. Figure 5 ▶ displays this profile as a function of the distance between the iron atom and the center of mass of H2O2, which is taken to be the reaction coordinate (see the Materials and Methods section). On going from the right to the left, with His54 protonated on Nδ1 (Fig. 5a ▶), there is a barrier of ∼16.0 kJ mol−1, close to Val147 and Tyr133, and another barrier of ∼10 kJ • mol−1 at the gate. Then, there is a well in which the H2O2 molecule is in the cavity above the active site. Figure 5b ▶ shows the free energy profile with His54 protonated on Nɛ2. Both profiles are similar for Fe–H2O2 distances from 16 to 7 Å, but the energy profile is less favorable at shorter distances when the proton is on Nɛ2. There are two water molecules observed in the X-ray model above the heme close to His54 (Fig. 2 ▶). These stabilize the H2O2 molecule through a hydrogen bond network that involves both H2O molecules, H2O2, and the Nɛ2 of His54 (observed in a structure taken from the PMF with d[Fe-H2O2] = 5.7 Å). This network is disrupted when the protonation is on Nɛ2 as the water molecules move apart and away from the substrate. A more detailed analysis of the histidine protonation states shows that the electrostatic potential value favors a protonation on Nδ1 at pH=7. At Fe-H2O2 distances of around 4 Å, the free energy rises abruptly. This is due to Van der Waals repulsions between the ligand and the heme atoms, and is an unphysical aspect of our potential, which is unable to model the Fe-H2O2 reaction.
Fig. 4.
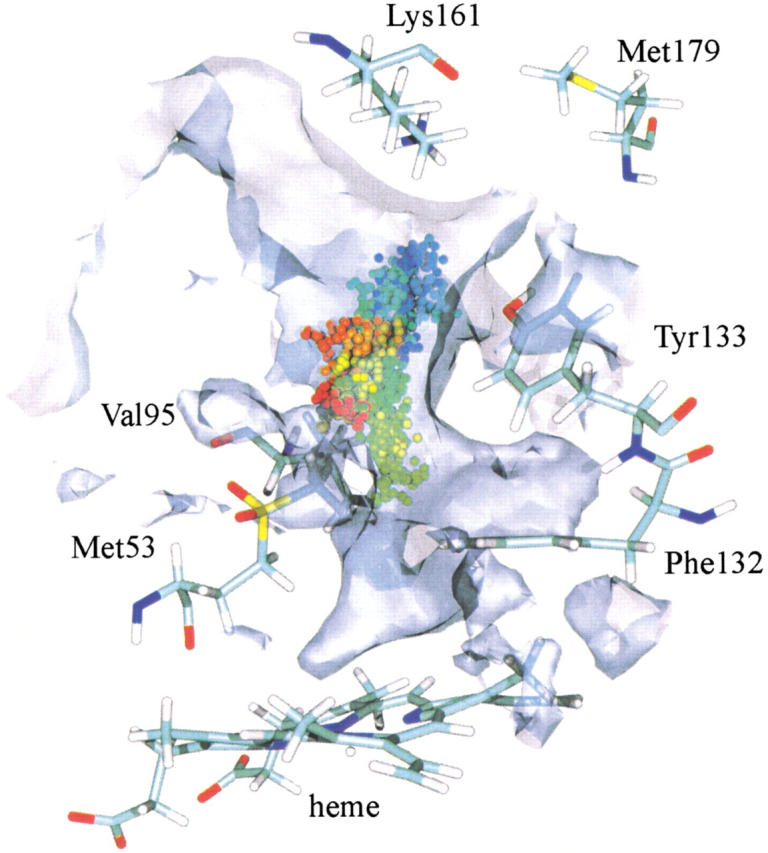
A single H2O2 trajectory from one of the catalase monomers. The protein is represented by the heme and a few residues along the major channel, whereas the ligand is represented by a sphere at its center of mass at 1-ps intervals. The sphere is color coded as a function of time, and goes from blue (t = 0) to red (t = 500 ps). The maximal cavity built up from 250 structures taken from the 500-ps MD simulation is depicted in gray.
Fig. 5.
(a) The free energy profile for the H2O2 ligand accessing the active site via the major channel as a function of the distance between the Fe atom and the H2O2 center of mass, with His54 protonated on Nδ1. The barrier heights are in kJ mol−1. (b) Same as (a) with His54 protonated on Nɛ2.
Diffusion of H2O, O2
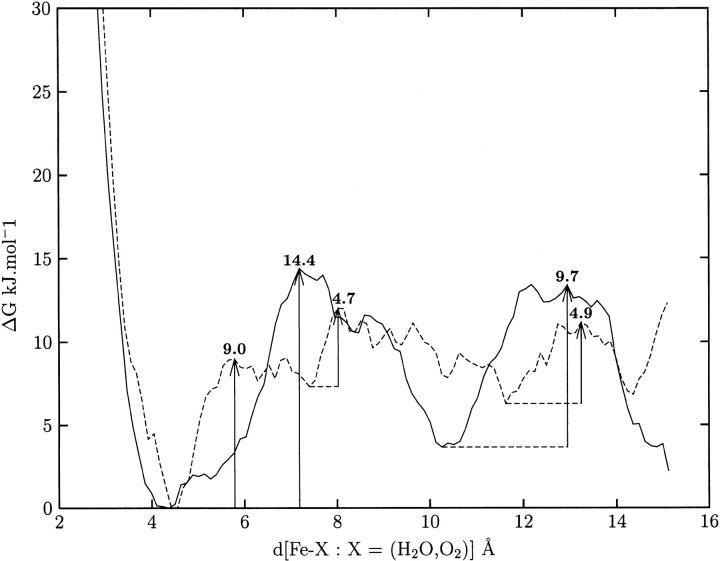
Fifty H2O molecules or O2 molecules were placed above the heme in the small cavity shown in Figure 2 ▶. Both products exhibited the same behavior. In most cases, the ligands explored the cavity above the heme without exiting but in a small fraction of cases (0.5% and 5% for O2 and H2O, respectively) they left the active site through the main channel passing the gate leading to Met179 (Fig. 3 ▶). Examples of this latter case are illustrated in Figure 6a and b ▶. Figure 7 ▶ depicts the free energy profile of both products diffusing out of the active site (from left to right) through the main channel. The barriers are 9 kJ mol−1 for O2 and 15 kJ mol−1 for H2O. Calculations of the free energy profiles for water and oxygen molecules diffusing through channel I towards the protein surface reveal barriers of around 22 and 33 kJ mol−1, respectively. However, despite the low barrier for water, no attempts to migrate to lateral channel I were observed during the MD simulations.
Fig. 6.
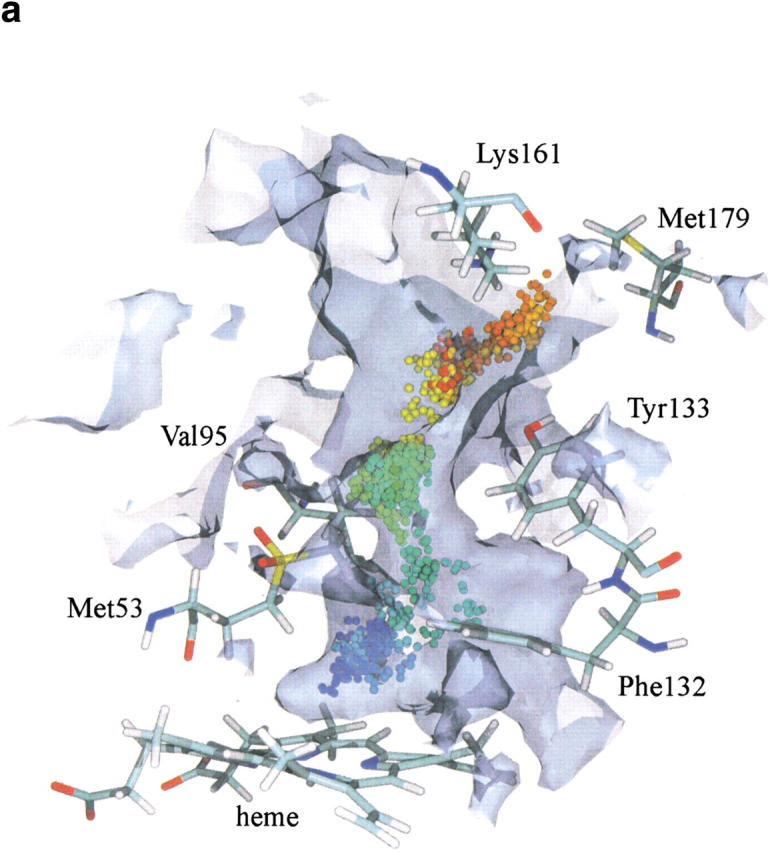
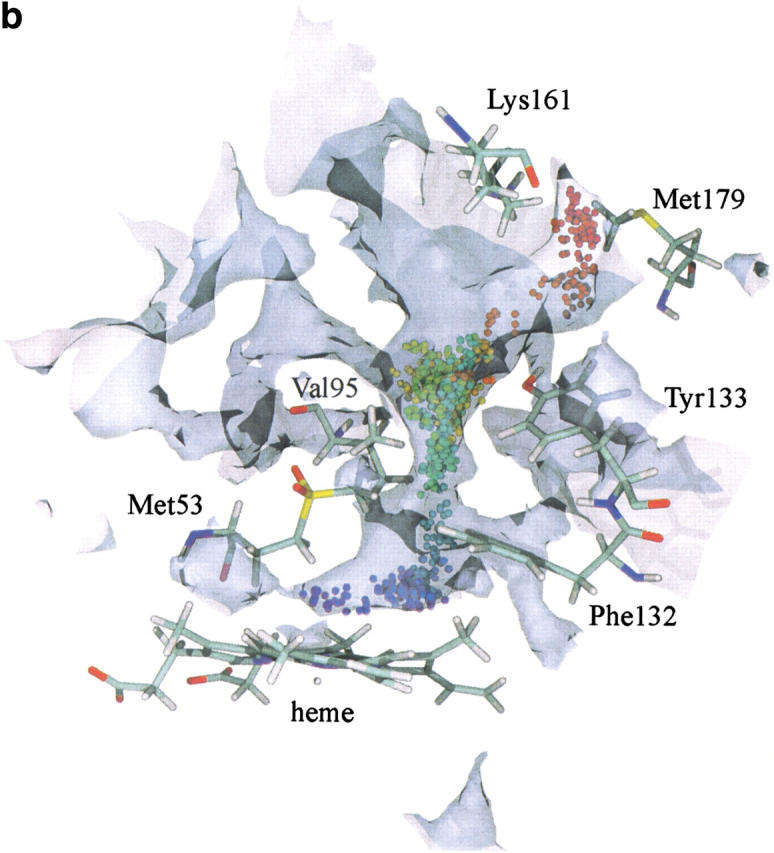
(a) An example of an O2 trajectory in which the ligand leaves through the major channel. (b) An example of a H2O trajectory in which the ligand leaves through the major channel. For the graphical and color attributes, see Figure 4 ▶.
Fig. 7.
The free energy profiles for the O2 (dotted line) and H2O (solid line) ligands leaving the active site through the major channel as a function of the distance between the Fe atom and the O2/H2O center of mass. The barrier heights are in kJ mol−1.
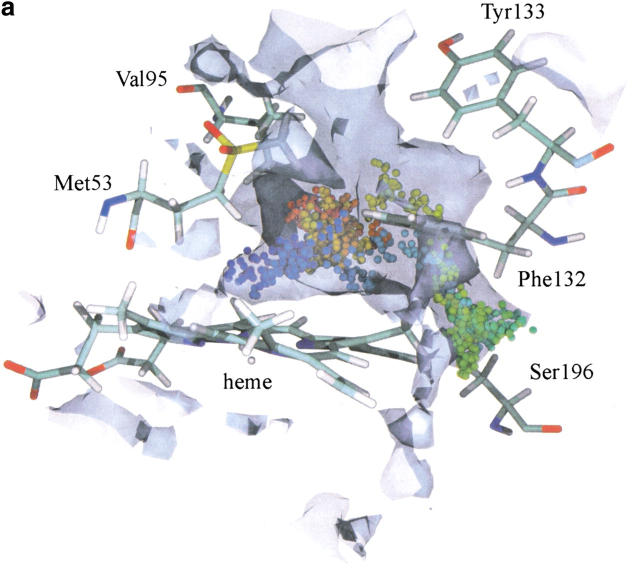
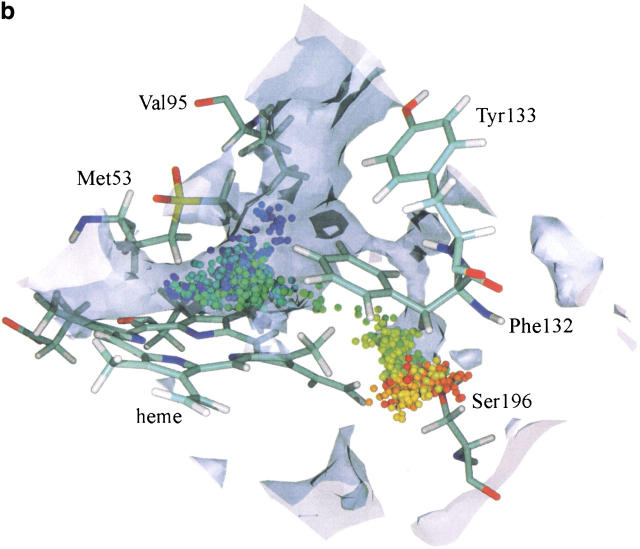
The maximal maps at the active site region, obtained from the ligand diffusion simulations, are shown in Figure 8a and b ▶ for the molecules O2 and H2O, respectively. They reveal a cavity lined by Ser196, Phe132, and the heme. Even though the barrier for the products to leave through the major channel is relatively small, as seen in Figure 7 ▶, some of the trajectories for O2 and H2O are found in the cavity close to Ser196 (1.5% of the trajectories for both ligands). In Figure 8a ▶, an oxygen molecule diffuses towards Ser196 and then is pushed outside the active site towards the gate, while in Figure 8b a water molecule diffuses in the vicinity of Ser196 and remains in that pocket during the whole of the simulation. None of the molecules were detected in lateral channel II located close to Ser196 (Fig. 3 ▶), as no connection between channel II and the active site arose from structural fluctuations during the simulations. In the probability maps, both O2 and H2O are found mostly in the major channel and the active site. Some molecules, however, were detected in isolated cavities that do not lead to any channel emerging at the protein surface.
Fig. 8.
(a) An example of an O2 trajectory in which the ligand explores the cavity close to Ser196. (b) An example of a H2O trajectory in which the ligand explores the cavity close to Ser196. For the graphical and color attributes see Figure 4 ▶.
Discussion
No pathway to the funnel leading to the heme, other than the major channel, emerged from our dynamics simulations of substrate diffusion. H2O2 molecules explore the whole of the major channel up to the gate defined by Val95 and Phe132, but it is only in the maximal map calculated from all the structures of the 1-ns trajectory that the gate opens enough to allow the substrate to enter. This indicates that dynamic fluctuations of the enzyme are essential for accessibility to the heme. Although H2O2 did not diffuse beyond the gate in our simulations, the free energy profile shows that the barrier to passage of the reactant is small (less than 20 kJ mol−1), which is consistent with the high turnover rate of the catalase reaction, about 106 per second. This functional role for the major funnel, which is conserved in all known catalase structures, is also supported by experimental alterations of the channel that reduce the catalytic activity (Zamocky et al. 1995; Nicholls et al. 2001). These experiments have shown that there is an optimal opening of the channel for substrate accessibility.
The protonation state of residue His54 modifies quite substantially the environment above the heme. The two water molecules, detected by crystallography, stabilize the H2O2 molecule through a hydrogen bond network involving this special histidine (Bravo et al. 1997) only when the latter is protonated on Nδ1. When Nɛ2 is protonated, the H2O2 molecule is destabilized as both water molecules move away from the active site.
One of the remaining questions concerns the elimination of the products of the reaction. It has been argued that the fast turnover seen for the enzyme mitigates against a single channel that is simultaneously reponsible for the diffusion of reactant into and of products out of the active site, as this would inevitably slow down the reaction, particularly in the region of the gate. For this reason, the two lateral channels present in catalases have been proposed as possible routes for product release (Maté et al. 1999; Sevinc et al. 1999). However, in the case of catalases that bind NADPH, both channels are blocked by the cofactor preventing exit to the protein surface (see, e.g., Fig. 3 ▶) (Maté et al. 1999). Channel I, for the Proteus mirabilis catalase, does not lead to the active site but rather meets the major channel 13 Å from the heme. So even if the products exited the enzyme through channel I, they still have to go through the gate, thus leaving unsolved the question of simultaneous diffusion of substrate/products into and out of the active site. In addition, in the X-ray model that we have used, there are five structural waters in channel I that remained in the channel in the time scale of the dynamics. However, the low energy barrier for passage of water through channel I towards the protein surface (22 kJ mol−1) suggests that exit by this route may be possible, although it is less likely for oxygen as the barrier is higher (33 kJ mol−1). In the case of channel II, no opening to the active site occurred during the dynamics, which prevents any product release using that path.
One possible solution to steric hindrance at the gate might be the presence of cavities that are close to the active site. During the dynamics, it was observed that O2 and H2O molecules diffused into and around these small cavities before returning to the active site and exiting through the gate. These holes, located close to the active center, could help to store the products as other substrate molecules arrive or other products leave. The most important of these cavities is one that starts at the active site and goes towards Ser196, and which we found could accept both O2 and H2O. However, there were others but, because they were smaller, they were principally found to contain H2O.
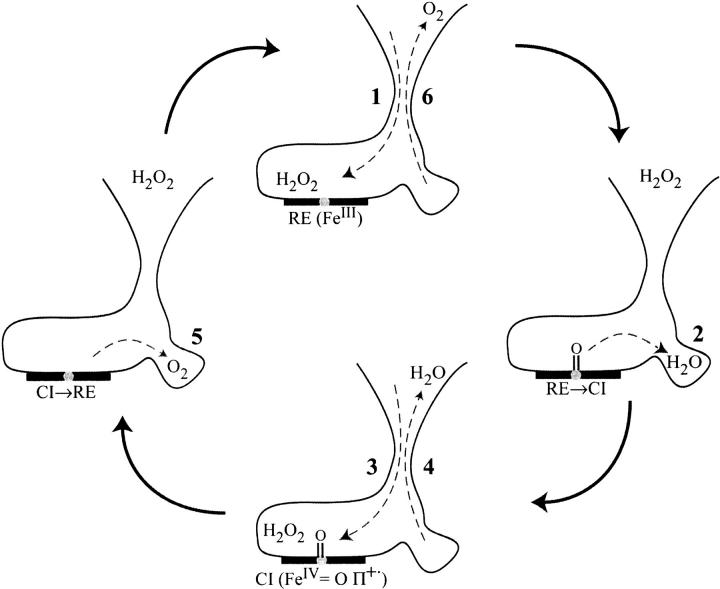
From these results, a model involving the cavity of Ser196 can be proposed for the movements of substrate and products in the catalase reaction (Fig. 9 ▶). During the first step, the molecule of hydrogen peroxide enters the active site (1). It reacts with iron and forms compound I (oxoferryl group FeIV = O porphyrin π cation radical) while the water molecule, produced by the reaction, enters the Ser196 hole (2). Next, a second H2O2 molecule travels to the active site (3) and, during the reaction of compound I with hydrogen peroxide, the water molecule leaves the Ser196 cavity towards the main channel (4). The oxygen molecule produced by this reaction (5) can loiter in the Ser196 cavity while another H2O2 enters to restart the catalytic cycle and can then exit through the main channel (6). It has been observed that in PMC, as in bovine liver catalase, heme is partially degraded to biliverdin or bilirubin (Jouve et al. 1983; Fita and Rossman 1985; Gouet et al. 1995), due to oxidative damage of the prosthetic group. The presence of molecular oxygen in the vicinity of free radicals carried by compound I (a porphyrin π cation radical) could produce reactive radical oxygen species (superoxide anion or hydroxyl radical) causing heme degradation.
Fig. 9.
Proposed model for the movements of substrate and products during the catalase reaction. The heme is represented by a bold horizontal bar with a gray ball for the iron atom. On the right is the Ser196 cavity involved in the model. Dashed arrows show the direction of molecular movements. 1. entrance of the first H2O2 molecule; 2. formation of compound I and storage of a water molecule in the Ser196 cavity; 3. entrance of a second H2O2 molecule; 4. exit of water; 5. reduction of compound I and storage of O2 in the cavity; 6. exit of O2. (RE) resting enzyme; (CI) compound I.
To summarize, we have performed MD simulations and free energy calculations to investigate ligand diffusion in the catalase from Proteus mirabilis. From these we can deduce the following about the channel network in catalases: (a) dynamic fluctuations of the enzyme matrix are essential for the connection of some channels and cavities; (b) the large funnel leading to the heme seems to play the crucial role in allowing access of substrate to the active site; (c) the lateral channel I could, in principle, take water molecules from the main channel and out of the protein. This is much less likely for oxygen; (d) there is no evidence in our simulations of a connection between lateral channel II and the active site; (e) the presence of cavities located in the vicinity of the active site, and within which the products of the reaction can reside, could help to resolve conflicts resulting from the use of the major channel for both substrate entry and product exit, as illustrated by the model proposed for the reaction (Fig. 9 ▶).
Materials and methods
Modeling and molecular dynamics simulations
The starting model for our calculations was the X-ray structure of the catalase from Proteus mirabilis refined at 2.0 Å (P. Andreoletti, G. Sainz, V. Stojanoff, H.M. Jouve, in prep.) including structural waters. The molecular mechanics program CHARMM version 26 (Brooks et al. 1983) and the all-atom CHARMM force field version 22 (Mackerell et al. 1998) were used for all modeling and simulations. CHARMM force field parameters for most of the residues in catalase existed except for (a) the sulfonated Met53; (b) the deprotonated Tyr337, which is the fifth ligand of the heme; and (c) the ligand H2O2. We determined parameters for all of these groups using a mixture of ab initio quantum chemical calculations and standard parametrization techniques. All parameters are available from the authors on request. Ab initio calculations were performed at the MP2 level of theory with the 6–31G* basis set using the program Jaguar (Schrödinger, Inc.).
Hydrogens were added to the model using the HBUILD module (Brünger and Karplus 1988) implemented in CHARMM. The protonation state for titrable residues was determined after a pKa calculation using the cluster method (Antosiewicz et al. 1994) and the UHBD program (Davis et al. 1991). As the resulting system, comprising the homotetramer, contained about 40,000 atoms, we did not add any solvent to the system so as to keep simulations of the system feasible. The final system was minimized to remove local steric hindrances and then Langevin dynamics simulations were performed with a friction coefficient of 100 ps−1 for each of the atoms. A time step of 1 fs and the Leap Verlet method (Allen and Tildesley 1987) were used to integrate the equations of motion. All atoms were allowed to move during the MD simulations and a cutoff of 12 Å was used to compute nonbonding interactions with options recommended for these circumstances by the CHARMM program. The system was first heated from 0–300 K and then a 1-ns dynamics simulation was carried out to equilibrate the system and test the model before investigating the behavior of the reactant and products in the enzyme. Structures were saved every 500 fs for analysis.
The local enhanced sampling algorithm implemented in CHARMM (Elber and Karplus 1990) was used to investigate ligand diffusion. This method simulates the diffusion of several ligands, termed replicas, within a single protein trajectory, and thus permits improved statistics for the diffusion in the enzyme to be obtained at a reasonable cost. The replicas of the ligands interact only with the protein, and are invisible to each other, while the protein feels a mean field induced by all the ligands. As a result, only a few replicas can be employed at a time if the dynamics is not to be significantly altered.
We employed between 10 and 20 replicas per ligand in our simulations, which were typically run for 500 ps, and we had four groups of ligands, one per protein monomer. Initially, all replicas of a given ligand were taken to have the same position, and they were constrained to remain near to their starting position by a harmonic constraint for the first 20 ps of each simulation while the protein was allowed to move. The constraints were then removed and the replicas could diffuse freely for the remaining 480 ps. At first, we tried to place H2O2 molecules in the cavity close to the protein surface, but as we did not include the solvent around the enzyme, the simulation led to most of the replicas leaving the protein. Therefore, we chose to start the replicas off at the entrance to the hydrophobic funnel (close to Met179). The starting positions for the H2O and O2 molecules were located at the cavity above the heme opposite to Tyr337 (Fig. 2 ▶).
Free energy calculations
The LES simulations cannot give time-scale information about the ligand because they are too short (500 ps) compared to the reaction time (500 ns). Therefore, we decided to supplement them by calculating free energy profiles for passage of the ligands through the channels. These were obtained by determining the potential of mean force using the umbrella sampling method (Torrie and Valleau 1974). The strategy we adopted was as follows. (1) We chose a reaction coordinate ɛ that well describes the ligand diffusion along the main channel. For H2O2, H2O, and O2, the same reaction coordinate was used and set to the distance between the heme iron atom and the center of mass of each ligand. (2) Umbrella potentials Vi were defined for each coordinate ɛi as Vi(ɛi) = 1/2 ki (ɛi-ɛi0)2, where ki is the harmonic force constant and ɛi0 is the equilibrium value of ɛi. (3) Sets of 5ps MD simulations were performed on the protein with the umbrella potential and one ligand molecule. We restrained the reaction coordinates to different values of ɛi0. For the three ligand calculations, we used a value of 1046 kJ mol−1 Å−2 and values of ɛi0 ranging from 2 to 16 Å with an increment of 0.025 Å in ɛi0 so as to sample accurately the region where the free energy profile is computed. At each step, the value of ɛi sampled in the simulation was stored. (4) The resulting reaction coordinate distribution (560 values of ɛi0 and 5000 values of ɛi for each ɛi0) was analyzed with the weighted histogram analysis method (WHAM; Kumar et al. 1992). We obtain an unbiased distribution function ρ(ɛ1, . . . ) from WHAM that is then used to get the PMF W(ɛ1, . . . ) = c − kBT ln ≤ρ (ɛ1, . . . )> where kB is the Boltzmann's constant, T the temperature, and c a constant. Here it should be noted that due to the large size of the system we are studying, residues in a sphere of 25 Å embracing the major channel of one monomer were allowed to move while the rest of the system was fixed. This seems to be a reasonable approximation because there is no evidence for cooperativity between monomers and, in any case, the nonbonding interaction cutoff we employed in our calculations was 12 Å. All calculations were done on a FUJITSU VPP-5000/15.
Cavity calculations
The CAVEnv program (Volbeda 1999) was developed for the calculation of cavities in proteins. We used a 0.5 Å grid to calculate two types of map:
Cavity maps were obtained to investigate the channels and cavities in the enzyme. For all structures from the initial 1-ns MD simulation, grid points that are at a distance greater than (Rvdw + Rprobe) are set to 1, and the remaining points are set to zero. We used a probe radius of Rprobe = 1.0 Å, which is smaller than the 1.4 Å usually used, so as to account for the grid error, 0.25 Å, and the hard sphere model in CAVEnv. The Van der Waals radii were taken from the CHARMM force field. The minimal map corresponds to the permanent holes in the protein, while the maximal map corresponds to the sum of the cavities that have appeared during the dynamics regardless of their lifetime. The cavities present on average were also computed.
Ligand probability maps (available upon request) were obtained to analyze the location of the ligand during its diffusion towards or out of the active center. The value of the grid point occupancy was initially set to zero, and was incremented by 1 each time there was a ligand within 1 Å.
Note added in proof
To complete the study of the channel network in the vicinity of the active site of catalase from Proteus mirabilis, we have obtained the free energy profiles for the diffusion of an O2 molecule and a H2O molecule from the heme to channel II via Ser196 (see Fig. 3 ▶). It appears that both products can access this channel but with a larger cost than access to the major channel (17 kJ mol−1 versus 9 kJ mol−1 for O2 and 29 kJ mol−1 versus 15 kJ mol−1 for H2O). To conclude, products of the catalase reaction, with a certain energy cost, can diffuse through the main channel, channel I as well as the narrow part of channel II. Analysis of the barrier heights shows that exiting through channel II is less favored than through the main channel. In addition, access to channel I, which necessitates first passing through the main channel, seems unfavored compared to the passage via the large extension of the main channel to the protein surface. These results do not alter our conclusions (shown in Fig. 9 ▶).
Acknowledgments
The authors thank Dr. A. Volbeda for providing his program CAVEnv, and for helpful discussions, and the Commissariat à l'Energie Atomique and the Centre National de la Recherche Scieique for support of this work.
The publication costs of this article were defrayed in part by payment of page charges. This article must therefore be hereby marked "advertisement" in accordance with 18 USC section 1734 solely to indicate this fact.
Article and publication are at http://www.proteinscience.org/cgi/doi/10.1101/ps.14201.
References
- Allen, M.P. and Tildesley, D.J. 1987. Computer simulation of liquids. Oxford Science Publications, Clarendon Press, Oxford.
- Antosiewicz, J., McCammon, J.A., and Gilson, M.K. 1994. Prediction of pH-dependent properties of proteins. J. Mol. Biol. 238 415–436. [DOI] [PubMed] [Google Scholar]
- Bravo, J., Fita, I., Gouet, P., Jouve, H.M., Melik-Adamyan, W., and Murshudov, G.N. 1997. Structure of catalases. In Oxidative stress and the molecular biology of antioxidant defenses (ed. J.G. Scandalios), pp. 407–445. Cold Spring Harbor Laboratory Press, Cold Spring Harbor, NY.
- Bravo, J., Maté, M.J., Schneider, T., Switala, J., Wilson, J., Loewen, P.C., and Fita, I. 1999. Structure of catalase HPII from Escherichia coli at 1.9 Å resolution. Proteins Struct. Funct. Genet. 34 155–166. [DOI] [PubMed] [Google Scholar]
- Brooks, B.R., Bruccoleri, R.E., Olafson, B.D., States, D.J., Swaminanathan, S., and Karplus, M. 1983. CHARMM: A program for macromolecular energy, minimization, and dynamics calculations. J. Comp. Chem. 4 187–217. [Google Scholar]
- Brünger, A.T. and Karplus, M. 1988. Polar hydrogen positions in proteins: Empirical energy placement and neutron diffraction comparison. Proteins Struct. Funct. Genet. 4 148–156. [DOI] [PubMed] [Google Scholar]
- Brunori, M. 2000. Structural dynamics of myoglobin. Biophys. Chem. 86 221–230. [DOI] [PubMed] [Google Scholar]
- Brunori, M., Cutruzzolà, F., Savino, C., Travaglini-Allocatelli, C., Vallone, B., and Gibson, Q.H. 1999. Structural dynamics of ligand diffusion in the protein matrix: A study of a new myoglobin mutant Y(B10) Q(E7) R(E10). Biophys. J. 76 1259–1269. [DOI] [PMC free article] [PubMed] [Google Scholar]
- Carugo, O. and Argos, P. 1998. Accessibility to internal cavities and ligand binding sites monitored by crystallographic thermal factors. Proteins Struct. Funct. Genet. 31 201–213. [PubMed] [Google Scholar]
- Case, D.A. and Karplus, M. 1979. Dynamics of ligand binding to heme proteins. J. Mol. Biol. 132 343–368. [DOI] [PubMed] [Google Scholar]
- Chang, Y.-T. and Loew, G.H. 1999. Molecular dynamics simulations of P450 BM3—Examination of a substrate-induced conformational change. J. Biomol. Struct. Dynam. 16 1189–1203. [DOI] [PubMed] [Google Scholar]
- Davis, M.E., Madura, J.D., Luty, B.A., and McCammon, J.A. 1991. Electrostatics and diffusion of molecules in solution: Simulations with the University of Houston Brownian dynamics program. Comp. Phys. Commun. 62 187–197. [Google Scholar]
- Elber, R. and Karplus, M. 1990. Enhanced sampling in molecular dynamics: Use of the time-dependent Hartree approximation for a simulation of carbon monoxide diffusion through myoglobin. J. Am. Chem. Soc. 112 9161–9175. [Google Scholar]
- Enyedy, I.J., Kovach, I.M., and Brooks, B.R. 1998. Alternate pathways for acetic acid and acetate ion release from acetylcholinesterase: A molecular dynamics study. J. Am. Chem. Soc. 120 8043–8050. [Google Scholar]
- Fita, I. and Rossmann, M.G. 1985. The active center of catalase. J. Mol. Biol. 185 21–37. [DOI] [PubMed] [Google Scholar]
- Gouet, P., Jouve, H.M., and Dideberg, O. 1995. Crystal structure of Proteus mirabilis PR catalase with and without bound NADPH. J. Mol. Biol. 249 933–954. [DOI] [PubMed] [Google Scholar]
- Hubbard, S.J., Gross, K.-H., and Argos, P. 1994. Intramolecular cavities in globular proteins. Protein Eng. 7 613–626. [DOI] [PubMed] [Google Scholar]
- Jouve, H.M., Tessier, S., and Pelmont, J. 1983. Purification and properties of the Proteus mirabilis catalase. Can. J. Biochem. Cell Biol. 61 8–14. [DOI] [PubMed] [Google Scholar]
- Kumar, S., Bouzida, D., Swendsen, R.H., Kollman, P.A., and Rosenberg, J.M. 1992. The weighted histogram analysis method for free-energy calculations on biomolecules. I. The method. J. Comp. Chem. 13 1011–1021. [Google Scholar]
- Lüdemann, S.K., Lounnas, V., and Wade, R.C. 2000a. How do substrates enter and products exit the buried active site of cytochrome P450cam? 1. Random expulsion molecular dynamics investigation of ligand access channels and mechanisms. J. Mol. Biol. 303 797–811. [DOI] [PubMed] [Google Scholar]
- ———. 2000b. How do substrates enter and products exit the buried active site of cytochrome P450cam? 2. Steered molecular dynamics and adiabatic mapping of substrate pathways. J. Mol. Biol. 303 813–830. [DOI] [PubMed] [Google Scholar]
- Mackerell Jr., A.D., Bashford, D., Bellott, M., Dunbrack Jr., R.L., Evanseck, J.D., Field, M.J., Fischer, S., Gao, J., Guo, H., Ha, S., et al. 1998. All-atom empirical potential for molecular modeling and dynamics studies of proteins. J. Phys. Chem. B 102 3586–3616 [DOI] [PubMed] [Google Scholar]
- Maté, M.J., Zamocky, M., Nykyri, L.M., Herzog, C., Alzari, P.M., Betzel, C., Koller, F., and Fita, I. 1999. Structure of catalase-A form Saccharomyces cerevisiae. J. Mol. Biol. 268 135–149. [DOI] [PubMed] [Google Scholar]
- Montet, Y., Amara, P., Volbeda, A., Vernede, X., Hatchikian, E.C., Field, M.J., Frey, M., and Fontecilla-Camps, J.C. 1997. Gas access to the active site of Ni-Fe hydrogenases probed by X-ray crystallography and molecular dynamics. Nat. Struct. Biol. 4 523–526. [DOI] [PubMed] [Google Scholar]
- Nicholls, P., Fita, I., and Loewen, P.C. 2001. Enzymology and structure of catalases. Adv. Inorg. Chem. 51 51–106. [Google Scholar]
- Otting, G., Liepinsh, E., Halle, B., and Frey, U. 1997. NMR ideication of hydrophobic cavities with low water occupancies in protein structures using small gas molecules. Nat. Struct. Biol. 4 396–404. [DOI] [PubMed] [Google Scholar]
- Sevinc, M.S., Maté, M.J., Switala, J., Fita, I., and Loewen, P.C. 1999. Role of the lateral channel in catalase HPII of Escherichia coli. Protein Sci. 8 490–498. [DOI] [PMC free article] [PubMed] [Google Scholar]
- Tara, S., Helms, V., Straatsma, T.P., and McCammon, J.A. 1999. Molecular dynamics of mouse acetylcholinesterase complexed with huperzine A. Biopolymers 50 347–359. [DOI] [PubMed] [Google Scholar]
- Tilton Jr., R.F., Singh, U.C, Weiner, S.J., Connolly, M.L., Kuntz Jr., I.D., Kollman, P.A., Max, N., and Case, D.A. 1986. Computational studies of the interaction of myoglobin and xenon. J. Mol. Biol. 192 443–456. [DOI] [PubMed] [Google Scholar]
- Tilton Jr., R.F., Singh, U.C., Kuntz Jr., I.D., and Kollman, P.A. 1988. Protein–ligand dynamics: A 96 picosecond simulation of a myoglobin–xenon complex. J. Mol. Biol. 199 195–211. [DOI] [PubMed] [Google Scholar]
- Torrie, G.M. and Valleau, J.P. 1974. Monte Carlo free energy estimates using non-Boltzmann sampling: Application to the sub-critical Lennard-Jones lluid. Chem. Phys. Lett. 28 578–581. [Google Scholar]
- Volbeda, A. 1999. Spéléologie des hydrogénases à nickel et à fer. Ecoles Phys. Chim. Vivant 1 47–52. [Google Scholar]
- Zamocky, M., Herzog, Ch., Nykyri, L.M., and Koller F. 1995. Site-directed mutagenesis of the lower parts of the major substrate channel of yeast cattalos A leads to highly increased peroxidatic activity. FEBS Lett. 367 241–245. [DOI] [PubMed] [Google Scholar]


