A recombinant virus-like particle that is a potential oral hepatitis E vaccine was crystallized. Diffraction data were collected to 8.3 Å resolution and the X-ray structure was phased with the aid of a low-resolution density map determined using cryo-electron microscopy data.
Keywords: hepatitis E virus, virus-like particle, electron microscopy, vaccines
Abstract
Hepatitis E virus (HEV) accounts for the majority of enterically transmitted hepatitis infections worldwide. Currently, there is no specific treatment for or vaccine against HEV. The major structural protein is derived from open reading frame (ORF) 2 of the viral genome. A potential oral vaccine is provided by the virus-like particles formed by a protein construct of partial ORF3 protein (residue 70–123) fused to the N-terminus of the ORF2 protein (residues 112–608). Single crystals obtained by the hanging-drop vapour-diffusion method at 293 K diffract X-rays to 8.3 Å resolution. The crystals belong to space group P212121, with unit-cell parameters a = 337, b = 343, c = 346 Å, α = β = γ = 90°, and contain one particle per asymmetric unit.
1. Introduction
The hepatitis E virus (HEV) is a naked icosahedral capsid with a single-stranded positive-sense RNA of 7.2 kbp. The genome encodes three open reading frames (ORFs). ORF1, mapped to the 5′-terminus, encodes nonstructural proteins that are mainly involved in virus replication and protein processing. ORF2, mapped to the 3′-terminus, encodes a viral capsid protein of 660 amino acids that has been found to elicit neutralizing antibodies (Meng et al., 2001 ▶; Schofield et al., 2000 ▶). ORF3, mapped between ORF1 and ORF2, encodes a protein of 123 amino-acid residues that may interfere with control functions within the infected cell, as summarized by Panda et al. (2007 ▶). When the N-terminally truncated ORF2 protein (residues 112–660) was expressed with a recombinant baculovirus in an insect-cell line, self-assembling virus-like particles (VLPs) were released into the cell supernatant (Li et al., 1997 ▶). These VLPs have been shown to induce anti-HEV antibodies when orally administered to experimental animals (Li et al., 2004 ▶). By N- and C-terminal sequencing, the VLP-forming protein was found to be composed of residues 112–608 of the ORF2 protein (VLPORF2); thus, 52 residues at the C-terminus were cleaved during VLP formation (Li et al., 1997 ▶). We have previously reported the structure of HEV-VLPORF2 obtained using electron cryomicroscopy (cryo-EM), which provided a preliminary understanding of the quaternary arrangement of the viral capsids. A three-dimensional reconstruction of VLPORF2 displays T = 1 icosahedral symmetry and is composed of 60 copies of the truncated ORF2 protein (Xing et al., 1999 ▶; Li et al., 2005 ▶).
Although a truncated ORF2 polypeptide is undergoing clinical trials as a vaccine candidate (Shrestha et al., 2007 ▶), to date no specific treatment or vaccine has been licensed for HEV (Purcell & Emerson, 2008 ▶). The viral capsid is an important form of presenting the conformation-dependent epitopes (Maloney et al., 2005 ▶) and HEV-VLPORF2 has been proposed as a suitable candidate for an oral vaccine (Li et al., 2004 ▶). Further investigations of the high-resolution structural features of a VLP are required in order to establish the folding and interactions of the viral protein in the context of the HEV particle form, as well as to characterize the immunogenic epitopes that are responsible for inducing the neutralizing antibodies. In the present study, we describe the crystallization and preliminary crystallographic characterization of a purified HEV-VLPORF3/ORF2 capsid composed of a fusion protein obtained by inserting a fragment of ORF3 (residues 70–123) at the N-terminus of the ORF2 peptide including residues 112–608.
2. Experimental procedures and results
2.1. Expression and purification of recombinant HEV-VLPs
Recombinant HEV-VLPORF3/ORF2 was produced using a similar approach to those described previously (Li et al., 1997 ▶; Xing et al., 1999 ▶) except that an ORF3/ORF2 fusion protein containing a fragment of the ORF3 protein (residues 70–123) attached without an intervening sequence to the N-terminus of a truncated ORF2 protein (residues 112–608) was used in the construct for expression. The transfer vector was co-transfected with insect Sf9 cells (Riken Cell Bank, Tsukuba, Japan) to produce the recombinant baculovirus. The recombinant baculovirus obtained was plaque-purified three times. For large-scale expression, an insect-cell line from Trichoplusia ni, BTL-Tn 5B1-4 (Tn5; Invitrogen, San Diego, California, USA), was used and was infected with recombinant baculovirus at a multiplicity of infection of 10. The cells were incubated in EX-CELL-405 medium (JRH Biosciences, Lenexa, Kansas, USA) for 7 d at 300 K. The VLPs were harvested from the supernatant. The recombinant baculovirus and cell debris were removed by centrifugation at 10 000g for 90 min at 277 K. The VLPs in the supernatant were then spun down at 100 000g for 2 h at 277 K. The resulting VLP pellets were then resuspended in EX-CELL-405 medium and further purified in a CsCl equilibrium density gradient. On inspection by negative-staining EM, the morphology of VLPORF3/ORF2 appeared to be similar to that of VLPORF2, except for an extra density within the particles.
Prior to crystallization or cryo-electron microscopy (EM) experiments, the purified VLPs were pelleted through a 5%(w/v) sucrose cushion in 50 mM potassium–MES buffer pH 6.2 at 110 000g in a Beckman SW 55-Ti rotor at 277 K for 1 h. The pellet was resuspended in 50 mM potassium–MES buffer pH 6.2 and maintained at 277 K for 10 min. The concentration of recombinant HEV-VLP was adjusted to 10 mg ml−1 according to the standard concentration curve determined from the light absorbance at 260 and 280 nm. The quality of the purified particles was routinely verified by EM using 2%(w/v) uranyl acetate negative-stain contrast (Agar Scientific Ltd, Stansted, England) and SDS–PAGE performed on 8–25% acrylamide gels under denaturing conditions (Gong et al., 1990 ▶; Cheng et al., 1992 ▶).
2.2. Cryo-EM and three-dimensional reconstruction of purified VLPORF3/ORF2
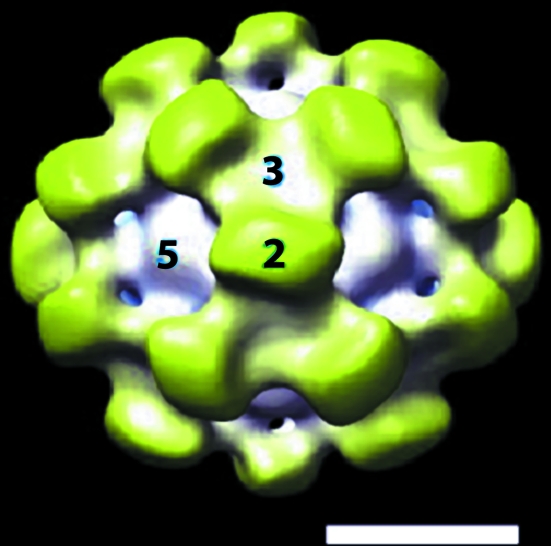
Cryo-EM sample preparation followed previously established procedures (Xing et al., 1999 ▶). Briefly, a 3.5 µl drop of VLPORF3/ORF2 suspension was applied onto a glow-discharged ‘holey’ carbon-coated grid, blotted with filter paper and vitrified by rapidly plunging the grids into liquid ethane cooled by liquid nitrogen. The grids, with the frozen VLPORF3/ORF2 physically fixed to fill in the holes of the carbon film after rapid freezing, were transferred to an FEI CM-120 microscope using a Gatan 626DH cryoholder and all subsequent steps were carried out with the sample maintained at 95 K. The electron microscope was operated at 120 kV and low-dose (<7 e− Å−2) images were recorded on Kodak SO163 films at a magnification of 45 000×. Selected micrographs with a defocus level of 1000 nm were digitized using a Zeiss microdensitometer (Z/I imaging) at a step size of 14 µm, which corresponds to 3.1 Å per pixel at the level of the specimen. The first zero of the contrast transfer function was at a spatial frequency of ∼0.056 Å−1. Isolated VLP images were extracted from the digitized micrographs, normalized and combined into one single image-stacked file for subsequent processing. Determination of the structure was carried out using a model-based polar Fourier transform (PFT) method (Cheng et al., 1994 ▶; Baker & Cheng, 1996 ▶). As the PFT algorithm requires a three-dimensional model to start with, a cryo-EM density map of VLPORF2 was used as an initial model (Xing et al., 1999 ▶). The model was low-pass filtered to 40 Å resolution in order to reduce the influence of noise bias included in image processing. The starting model was back-projected at 1° angular increments to create an image database that covered all possible views of the model at the orientations within one half of the icosahedral asymmetric unit. Individual unique views of model projections in the database were interpolated onto a polar grid to form a polar projection (PRJ) image and the PRJ image was then Fourier transformed to produce a PFT image; these PRJ and PFT images were stored in two separate files for use as references for alignment with individual images of PFTs and PRJs from the selected VLP projections (Cheng et al., 1994 ▶; Baker & Cheng, 1996 ▶). In addition, the alignment was performed with enhanced accuracy by initially including a band-pass filter (spatial frequency between 1/90 Å−1 and 1/30 Å−1) of the PFT images to optimize the search for origins and orientations. A list of origins and orientations corresponding to each particle was obtained and a noise-filtered three-dimensional reconstruction was computed using the Fourier–Bessel algorithm implemented with a cylinder expansion method and imposed 522 symmetry (Crowther, 1971 ▶; Cheng et al., 1992 ▶; Fuller et al., 1996 ▶). The presence of the threefold symmetry in the three-dimensional model validated the accuracy of the reconstruction. The search model was subsequently updated with the newly computed three-dimensional density map of VLPORF3/ORF2 through individual cycles of refinement to make the orientations and origins of the image data to be included in the averaging of the subsequent density maps more accurate. The cryo-EM structural density of VLPORF3/ORF2 for use in initial phasing of the X-ray diffraction data was achieved by the progressive addition of data at higher spatial frequency. The iterations were continued by re-projecting the model at a finer angular increment (0.5°) and by progressively extending the low-pass filter from 30 to 20 Å. The cycles of refinement stopped when no major improvement was observed in the three-dimensional reconstruction. Fourier shell correlations of the reconstruction yielded an estimated resolution of 24 Å for recombinant HEV-VLPORF3/ORF2 based on Fourier averaging of 134 VLP images (Fig. 1 ▶). VLPORF3/ORF2 has a diameter of ∼270 Å and the capsid shell was composed of 30 dimer-like protrusions arranged in a T = 1 icosahedral surface lattice. Analysis of the density-distribution map revealed VLPORF3/ORF2 to consist of 60 subunits of the fusion protein. The VLP structure demonstrated two distinct domains, namely the shell domain, which forms a continuous layer of viral capsid, and the protrusion domain, which forms protruding spikes (Cheng et al., 1992 ▶, 1995 ▶). The cryo-EM density map of VLPORF3/ORF2 was subsequently used for initial phasing of the data collected by X-ray diffraction.
Figure 1.
Three-dimensional structure of recombinant HEV-VLPORF3/ORF2 at a resolution of 24 Å determined by cryo-EM and image reconstruction. An isosurface representation of the outer surface of recombinant HEV-VLPORF3/ORF2 is shown viewed along the icosahedral twofold axis. The surface density was contoured at a level corresponding to 100% mass of the expected particle volume. The particle is color-coded to differentiate two distinct domains: the shell domain (white) and the protrusion domain (yellow). The surface capsid conforms to T = 1 icosahedral symmetry in which the 60 subunits are arranged into 30 protruding spikes with the homodimers as the basic building blocks at each icosahedral twofold axis. The scale bar represents 100 Å.
2.3. Crystallization strategy and data collection
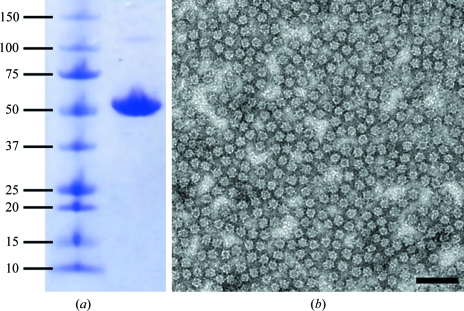
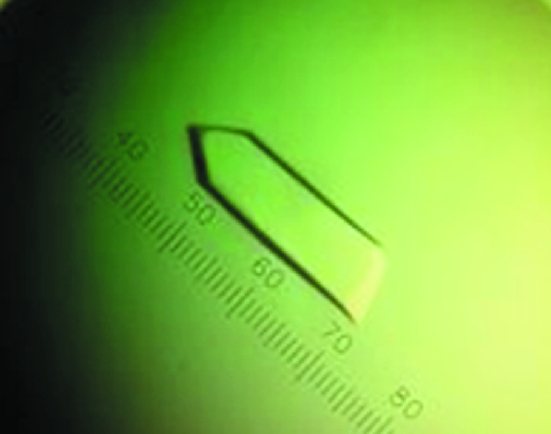
The initial crystallization trials were performed by the hanging-drop method (McPherson, 2004a ▶,b ▶) with a commercially available kit, Crystal Screen Lite, from Hampton Research (Laguna Niguel, California, USA) at 293 K. The crystallization drops contained 2 µl VLPORF3/ORF2 solution at various concentrations mixed with 2 µl screening solution and were set up for vapor diffusion against 1 ml screening solution in 24-well plates (Falcon). Crystals were obtained using two different conditions: (i) 4%(w/v) polyethylene glycol (PEG) 4000 in 100 mM sodium acetate pH 4.6 and (ii) 4%(w/v) PEG 8000 in 100 mM Tris–HCl pH 8.5. In condition (i) a number of small crystals appeared within a few minutes, while in condition (ii) the crystals appeared after one week. To further assess the integrity of the VLPs packed in the crystals, we selected crystals from both the pH 4.6 and pH 8.5 conditions, dissolved them in the respective reservoir solution and performed negative-staining EM with 2%(w/v) uranyl acetate (Gong et al., 1990 ▶). The VLPs had remained intact within the crystals in both conditions (Fig. 2 ▶). The quality of these crystals was assessed using an in-house X-ray generator. The crystals obtained at pH 4.6 diffracted to a lower resolution (40 Å) compared with those obtained at pH 8.5 (20 Å). Based on this result, the crystallization conditions were further optimized by changing the PEG 8000 and VLP concentrations. Good-quality crystals were obtained with 3.5%(w/v) PEG 8000 in 100 mM Tris–HCl pH 8.5; these crystals were rod-shaped and reached a maximum length of 1 mm after 14 d (Fig. 3 ▶).
Figure 2.
Purity and integrity of recombinant HEV-VLPORF3/ORF2 crystals grown in 4%(w/v) PEG 8000, 100 mM Tris–HCl pH 8.5 analyzed by SDS–PAGE (a) and negative-stained electron microscopy (b). In (a), the left lane contains molecular-weight markers (kDa) and the right lane contains the protein band of recombinant HEV-VLP from a dissolved crystal. In (b), a recombinant HEV-VLPORF3/ORF2 crystal was crushed with a nylon loop and stained with 2% uranyl acetate; the VLPs remained with intact capsid morphology after dissolving from the crystal. The bar represents 1000 Å.
Figure 3.
Recombinant HEV-VLPORF3/ORF2 crystal. The crystal was grown in Tris–HCl pH 8.5 buffer, 3.5%(w/v) PEG 8000 with the addition of 30% ethylene glycol as a cryoprotectant. In the scale, 28 intervals represent 0.1 mm.
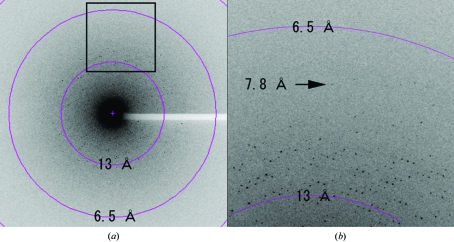
The HEV-VLPORF3/ORF2 crystals were immersed for 2 min in reservoir solution containing 20, 30 or 40%(v/v) ethylene glycol as a cryoprotectant. A single crystal was picked up with a cryoloop and directly flash-frozen in liquid nitrogen. The HEV-VLPORF3/ORF2 crystals were found to be very fragile and cracked in most cases. Therefore, the VLPs were subsequently crystallized under the same conditions with the addition of 20–40%(v/v) ethylene glycol to the reservoir. The crystals obtained had a similar appearance to those obtained without the addition of ethylene glycol. One of the resulting crystals was successfully frozen and diffracted X-rays to beyond 7.8 Å resolution at 100 K on a DIP6040 imaging-plate/CCD hybrid detector (MacScience, Bruker-AXS) with a crystal-to-detector distance of 700 mm, an oscillation angle of 1.0° and an exposure time of 10 s using synchrotron radiation at SPring-8 (Hyogo, Japan) beamline BL44XU (Fig. 4 ▶). As the crystal decayed during data collection, the data set was only processed to 8.3 Å resolution. The diffraction images were indexed, reduced, scaled and merged using the HKL-2000 package (Otwinowski & Minor, 1997 ▶). The intensities were converted into the structure-factor amplitudes using TRUNCATE from the CCP4 package (Collaborative Computational Project, Number 4, 1994 ▶). The space group was determined to be P212121 by scaling in the resolution range 70–8.3 Å assuming Laue group 222 (R merge = 13.6% from SCALEPACK) and was assigned on the basis of systematic absences of odd reflections along the h00, 0k0 and 00l axes. The unit-cell parameters were a = 337, b = 343, c = 346 Å, α = β = γ = 90°. The statistics of data collection are summarized in Table 1 ▶. The value of I/σ(I) was found to be 8.3 and 2.2 for the resolution ranges 70–8.3 and 8.6–8.3 Å, respectively. The R merge for the outermost resolution shell was slightly worse than for most low-symmetry protein structure determinations. In this case of viral crystallography, the additional noncrystallographic averaging (60-fold) and the solvent flattening provided the phasing power required to successfully employ the diffraction data to 8.3 Å resolution. While four particles were found in one unit cell (with a molecular weight of 3.2 × 10⁶ Da), there is only one complete VLP per asymmetric unit, resulting in 60-fold noncrystallographic symmetry redundancy. The calculated Matthews coefficient V M is 3.1 Å3 Da−1 (Matthews, 1968 ▶).
Figure 4.
A diffraction pattern recorded from a recombinant HEV-VLPORF3/ORF2 crystal. (a) A typical 1.0° oscillation photograph exposed for 10 s. The concentric circles indicate the 13.0 and 6.5 Å resolution shells. (b) An enlarged image shows a diffraction spot observed at 7.8 Å (indicated by an arrow).
Table 1. Crystal information and data-processing statistics.
Values in parentheses are for the outermost shell.
| Space group | P212121 |
| Unit-cell parameters (Å, °) | a = 337, b = 343, c = 346, α = β = γ = 90 |
| Resolution range (Å) | 70.00–8.30 (8.60–8.30) |
| Wavelength (Å) | 0.9 |
| Total No. of crystals | 1 |
| Total No. of reflections | 101760 |
| Unique reflections | 33414 (3347) |
| Completeness (%) | 87.6 (89.4) |
| Multiplicity | 3.0 (3.0) |
| I/σ(I) | 8.3 (2.2) |
| Rmerge† | 0.136 (0.500) |
R
merge = 
 , where Ii(hkl) is the intensity of an individual measurement of the reflection hkl and 〈I(hkl)〉 is the mean intensity for all measurements including symmetry equivalents.
2.4. Phase determination
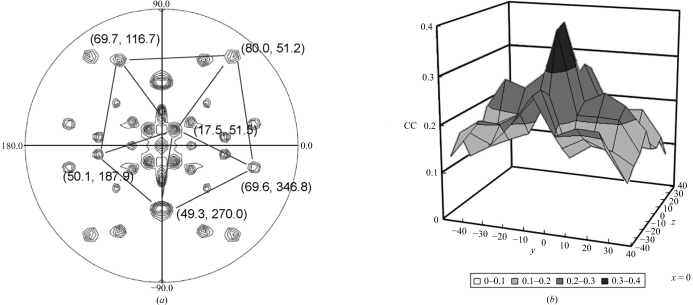
A self-rotation function was computed using the program POLARRFN from the CCP4 package in order to determine the orientation of the icosahedral noncrystallographic symmetry elements. By using reflections in the resolution range 15–10 Å, a fast rotation function was calculated with an integration radius of 130 Å and a B factor of −70 Å2. The section corresponding to the fivefold axis is depicted in Fig. 5 ▶(a). The fivefold rotation function was consistent with the presence of four particles per unit cell. Six peaks were clearly identified corresponding to one of the four particles in the unit cell. While additional peaks were observed corresponding to the symmetry-related particles, some unexpected peaks might arise from the 72° rotational relationship between the icosahedral particles, as they were reproduced from the calculated data using a cryo-EM map. Subsequently, the molecular-replacement method starting from a cryo-EM density map (Fig. 1 ▶) was used to phase the reflections. The original cryo-EM map was rotated to superimpose the icosahedral symmetry axes of the cryo-EM density onto the VLP orientation determined by the rotation function using the matrix
Packing considerations suggested that the particle is situated close to the positions in space group P212121 with x = 0, y = 0, z = 0 or x = 0.25, y = 0.25, z = 0.25. The correlation coefficient was computed between the structure factors observed from the amplitudes of the X-ray diffraction data (F o) and the amplitudes of the calculated structure factor (F c) derived from Fourier transformation of the cryo-EM model properly rotated and positioned in the crystal unit cell around these two positions using the programs MAVE from the RAVE package of the Uppsala Software Factory (Kleywegt et al., 2001 ▶) and SFALL and RSTATS from the CCP4 package. The translation search was initially carried out with a coarse interval of 10 Å steps using data in the resolution range 70–30 Å. After searching with a finer interval of 2 Å, a maximum correlation coefficient value of 0.41 was reached at the origin (−2, 0, −6 Å) (Fig. 5 ▶ b). Phase refinement and extension were carried out in the resolution range 30–8.3 Å using real-space averaging and solvent flattening with the RAVE and CCP4 packages as performed in our previous work (Nakagawa et al., 2003 ▶). The final correlation coefficient and R factor between the F os and the F cs obtained from inversion of the averaged and solvent-flattened map at 8.3 Å resolution were 0.92 and 0.21, respectively.
Figure 5.
Phasing X-ray data with a cryo-EM density map. (a) Fivefold self-rotation function peaks calculated in POLARRFN with data in the resolution range 15–10 Å and a radius of integration of 130 Å. The positions (ϕ, ψ) corresponding to one of the four particles in the unit cell are indicated. (b) Translational correlation coefficient search for the origin of recombinant HEV-VLPORF3/ORF2. The data used in the calculations were in the resolution range 70–30 Å (only the result at x = 0 is shown). The search grid started at the coarse interval of 10 Å and was refined at a finer interval of 2 Å. The maximum correlation coefficient was observed at the point (−2, 0, −6 Å).
3. Conclusion
We report here the detailed conditions for the crystallization of recombinant HEV-VLPORF3/ORF2 and the implementation of a 24 Å cryo-EM density map in the initial phasing of the X-ray diffraction data. The diffraction data presented carry sufficient information for determining the density map of a 270 Å diameter VLPORF3/ORF2 to a resolution of 8.3 Å. The availability of data with improved resolution provides the structural information needed for the better understanding of virus-particle assembly and will be very valuable for HEV vaccine design.
Acknowledgments
We thank Drs Andy Fisher and Lena Hammar for their critical editing of the manuscript. This project was supported by grants from Cancer Research Center, Swedish Research Council and EC/FP6 Levmac (RHC). C-YW, NM and LX were supported by grants from Cancer Research, STINT Foundation and Discovery Programs, respectively. Part of the data-analysis scheme developed in this study was supported by the National Institutes of Health through the NIH Roadmap for Medical Research (PN2EY018230). C-YW and NM were initially supported as exchange students by the NYMU International Competitiveness Grant and a Grant-in-Aid for 21st Century Centers of Excellence Program, respectively. This article is part of the requirement for the PhD degree fulfilment of C-YW and TY.
References
- Baker, T. S. & Cheng, R. H. (1996). J. Struct. Biol.116, 120–130. [DOI] [PubMed]
- Cheng, R. H., Kuhn, R. J., Olson, N. H., Rossmann, M. G., Choi, H. K., Smith, T. J. & Baker, T. S. (1995). Cell, 80, 621–630. [DOI] [PMC free article] [PubMed]
- Cheng, R. H., Olson, N. H. & Baker, T. S. (1992). Virology, 186, 655–668. [DOI] [PMC free article] [PubMed]
- Cheng, R. H., Reddy, V. S., Olson, N. H., Fisher, A. J., Baker, T. S. & Johnson, J. E. (1994). Structure, 2, 271–282. [DOI] [PMC free article] [PubMed]
- Collaborative Computational Project, Number 4 (1994). Acta Cryst. D50, 760–763.
- Crowther, R. A. (1971). Philos. Trans. R. Soc. Lond. B Biol. Sci.261, 221–230. [DOI] [PubMed]
- Fuller, S. D., Butcher, S. J., Cheng, R. H. & Baker, T. S. (1996). J. Struct. Biol.116, 48–55. [DOI] [PubMed]
- Gong, Z. X., Wu, H., Cheng, R. H., Hull, R. & Rossmann, M. G. (1990). Virology, 179, 941–945. [DOI] [PubMed]
- Kleywegt, G. J., Zou, J.-Y., Kjeldgaard, M. & Jones, T. A. (2001). International Tables for Crystallography, Vol. F, edited by E. Arnold & M. G. Rossmann, pp. 354–355. Dordrecht: Kluwer Academic Publishers.
- Li, T. C., Suzaki, Y., Ami, Y., Dhole, T. N., Miyamura, T. & Takeda, N. (2004). Vaccine, 22, 370–377. [DOI] [PubMed]
- Li, T. C., Takeda, N., Miyamura, T., Matsuura, Y., Wang, J. C., Engvall, H., Hammar, L., Xing, L. & Cheng, R. H. (2005). J. Virol.79, 12999–13006. [DOI] [PMC free article] [PubMed]
- Li, T. C., Yamakawa, Y., Suzuki, K., Tatsumi, M., Razak, M. A., Uchida, T., Takeda, N. & Miyamura, T. (1997). J. Virol.71, 7207–7213. [DOI] [PMC free article] [PubMed]
- McPherson, A. (2004a). J. Struct. Funct. Genomics, 5, 3–12. [DOI] [PubMed]
- McPherson, A. (2004b). Methods, 34, 254–265. [DOI] [PubMed]
- Maloney, B. J., Takeda, N., Suzaki, Y., Ami, Y., Li, T. C., Miyamura, T., Arntzen, C. J. & Mason, H. S. (2005). Vaccine, 23, 1870–1874. [DOI] [PubMed]
- Matthews, B. W. (1968). J. Mol. Biol.33, 491–497. [DOI] [PubMed]
- Meng, J., Dai, X., Chang, J. C., Lopareva, E., Pillot, J., Fields, H. A. & Khudyakov, Y. E. (2001). Virology, 288, 203–211. [DOI] [PubMed]
- Nakagawa, A., Miyazaki, N., Taka, J., Naitow, H., Ogawa, A., Fujimoto, Z., Mizuno, H., Higashi, T., Watanabe, Y., Omura, T., Cheng, R. H. & Tsukihara, T. (2003). Structure, 11, 1227–1238. [DOI] [PubMed]
- Otwinowski, Z. & Minor, W. (1997). Methods Enzymol.276, 307–326. [DOI] [PubMed]
- Panda, S. K., Thakral, D. & Rehman, S. (2007). Rev. Med. Virol.17, 151–180. [DOI] [PubMed]
- Purcell, R. H. & Emerson, S. U. (2008). J. Hepatol.48, 494–503. [DOI] [PubMed]
- Schofield, D. J., Glamann, J., Emerson, S. U. & Purcell, R. H. (2000). J. Virol.74, 5548–5555. [DOI] [PMC free article] [PubMed]
- Shrestha, M. P. et al. (2007). N. Engl. J. Med.356, 895–903. [DOI] [PubMed]
- Xing, L., Kato, K., Li, T., Takeda, N., Miyamura, T., Hammar, L. & Cheng, R. H. (1999). Virology, 265, 35–45. [DOI] [PubMed]


