The crystal structure of the SH3 domain of rat endophilin A2 has been determined by the multiwavelength anomalous dispersion method and refined at a resolution of 1.70 Å to R and R free values of 0.196 and 0.217, respectively.
Keywords: endophilin A2, SH3 domain
Abstract
The crystal structure of the SH3 domain of rat endophilin A2 has been determined by the multiwavelength anomalous dispersion method and refined at a resolution of 1.70 Å to R and R free values of 0.196 and 0.217, respectively. The structure adheres to the canonical SH3-domain fold and is highly similar to those of the corresponding domains of endophilins A1 and A3. An intermolecular packing interaction between two molecules in the lattice exploits features that are commonly observed in SH3-domain ligand recognition, including the insertion of a proline side chain into the ligand-binding groove of the protein and the recognition of a basic residue by a cluster of acidic side chains on the RT loop.
1. Introduction
SH3 domains are protein-recognition modules that occur widely in eukaryotic species (Mayer, 2001 ▶). In general, they recognize proline-rich sequences that adopt the polyproline type II helical conformation, which dock onto a shallow hydrophobic groove on the surface of the protein; the ligand typically contains a basic residue that interacts with acidic groups on the SH3 domain. However, there is substantial variation in the structural details of how different SH3 domains recognize ligands (Musacchio, 2002 ▶). Two different orientations of the polyproline helix have been observed in the binding groove and some ligands exploit additional binding epitopes on the protein that lie outside the canonical binding groove.
Endophilin A2 (also known as SH3 domain-containing GRB2-like protein 1 or SH3p8; SwissProt accession No. O35964) is an SH3 domain-containing protein that is involved in the clathrin-mediated endocytosis and recycling of synaptic vesicles (Ringstad et al., 1997 ▶). Its SH3 domain lies at the C-terminus of the protein and can bind proline-rich sequences on other endocytotic proteins, including synaptojanin and dynamin (Slepnev & De Camilli, 2000 ▶; Verstreken et al., 2003 ▶). Endophilin A2 binds the C-terminus of the voltage-gated calcium channel in a calcium-dependent manner, which serves to enrich the endocytotic machinery at nerve terminals (Chen et al., 2003 ▶). Recognition of an internal upstream proline-rich sequence by the SH3 domain of the molecule is thought to mediate the calcium-dependent interaction of endophilin with the channel. As part of an effort to understand the protein–protein recognition processes involving this molecule, we have elucidated the X-ray crystal structure of the SH3 domain of rat endophilin A2.
2. Materials and methods
2.1. Protein production and purification
The portion of the rat endophilin A2 gene coding for the SH3 domain (amino acids 303–368) was subcloned into a pGST-parallel1 vector (Sheffield et al., 1999 ▶). The resulting construct encodes a glutathione-S-transferase-SH3 fusion protein connected by a cleavable linker containing a recognition site for TEV protease. Following cleavage, the SH3 domain is predicted to contain the sequence GAMDPEFM… at its N-terminus, where the first seven residues are derived from the vector and the bold M corresponds to Met303 of endophilin A2. The predicted weight of the species crystallized is 8249 Da.
Selenomethionine-substituted (SeMet) protein was expressed in Rosetta (DE3) pLysS cells (Novagen). Overnight cultures were spun down and resuspended in M9 medium supplemented with 0.4% glucose, 1 mg ml−1 MgSO4, 0.3 mM CaCl2, 1 µg ml−1 biotin, 1 µg ml−1 thiamine, trace elements, 100 µg ml−1 ampicillin and 34 µg ml−1 chloramphenicol. Cells were grown at 310 K to an optical density of 0.8, at which point the following amino acids were added: Lys, Phe and Thr (100 mg l−1) and Ile, Leu, Val and SeMet (50 mg l−1; Van Duyne et al., 1993 ▶). The cells were incubated for an additional 15 min at 310 K, after which protein expression was induced with 400 µM IPTG, the temperature was reduced to 291 K and the cells were grown overnight. Cells were harvested by centrifugation, resuspended in phosphate-buffered saline (PBS) containing 1 mM EDTA and 2 mM β-mercaptoethanol (BME) and frozen.
For purification, the cells were thawed and lysed, polyethyleneimine was added to a final concentration of 0.1%(w/v) and the lysate was centrifuged for 30 min at 21 500g. The cleared lysate was applied onto a glutathione-Sepharose column equilibrated with PBS supplemented with 2 mM EDTA and 10 mM BME, washed with the same buffer and eluted with 10 mM reduced glutathione in 50 mM Tris–HCl pH 8, 50 mM NaCl, 2 mM EDTA, 10 mM BME. Fractions containing the fusion protein were pooled, added to a dialysis bag with His6-tagged TEV protease (2 mg protease per litre of culture processed) and dialyzed overnight at 277 K against PBS supplemented with 5% glycerol and 10 mM BME. The dialysate was then re-run over the regenerated glutathione-Sepharose column. Fractions containing the SH3 domain were incubated with His-select resin (Sigma) to remove TEV protease. The resin was poured into a column and the flowthrough was collected, dialyzed against 20 mM Tris–HCl pH 8, 10 mM BME, 2 mM EDTA and concentrated to 14 mg ml−1. All purification steps were carried out at 277 K. Incorporation of SeMet was verified by mass spectrometry (data not shown).
2.2. Crystallization and structure solution
Crystals were grown at 277 K by hanging-drop vapor diffusion in 24-well Q-plates (Hampton Research, Aliso Viejo, California, USA). 1 µl protein solution (14 mg ml−1 in 20 mM Tris–HCl pH 8, 10 mM BME, 2 mM EDTA) was mixed with 1 µl reservoir buffer (1.9 M magnesium sulfate, 0.1 M MES pH 6.5) and suspended over 1 ml reservoir solution. Crystals were harvested in nylon loops for data collection, briefly (2–5 s) dragged through a solution containing three volumes of glycerol and seven volumes of reservoir buffer and plunged into liquid nitrogen. A crystal of approximate dimensions 100 × 150 × 150 µm was used for the structure determination; the crystal was maintained at approximately 100 K during data collection. Data were collected at three wavelengths near the selenium edge on NSLS beamline X8C and were processed using d*TREK (Pflugrath, 1999 ▶; Table 1 ▶).
Table 1. Data-collection statistics.
Values in parentheses are for the highest resolution shell.
| Data set | Remote | Peak | Inflection |
|---|---|---|---|
| Space group | P43212 | ||
| Unit-cell parameters (Å) | a = b = 64.97, c = 41.27 | ||
| Wavelength (Å) | 0.9000 | 0.9795 | 0.9798 |
| Resolution (Å) | 30–1.68 (1.78–1.68) | 30–1.73 (1.82–1.73) | 30–1.73 (1.82–1.73) |
| No. of unique reflections | 9873 (1550) | 8754 (1050) | 8697 (1038) |
| Rmerge† | 0.077 (0.602) | 0.065 (0.515) | 0.068 (0.425) |
| Rp.i.m.‡ | 0.022 (0.300) | 0.020 (0.293) | 0.028 (0.395) |
| Rr.i.m.‡ | 0.090 (0.589) | 0.070 (0.646) | 0.076 (0.455) |
| I/σ(I) | 11.0 (1.5) | 16.0 (1.8) | 11.5 (1.6) |
| Completeness (%) | 92.6 (90.1) | 90.5 (78.4) | 89.9 (77.5) |
| Redundancy | 11.2 (5.9) | 10.3 (4.2) | 5.2 (2.1) |
R
merge = 
 , where
  represents the sum over all reflections,
  represents the sum over all symmetry-related and equivalent reflections and 〈I(hkl)〉 denotes the mean value of I(hkl).
R p.i.m. and R r.i.m. are as defined in Weiss (2001 ▶).
The protein construct used contains three selenomethionines, two of which are found at the N-terminus and were predicted to be unstructured. Consistent with this, a single anomalous scatterer was located using SnB (Smith et al., 1998 ▶). Phases were determined using MLPHARE (Collaborative Computational Project, Number 4, 1994 ▶) and were improved by solvent flattening with DM (Cowtan, 1999 ▶). The resulting electron-density map was of excellent quality and residues 305–367 were automatically fitted to density by ARP/wARP (Morris et al., 2003 ▶). Refinement was carried out against the remote-wavelength data set using REFMAC5 (Murshudov et al., 1997 ▶); TLS refinement was incorporated in the final stages. A test set comprising 5% of the reflections was used for R free calculations. Refinement statistics are given in Table 2 ▶.
Table 2. Refinement statistics.
Values in parentheses are for the highest resolution shell.
| Resolution | 25–1.7 (1.74–1.70) |
| No. of reflections (work + test) | 8986 |
| R | 0.196 (0.30) |
| Rfree | 0.217 (0.29) |
| No. of residues | 64 |
| No. of water molecules | 81 |
| Total no. of atoms | 606 |
| R.m.s.d. bond lengths (Å) | 0.012 |
| R.m.s.d. bond angles (°) | 1.40 |
| Mean B (Å2) | 41.3 |
| Ramachandran statistics†, residues in (%) | |
| Core region | 96.1 |
| Additionally allowed region | 3.9 |
| Generously allowed region | 0.0 |
| Disallowed region | 0.0 |
Calculated using the program PROCHECK (Laskowski et al., 1993 ▶).
3. Results and discussion
3.1. Description of the structure
The asymmetric unit contains one copy of residues 305–368 of rat endophilin A2 and 81 water molecules; no density is seen for the nine residues at the N-terminus of our construct. While some surface-exposed side chains are not well localized, clear main-chain electron density is seen for residues 305–368. The calculated Matthews coefficient V M is 2.64 Å3 Da−1, corresponding to a solvent content of 53.4% (Kantardjieff & Rupp, 2003 ▶).
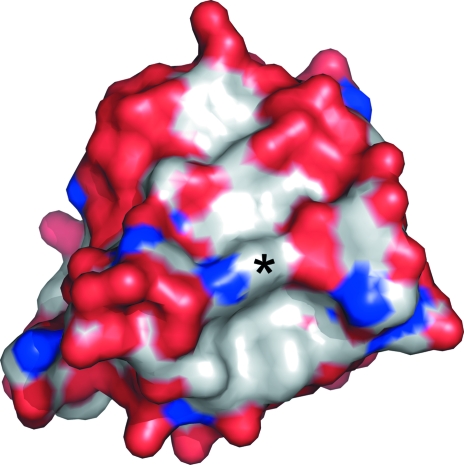
As expected, the protein adopts the canonical SH3-domain fold, with the core of the molecule being formed by five extended strands that assemble into a β-barrel (Fig. 1 ▶). The base of the barrel is closed by an extended hairpin loop formed by residues 315–329 that connects strands 1 and 2 (known as the ‘RT loop’ in SH3 parlance). In most SH3-domain proteins, ligand binding maps to a shallow hydrophobic groove on the protein surface. In the endophilin A2 SH3 domain, one side of this groove is formed by the RT loop; the opposite side is formed by the so-called Src loop, which lies between strands 3 and 4, and by approximately one turn of helix formed by residues 356–359. The floor of this groove is composed largely of aromatic residues, including the molecule’s sole tryptophan, Trp343 (Fig. 2 ▶).
Figure 1.
Stereoview of a ribbon trace showing the rat endophilin A2 SH3 domain structure. The color scheme runs from blue at the N-terminus (residue 305 in the endophilin sequence) to red at the C-terminus (residue 368) of the domain. In this view, the RT loop can be seen at the far right side of the molecule (cyan) and the Src loop extends from the plane of the page directly toward the viewer (yellow–green). The ligand-binding groove lies between these two loops. All figures were produced using PyMOL (DeLano, 2002 ▶).
Figure 2.
Surface representation of the endophilin SH3 domain. The surface is color-coded by element, with red representing oxygen, blue nitrogen and gray carbon. The ligand-binding groove runs approximately vertically in this view. The base of the groove can be seen as the gray (hydrophobic) stripe flanked by red ‘walls’ on either side. The side chain of Trp343 (indicated by an asterisk) forms a ridge across the base of the groove. Rotating the molecule shown in this figure by approximately 35° about a vertical axis will result in a view similar to that shown in Fig. 1 ▶.
3.2. Comparison with related SH3-domain structures
The two mammalian proteins with sequences most closely related to the endophilin A2 SH3 domain are endophilins A1 and A3, which show 80% and 76% sequence identity to endophilin A2, respectively. NMR structures are available for both of these relatives (endophilin A1, PDB code 2dbm; endophilin A3, PDB code 2ew3; Gao et al., 2006 ▶) and both proteins adopt structures that are highly similar to that reported here. Superposition of our structure with the best representative conformers of the NMR structures yields r.m.s. deviations in Cα positions of 1.3 Å for both the A1–A2 and A2–A3 pairs. Virtually all of the residues lining the predicting ligand-binding surfaces are identical in the three proteins, suggesting that there is likely to be substantial overlap in the protein partners that they are capable of recognizing.
3.3. Crystal packing
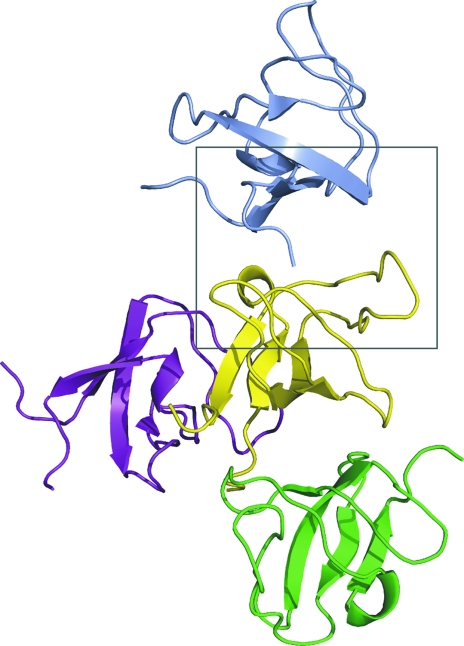
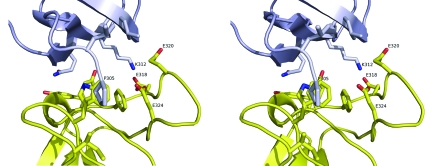
Each molecule in the crystal lattice packs against three neighboring molecules (Fig. 3 ▶). Two of the three interactions involve the N-terminus of one molecule binding to residues in the ligand-binding groove of a second molecule. In this interaction, Pro305, the first residue seen in the electron-density map, packs against Trp343 in an adjoining molecule in a manner reminiscent of how the proline side chains of some SH3 ligands pack into the binding groove (Fig. 4 ▶). The subsequent residues in the N-terminal portion of the chain do not mimic peptide ligand binding or interact with the binding site of the neighboring molecule. However, Lys312 does interact with a cluster of acidic residues on the RT loop that is likely to be involved in recognizing basic side chains on peptide ligands. This acidic region may also play a role in metal binding, as has been observed for the corresponding region of the Lck kinase SH3 domain (Romir et al., 2007 ▶).
Figure 3.
Lattice contacts in crystals of the rat endophilin SH3 domain. Each molecule interacts with three neighbors. The central (yellow) molecule is shown with its three interaction partners. The ligand-binding groove of the yellow molecule interacts with proline and lysine residues from the N-terminus of the gray molecule; the N-terminus of the yellow molecule interacts with the ligand-binding groove of the green molecule in an identical fashion. The details of this interaction can be seen in Fig. 4 ▶, which shows a close-up view of the region enclosed in the gray box.
Figure 4.
Stereoview of the crystal-packing interaction involving the ligand-binding site. This figure corresponds to an expanded view of the region highlighted in the gray box in Fig. 3 ▶. Residue Pro305 at the N-terminus of the gray molecule (foreground) packs against Trp343 in the ligand-binding groove of the yellow molecule and Lys312 of the gray molecule inserts into an acidic pocket formed by three glutamate residues on the yellow molecule.
Supplementary Material
PDB reference: SH3 domain of rat endophilin A2, 3c0c, r3c0csf
Acknowledgments
The authors are grateful to Kimberly Grasty for excellent technical assistance. Financial support was provided by NIH grant R01-MH 73060 (JFZ). Data for this study were measured at beamline X8C of the National Synchrotron Light Source. Financial support for this resource comes principally from the Offices of Biological and Environmental Research and of Basic Energy Sciences of the US Department of Energy and from the National Center for Research Resources of the National Institutes of Health.
References
- Chen, Y., Deng, L., Maeno-Hikichi, Y., Lai, M., Chang, S., Chen, G. & Zhang, J.-F. (2003). Cell, 115, 37–48. [DOI] [PubMed]
- Collaborative Computational Project, Number 4 (1994). Acta Cryst. D50, 760–763.
- Cowtan, K. (1999). Acta Cryst. D55, 1555–1567. [DOI] [PubMed]
- DeLano, W. L. (2002). The PyMOL Molecular Graphics System. http://www.pymol.org.
- Gao, Y. G., Yan, X. Z., Song, A. X., Chang, Y. G., Gao, X. C., Jiang, N., Zhang, Q. & Hu, H. Y. (2006). Structure, 14, 1755–1765. [DOI] [PubMed]
- Kantardjieff, K. A. & Rupp, B. (2003). Protein Sci.12, 1865–1871. [DOI] [PMC free article] [PubMed]
- Laskowski, R. A., MacArthur, M. W., Moss, D. S. & Thornton, J. M. (1993). J. Appl. Cryst.26, 283–291.
- Mayer, B. J. (2001). J. Cell Sci.114, 1253–1263. [DOI] [PubMed]
- Morris, R. J., Perrakis, A. & Lamzin, V. S. (2003). Methods Enzymol.374, 229–244. [DOI] [PubMed]
- Murshudov, G. N., Vagin, A. A. & Dodson, E. J. (1997). Acta Cryst. D53, 240–255. [DOI] [PubMed]
- Musacchio, A. (2002). Adv. Protein Chem.61, 211–268. [DOI] [PubMed]
- Pflugrath, J. W. (1999). Acta Cryst. D55, 1718–1725. [DOI] [PubMed]
- Ringstad, N., Nemoto, Y. & De Camilli, P. (1997). Proc. Natl Acad. Sci. USA, 94, 8569–8574. [DOI] [PMC free article] [PubMed]
- Romir, J., Lilie, H., Egerer-Sieber, C., Bauer, F., Sticht, H. & Muller, Y. A. (2007). J. Mol. Biol.365, 1417–1428. [DOI] [PubMed]
- Sheffield, P., Garrard, S. & Derewenda, Z. (1999). Protein Expr. Purif.15, 34–39. [DOI] [PubMed]
- Slepnev, V. I. & De Camilli, P. (2000). Nature Rev. Neurosci.1, 161–172. [DOI] [PubMed]
- Smith, G. D., Nagar, B., Rini, J. M., Hauptman, H. A. & Blessing, R. H. (1998). Acta Cryst. D54, 799–804. [DOI] [PubMed]
- Van Duyne, G. D., Standaert, R. F., Karplus, P. A., Schreiber, S. L. & Clardy, J. (1993). J. Mol. Biol.229, 105–124. [DOI] [PubMed]
- Verstreken, P., Koh, T. W., Schulze, K. L., Zhai, R. G., Hiesinger, P. R., Zhou, Y., Mehta, S. Q., Cao, Y., Roos, J. & Bellen, H. J. (2003). Neuron, 40, 733–748. [DOI] [PubMed]
- Weiss, M. S. (2001). J. Appl. Cryst.34, 130–135.
Associated Data
This section collects any data citations, data availability statements, or supplementary materials included in this article.
Supplementary Materials
PDB reference: SH3 domain of rat endophilin A2, 3c0c, r3c0csf


