

Abstract
The accurate identification of promoter regions and transcription start sites is a challenge to the construction of human transcription regulation networks. Thus, an efficient prediction method based on theoretical formulation is necessary for this purpose. We used the method of increment diversity with quadratic discriminant analysis (IDQD) to predict transcription start sites (TSS). The method produced sensitivity and positive predictive value of more than 65% with positives to negatives ratio of 1:58. The performance evaluation using Receiver Operator Characteristics (ROC) showed an auROC (area under ROC) of greater than 96%. The evaluation by Precision Recall Curves (PRC) showed an auPRC (area under PRC) of about 26% for positives to negatives ratio of 1:679 and about 64% for positives to negatives ratio of 1:113. The results documented in this approach are either better or comparable to other known methods.
Keywords: promoter, transcription start site, increment of diversity, quadratic discriminant analysis
Background
The accurate prediction of promoter sequence and transcription start site (TSS) is important in the construction of human transcription-regulation networks. Transcription initiation is a difficult problem which is dependent of DNA sequence and chromatin remodeling [1]. Lack of complete understanding on the distribution of chromatin remodeling in relation to known DNA sequences is a challenge in promoter and TSS prediction [2]. There are number of promoter prediction tools known till date [3–5]. Bajic and colleagues reviewed eight promoter prediction programs and reported that all of them showed a positive predictive value of less than 65% [7]. Thus, recognition of transcription starts site is a difficult task and not much progress has been made in its predictions.
Sonnenburg and colleagues used support vector machine with advanced sequence kernels for the accurate recognition of transcription start sites in human sequences with high prediction accuracy [8]. They evaluated four leading TSS prediction tools using performance evaluation parameters, area under the Receiver Operator Characteristics (ROC) and area under the Precision Recall Curves (PRC). The area under ROC was 90% at a chunk size resolution of 50 or 500 bases. However, the area under PRC was not significantly high in the analysis. This is attributed to variability of regulation element and complexity of regulation network in eukaryotic genomes. Regulation elements are short and are both easily erased and generated in evolution. The on and off of these elements during short evolutionary time can result in diversity of regulation elements and in their genomic arrangements.
The discovery of a large amount of alternative promoters in the human genome and our current knowledge on differentially regulated alternative TSSs in different tissues and families of genes increases the complexity of TSS recognition and prediction [2,9]. Therefore, it is important to develop an efficient tool utilizing comprehensive sequence information for recognizing a variety of TSSs in a simple and unified formalism with high sensitivity and positive predictive value. We used increment diversity with quadratic discriminant analysis (IDQD) as a prediction method for splice junction identification. The method predicted exon/intron boundaries successfully for model genomes [10]. Here, we describe IDQD as a method to predict TSS with good accuracy.
Methodology
Dataset
We used the database dbTSS version 4.0 [11] to create a dataset of 4254 genes to generate TSS data for training. This set is similar to the genes studied elsewhere [8]. We extracted a window of size 2000 (labeled by -1000, …, -1, +1, …, +1000) around the TSS (at site +1) for each gene. This set constituted the training positive set. We drew 10 negatives of 2000 bp at random from locations between 100bp downstream of the TSS and the end of the gene for each gene as described elsewhere [7]. This set constituted the training positive set. We created a test set as described elsewhere [8] and used the set of genes 1024 that are new in dbTSS version 5.2 [2]. We then extracted sequences of size 2000 containing TSS for each gene. They consist of the test set (positives). We then identified classical TSSs as described by Bajic and colleagues [7]. The negatives are drawn from 100bp downstream of the TSS to the end of the gene in a shifted window of 2000 bp with step 50, 500, or 1000 bp. They consist of the negative test set. The ratio of the size of negative set to positive is 679 (for step 50) 113 (for step 500) and 58 (for step 1000), respectively. The negatives/positives ratios are comparable with those used in chunk method described elsewhere [8]. The performance evaluation of any prediction method is strongly dependent on the ratio of the size of negatives to positives. To make a fair comparison of our method with other programs we changed the step of shifted window to obtain different sizes of negative set and therefore the different ratios of negatives to positives.
IDQD algorithm
The characters of a sample, a sequence or a group of sequences, are described by a set of numbers is the assumption in the model. The i-th character is expressed by number ni. ni describes the number of certain base in a given site of a sequence or a group of sequences. We call ni the character number or informational parameter of the sample (i=1,…,s). Consider the sequence X to be classified and define the diversity of sequence X as given in equation 1 (see supplementary material).
To give a classification of sequence X we should compare it with some standard samples (called standard diversity source S). Let the i-th character in standard source expressed by number mi (i=1,…,s) where mi is the sum of the i-th character number over all standard samples. The same definition is applied to diversity of standard source S. Likewise, the total diversity of the system X+S, D(X+S), can be defined in the same manner. The increment of diversity is defined by equation 2 in supplementary material. ID gives the relation of sequence X with standard source S. The smallest ID has the most intimate relation of X to S.
When there are r set of sequence characters, we have r feature variables ID1 to IDr and we need to integrate them by quadratic discriminant analysis. Given a problem (or a test) of classification, we average the increment of diversity (IDj, j=1, …, r) over positive group or negative group in training set (denoted by μ1 or μ2 respectively) and thus deduce the corresponding covariance (denoted by r×r matrix ∑1 or ∑2 respectively). The increment of diversity is denoted by R for sequences to be classified. The discriminant function that differentiates with X belonging to positive group or negative group is given in equation 3 (see supplementary material). The sample X is classified into positive group as ξ > ξ0 or negative group as ξ ≤ ξ0. In quadratic discriminant analysis, the threshold ξ0 is taken as 0. However, due to the limited size of positive and negative group and the large difference between them, the optimal threshold ξ0 is not 0 and it should be empirically determined. The ROC and PRC curves through varying the parameter ξ0 are plotted for single-number performance evaluation. We initially calculated 28 ID parameters (for definitions see supplementary material) from promoter sequences.
Discussion
We used two groups of performance measures to assess the accuracy on TSS prediction. The first group includes sensitivity (Sn), specificity (Sp), false positive rate (FPR), positive predictive value (PPV) and correlation coefficient (CC). Please see supplementary material for definitions for these performance parameters. The second group named “single-number” performance measure include auROC (area under the curve receiver operator characteristics) and auPRC (area under the curve precision recall curves).
The results of TSS prediction are summarized in Table 1 and Table 2 (see supplementary material for Tables). Table 1 (see supplementary material) shows the results depending on threshold ξ0. The sensitivity decreases with increasing ξ0 while positive predictive value and correlation coefficient increase with ξ0. In test set of window step 1000bp, both sensitivity and PPV can achieve a higher value, higher than 65% under threshold ξ0=3, which seems better than eight promoter prediction programs analyzed elsewhere [7]. We notice here that the distance between two negatives equal 1000 bp (the false positive rate 0.007 per 1000 bases) and the ratio of the number of positives to negatives is 1:58. This is lower than or comparable with the corresponding value in eight programs analyzed elsewhere [7]. In [7] a window of [-2000, +2000] was set relative to the TSS location. If we assume the distance between two negatives is 2000bp or more, the IDQD program will give higher prediction accuracy.
A detailed comparison of IDQD with other programs is made using auROC and auPRC. In IDQD we obtained auROC >96% and auPRC of about 26% for window step 50, auPRC of about 64% for step 500 and auPRC of about 76 for step 1000. We find these results are comparable with the performance of ARTS [8] and higher than other methods with the same positive to negative ratio (see Table 2 in supplementary material). The ROC and PRC curves for test set (corresponding to Table 2 under supplementary material) of window steps 500 are plotted in Figure 1.
Figure 1.
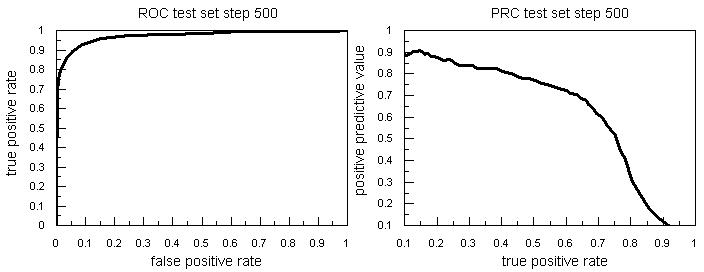
The ROC and PRC curves for test set of step 500.
The above prediction on typical TSSs of 1024 genes shows the effectiveness of IDQD algorithm. Results on TSS prediction were improved using algorithm with the same ID parameters for whole genome searching on classical TSSs (collected in database dbTSS2006) in chromosomes 4, 21 and 22. With window size 2000 bp and step 1000 bp,we obtained an auROC of 97% and auPRC of 65%. Both Sn and PPV exceeding 65% for optimal ξ0 = 10.
IDQD algorithm and the choice of ID parameters
In a classification problem when the feature of the sample are denoted by a frequency distribution and compared with a standard source, the system can be described by diversity measure and classification is achieved by ID method. The program contains the calculation of a given character projected onto high dimensional space. When the size of standard sample set is large, making influences of fluctuation negligible, the diversity of standard samples includes accurate information about the frequency distribution of the character.
Thus, we use ID to evaluate the detailed difference between any sample and the standard set to find the optimal hyperplane for the classification of samples in multi-dimensional space. The estimation error is reduced in this approach since the difference among all real samples has been carefully considered in training set. Moreover, one can always define several different diversity functions as feature variables to describe sequence characteristics. The method is feasible enough for solving classification problem. Although the definition of diversity measure is similar to Shannon information in some respects, the ID method is far more different from mutual information and like information theoretical approaches in its application.
The efficient extraction of sequence information by use of diversity measure in high-dimensional space and the synthesis of different types of sequence information into one discriminant function are two important factors for the success of IDQD algorithm. The different IDs are integrated into one nonlinear discriminant function ξ through quadratic discriminant analysis. The only adjustable parameter that existed in IDQD algorithm is the threshold of ξ, namely ξ0. Thus, the algorithm is easy to evaluate. The parameters are empirically determined in principle to obtain optimal evaluation. However, in ROC and PRC analysis the threshold ξ0 is terated as a variable to plot curves for performance evaluation.
In IDQD, the ID selection is an important step. It is known that hexamer score and pentamer score were used as discriminant functions in promoter recognition [12,13]. Many regulatory motifs in human promoters are composed of 6- to 8-nucleotide fragments [14]. The sequence information on base frequency and base correlation in TATA region and initiator region is also represented by hexamer distribution. The TSS signals exist mainly in a sequence of 2000 bp. In the present study, we use 6-mer frequencies in four 500 bp segments as the most important information (namely, diversities X1 to X4, see supplementary material) for the reorganization of promoter and TSS. A segment length of 500bp has been taken under consideration of the variation of 6-mer frequency in different regions of promoters. To emphasize the local information on base frequency and DNA structure in the vicinity of initiator, we introduced diversities on 5-mer and 4- mer frequencies in several consecutive 25 bp sequences. After comparing with other segment lengths we found that 25bp is a better choice for describing the local peculiarities of promoter sequences. However, both diversities on 5-mer and 4-mer frequencies (X5 to X9 and X10 to X12, see supplementary material) are important for TSS recognition.
The use of a single diversity will lower prediction efficiency. The pentamer information is essentially related to initiator sequence while the tetramer information is responsible for the local deviation of DNA helix structure and di-nucleotide stacking energy [15]. Besides, G+C content (X13, see supplementary material) and CpG DIMER content (X14, see supplementary material) in 2000bp long sequence are also useful, since the base frequency distribution in promoters is different from non-promoters and the CpG content is important for recognizing a specific class of promoters.
Thus, we used 14 diversities in our analysis. Each of the diversity is introduced with two increments of diversity (ID). One increment is relative to the diversity of positive set of standard source and another is relative to the negative set of standard source. We then calculated the prediction accuracy using double increments and this is higher than single increment. Hence, the ID selection is guided by the performance evaluation (sensitivity, specificity, accuracy, PPV, auROC and auPRC). However, if two ID selections lead to the same performance measure we use the one with lower dimension. It should be noted that the dimension of the discriminant vector is the sum of dimensions of each diversity component and the dimension of the discriminant vector R = (I1, I2,…,I28) presented in this analysis is of order (4096×24)+420.
Supplementary material
Acknowledgments
The work was partly supported by National Science Foundation of China, No. 90403010 and Scientific Research Projects of Inner Mongolia's Universities, No. NJZY07065.
References
- 1.The ENCODE Project Consortium Nature. 2007;477:799. doi: 10.1038/nature05874. [DOI] [PMC free article] [PubMed] [Google Scholar]
- 2.Yamashita R, et al. Nucleic Acids Res. 2006;34:D86. doi: 10.1093/nar/gkj129. [DOI] [PMC free article] [PubMed] [Google Scholar]
- 3.Knudsen S, et al. Bioinformatics. 1999;15:356. doi: 10.1093/bioinformatics/15.5.356. [DOI] [PubMed] [Google Scholar]
- 4.Davuluri RV, et al. Nature Genet. 2001;29:412. doi: 10.1038/ng780. [DOI] [PubMed] [Google Scholar]
- 5.Bajic VB, et al. Bioinformatics. 2002;18:198. doi: 10.1093/bioinformatics/18.1.198. [DOI] [PubMed] [Google Scholar]
- 6.Down TA, et al. Genome Res. 2002;12:458. doi: 10.1101/gr.216102. [DOI] [PMC free article] [PubMed] [Google Scholar]
- 7.Bajic VB, et al. Nat Biotechnol. 2004;22:1467. doi: 10.1038/nbt1032. [DOI] [PubMed] [Google Scholar]
- 8.Sonnenburg S, et al. Bioinformatics. 2006;22:e472. doi: 10.1093/bioinformatics/btl250. [DOI] [PubMed] [Google Scholar]
- 9.Trinklein ND, et al. Genome Res. 2007;17:720. doi: 10.1101/gr.5716607. [DOI] [PMC free article] [PubMed] [Google Scholar]
- 10.Zhang LR, Luo LF. Nucleic Acids Res. 2003;31:6214. doi: 10.1093/nar/gkg805. [DOI] [PMC free article] [PubMed] [Google Scholar]
- 11.Suzuki Y, et al. Nucleic Acids Res. 2002;30:328. doi: 10.1093/nar/30.1.328. [DOI] [PMC free article] [PubMed] [Google Scholar]
- 12.Davuluri RV, et al. Nature Genetics. 2001;29:412. doi: 10.1038/ng780. [DOI] [PubMed] [Google Scholar]
- 13.Jacques PÉ, et al. BMC Bioinformatics. 2006;7:423. doi: 10.1186/1471-2105-7-423. [DOI] [PMC free article] [PubMed] [Google Scholar]
- 14.Xie XH, et al. Nature. 2005;434:338. doi: 10.1038/nature03441. [DOI] [PMC free article] [PubMed] [Google Scholar]
- 15.Tsai L, et al. J Biomol Struc and Dynamics. 2002;20:127. doi: 10.1080/07391102.2002.10506828. [DOI] [PubMed] [Google Scholar]
Associated Data
This section collects any data citations, data availability statements, or supplementary materials included in this article.