

Abstract
Increased reactive oxygen species (ROS) such as superoxide have been implicated as causal elements of oncogenesis. A variety of cancers have displayed changes in steady state levels of key antioxidant enzymes with the mitochondrial form of superoxide dismutase (MnSOD) being commonly implicated. Increasing MnSOD expression suppresses the malignant phenotype in various cancer cell lines and suppresses tumor formation in xenograft and transgenic mouse models. We examined the impact of MnSOD expression in the development of T cell lymphoma in mice expressing pro-apoptotic Bax. Lck-Bax38/1 transgenic mice were crossed to mice overexpressing MnSOD (Lck-MnSOD) as well as MnSOD +/− mice. The effect of MnSOD on apoptosis, cell cycle, chromosomal instability (CIN), and lymphoma development was determined. The apoptotic and cell cycle phenotypes observed in thymocytes from control and Bax transgenic mice were unaffected by variations in MnSOD levels. Remarkably, increased gene dosage of MnSOD significantly decreased aneuploidy in pre-malignant thymocytes as well as the onset of tumor formation in Lck-Bax38/1 mice. The observed effects of MnSOD support a role for ROS in CIN and tumor formation in this mouse model of T cell lymphoma.
Keywords: MnSOD, ROS, Apoptosis, Bcl-2, Oncogenesis, Chromosomal Instability
Introduction
Apoptosis is a tightly controlled process that regulates tissue homeostasis, normal development, and the removal of damaged cells. The Bcl-2 family can be broadly divided into those members that inhibit (Bcl-2) or promote cell death (Bax). Bcl-2 family members primarily function at the mitochondria where they control the permeability of the outer mitochondrial membrane and result in cytochrome C release and caspase activation. Many cancers have demonstrated defects in apoptotic pathways. In many of these cases, increased expression of anti-apoptotic Bcl-2 family members like Bcl-2 in human follicular B cell lymphoma have been documented [1]. Mutational inactivation of pro-apoptotic factors like Bax has been observed in colon cancer [2] and in some hematopoietic malignancies [3]. However, other studies suggest a paradoxical relationship between oncogenesis and the Bcl-2 family. Bcl-2 expression delays tumor formation in animal models [4, 5] and high expression of Bcl-2 is a favorable, independent prognostic factor in breast cancer [6]. Other studies link high expression of pro-apoptotic Bax to accelerated cancer formation and to unfavorable prognosis [4, 7].
Several studies have suggested the paradoxical effects of Bcl-2 family members on oncogenesis may involve maintenance of genome stability. For example, in a murine model of c-myc-induced B cell lymphoma, Bcl-2 expression abrogated the selective pressure(s) needed to lose p53 and prevented the formation of aneuploid cells [8]. Similar observations with regard to Bcl-2 were also observed in other models [9]. In contrast, increased Bax (Lck-Bax38/1) was associated with accelerated tumor formation in both p53 +/+ and p53 −/− mice [4, 10]. In the Lck-Bax38/1 model, CIN preceded tumor formation and occurred independent of p53 status.
In addition to their effects on cell death, a number of reports have demonstrated a link between the Bcl-2 family and ROS. This link first emerged when it was observed that Bcl-2 expression protected cells from hydrogen peroxide (H2O2)- and menadione-induced apoptosis [11]. Moreover, Bcl-2 deficient mice displayed pathologies associated with increased oxidative stress such as follicular hypopigmentation and severe polycystic kidney disease [12]. Other studies link pro-apoptotic Bax to increased oxidative stress. In one study, Bax expression increased mitochondrial lipid oxidation and this event was necessary for Bax-induced cell death [13]. In studies of sympathetic neurons, Bax expression was required for ROS generation after nerve growth factor (NGF) withdrawal and the ROS production was upstream of the cell death commitment point [14].
Numerous studies implicate ROS in the development of cancer but the source of, and a mechanism linking ROS to cancer remains poorly understood. Failure to remove excess free radicals can lead to protein and lipid oxidation as well as DNA damage. Increased free radical formation can be generated from metabolizing chemical carcinogens from exogenous sources acquired from dietary intake and/or exposure to environmental carcinogens such as cigarette smoke and radiation. Free radicals are also generated from endogenous sources such as mitochondria during aerobic respiration. To remove excess free radicals, the cell has evolved a complex antioxidant system consisting of low molecular weight scavengers such as glutathione as well as a system of antioxidant enzymes including the superoxide dismustases and peroxidases. In human and mouse malignancies, variations in steady state levels of antioxidants and oxidative damage to tissues have been documented. A number of studies have demonstrated mice deficient in key antioxidant enzymes are prone to tumor development. For example, mice deficient in CuZnSOD succumb to hepatocarcinogenesis [15]; MnSOD +/− mice are prone to spontaneous lymphoma development [16]; and peroxiredoxin 1 −/− mice succumb to a variety of malignancies [17].
While the mechanism(s) linking ROS to cancer remains under investigation, several studies link increased oxidative stress to CIN. CIN includes gains or losses of whole chromosomes (aneuploidy), translocations, gene amplifications and deletions, and chromosomal breakage. CIN has been proposed to be an enabling characteristic of tumor cells as it reflects the proclivity of the genome to acquire further mutations requisite for oncogenesis [18]. One study demonstrated that Chinese hamster lung fibroblasts expressing a mutant form of the mitochondrial protein succinate dehydrogenase had increased superoxide levels and became aneuploid [19]. Similarly, fibroblasts from MnSOD −/− mice had increased superoxide levels but also displayed CIN in the form of chromosomal breakage and translocations [20]. Finally, culturing cells in hydrogen peroxide results in altered ploidy and catalase gene amplification [21].
Reduced levels of antioxidant enzymes, in particular MnSOD, have been reported in cancer cells [22]. MnSOD is a nuclear encoded mitochondrial protein that is responsible for converting superoxide radical (O2•−) into hydrogen peroxide (H2O2) within the mitochondrial matrix. Multiple studies have shown that increasing MnSOD expression in cancer cells has anti-tumor effects. Cell growth, plating efficiency, cell growth in soft agar assays, and tumor formation in nude mice were all reduced when MnSOD was expressed in melanoma, pancreatic, and prostate cancer cell lines [23–25]. Moreover, transgenic overexpression of MnSOD suppressed chemical-induced tumor formation in a mouse model of skin tumorigenesis [26].
Studies linking both the Bcl-2 family and ROS production to CIN prompted us to investigate the tumor suppressive role of MnSOD in the development of T cell lymphoma in Lck-Bax38/1 transgenic mice. Transgenic mice with T cell-restricted overexpression of MnSOD (Lck-MnSOD) and MnSOD +/− mice were crossed to Lck-Bax38/1 transgenic mice. The effect of MnSOD expression levels on apoptosis, cell cycle, CIN, and tumor development in Bax transgenic mice were determined. Our results demonstrate MnSOD levels influence the oncogenic phenotype observed in Bax transgenic mice by attenuating pre-malignant aneuploidy and the onset of lymphomagenesis.
Materials and Methods
Mice
Lck-Bax transgenic mice were previously described and are genotyped by polymerase chain reaction (PCR) as previously described [10]. The Lck-MnSOD construct was generated by blunt-end ligation of the full-length cDNA sequence of human MnSOD into the BamHI site of the Lck-hGH vector [27]. Three independent lines (Lines A, B, and C) were generated with two showing higher expression over endogenous mouse MnSOD levels. The line with the highest level of expression (Line A) was crossed to Lck-Bax38/1 transgenic mice. Lck-MnSOD transgenic mice were genotyped by PCR using a forward MnSOD cDNA primer (5’-CAGATCATGCAGCTGCACCACAG-3’) and a reverse human growth hormone primer (5’-GTAGCCATTGCCGCTAGGTGAG-3’). A small genomic region of Bcl-XL was amplified for an internal control using the forward primer (5’-GATACAGCTGGAGTCAGTTTA-3’) and reverse primer (5’-GGCCACGATGCGACCCCAGTT-3’). The primers produced a 600 bp fragment (MnSOD) and a 375 bp fragment (Bcl-XL) after 35 cycles (94°C X 1 min; 55°C X 1 min; and 72°C X 1.2 min). MnSOD heterozygous mice were from the Jackson Laboratory and crossed to Lck-Bax38/1 transgenic mice. MnSOD heterozygous mice were genotyped by PCR using a forward MnSOD primer (5’-GTTGTGTCCTTTTTTGTCACC-3’) and a reverse MnSOD primer (5’-TTCCTGTCTTTTCCTCCCC-3’). To amplify the PGK-HPRT insert in the knockout allele, the following primers were used: forward (5’-TGTTCTCCTCTTCCTCATCTCC-3’) and reverse (5’-ACCCTTTCCAAATCCTCAGC-3’). The primers produced a 505 bp fragment (wild-type allele) and a 250 bp fragment (knockout allele) after 37 cycles (94°C X 1min; 56°C X 1 min; and 72°C X 2 min). Mice were maintained on a C57BL/6 background.
Tumor development studies
All mice were maintained in the University of Iowa animal facility under a protocol approved by the Institutional Animal Care and Use Committee (IACUC). Mice of the appropriate genotypes were mated to obtain sufficient cohorts of animals needed for the tumor development studies. Once entered into the tumor development study, mice were examined weekly for signs of illness or malignancy. Ill animals were monitored more frequently and euthanized when necessary to prevent unneeded suffering. All animals were monitored for up to 60 weeks and then sacrificed for necropsy. As a group, the MnSOD +/− and Lck-MnSOD control animals did not develop tumors at a significant rate and were similar to the MnSOD +/+ controls. When possible, necropsies were performed on dead animals to determine the cause of death. In the case of the Lck-Bax38/1 mice, nearly all the animals died from thymic lymphomas which in most cases were confirmed by histological examination following H&E staining.
MnSOD activity assay
Manganese superoxide dismutase (MnSOD) activity was determined using the nitro blue tetrazolium assay (NBT) method [28]. Briefly, this is a competitive inhibition assay where superoxide dismutase competes with NBT for superoxide generated via the xanthine-xanthine oxidase reaction. The rate of inhibition of NBT reduction to blue formazan (detected at 560 nM) was calculated to determine the SOD activity. Sodium cyanide (5 mM) is included to inhibit copper-zinc superoxide dismutase activity (CuZnSOD) for the specific measurement of MnSOD activity. One unit of activity is defined as that amount of protein that yields 50% of maximal inhibition of NBT reduction by superoxide under the specified reaction conditions.
Cell cycle analysis
Cell cycle analysis was performed on propidium iodide-stained nuclei on a flow cytometer equipped for doublet discrimination (FACSCalibur from Becton Dickson) as previously described [4]. The percentage of proliferating thymocytes (%S/G2/M) was determined by examining histograms after gating out doublet events on the basis of FL-2A versus FL-2W. Cellquest software (Becton Dickson) was used for acquisition and either Cellquest or Flojo software was used for analysis.
Dihydroethidium (DHE) staining
DHE staining was performed on freshly isolated thymocytes from 6–10 week old control and Lck-Bax38/1 transgenic mice. Briefly, thymi from individual mice were excised and minced into a single cell suspension. The erythrocytes were removed by a five-minute incubation at room temperature in lysis buffer (10 mM Tris, 0.83% NH4Cl, pH 7.2). The cells were then pelleted and resuspended in pre-warmed PBS (37° C) supplemented with 5 mM pyruvate (Invitrogen) at a concentration of 1 X 10⁶ cells/tube. The cells were then stained in the dark with 10 μM DHE (Invitrogen, Cat D-11347) at 37° C for 40 minutes with intermittent shaking. Afterwards, the cells were washed in PBS to remove excess DHE and stained with a FITC-conjugated anti-Thy1.2 antibody at 4° C (eBioscience Cat 11-0902-82) to label T cells. DHE fluorescence in T cells was determined by gating on Thy1.2 positive cells using a flow cytometer (FACSCalibur from Becton Dickson).
Cytogenetic analysis
Cytogenetic analysis was performed on freshly isolated thymocytes. Briefly, 100 μg of Colchicine (Sigma Cat#: C-9754) in PBS was injected intraperitoneally into each mouse to enrich for mitotic cells. Approximately 40 minutes later, the mouse was sacrificed and the thymus was excised and minced into a single cell suspension. The cells were then hypotonically swollen in 75 mM KCl (37° C) for 15 minutes followed by fixation in 3:1 methanol:acetic acid. Metaphase spreads were obtained by dropping fixed cells onto microscope slides (Superfrost Plus-Fisher Brand). The slides were stained with 10% Giemsa stain in Gurr Buffer (Invitrogen) for 10 minutes, washed, mounted, and metaphase spreads were photographed. To determine ploidy, chromosomes were counted from a minimum of 50 metaphase spreads/mouse in a manner blinded to genotype.
Immunoblot analysis
Lysates prepared from pre-malignant thymi or thymic tumors were made in RIPA buffer (1X PBS, 1% NP-40, 0.5% DOC, 0.1% SDS) supplemented with a protease inhibitor cocktail (Sigma) and 2-mercaptoethanol. Protein concentration was determined using the DC Bradford assay kit (Biorad). Proteins were transferred onto a nitrocellulose membrane (Biorad) and stained with Ponceau S (Sigma) to determine transfer efficiency. The membranes were then blocked in 5% dry fat-free milk in PBST (1X PBS, and 0.05% Tween 20) for 1 hour at room temperature and probed with primary antibody overnight at 4°C. The following primary antibodies were used: anti-MnSOD (Upstate Cell Signaling Solutions), anti-CuZnSOD (The Binding Site Limited, UK), anti-Catalase (gift from Larry W. Oberley), and anti-Actin AC-40 (Sigma). After detection with the primary antibody, the membranes were washed in PBST three times and incubated with the following horse radish peroxidase-conjugated secondary antibodies in 5% dry fat-free milk in PBST for 2 hours at room temperature: Goat anti-Rabbit (Caltag Laboratories), Goat anti-Mouse (Santa Cruz Biotechnology), and Donkey anti-Sheep (Sigma). After incubation, the membranes were washed three times in PBST and the bands were revealed in films following ECL staining (Perkin Elmer). Densitometry analysis was performed with the UVP Bioimaging System (UVP Inc., Upland, CA). For quantitative purposes, the ratio of protein expression/actin expression was normalized to transgene negative control mice.
Statistical Analysis
Survival analysis was performed to assess time-to-death differences between the three treatment groups (MnSOD +/+, MnSOD +/−, and Lck-MnSOD). Animals that were not sacrificed during the experiment were treated as censored observations in the analysis. Estimates of overall survival were obtained with the methods of Kaplan-Meier. Group comparisons were based on the generalized log-rank test statistic of Fleming and Harington (1981). Specifically, we specified that the test statistic weight group differences proportional to the Kaplan-Meier estimates of survival calculated from the combined sample of study animals. In other words, we used a weighted log-rank test that was powered to detect survival differences between the three treatment groups that occur earlier in time. Analysis of the distribution of aneuploidy percentages observed in the Lck-Bax38/1 transgenic mice showed the data did not exhibit a normal distribution. Instead, some animals appeared similar to the controls while other mice had markedly increased aneuploidy. Therefore, the Fisher’s exact test was used to compare the different groups. A cutoff value of 5% was used based on the frequency of aneuploidy observed in the transgene negative control mice. A two-tailed Student’s t test was used to compare differences in cellularity, cell death, cell cycle, and normalized protein expression between groups. A two-way analysis of variance (ANOVA) was used to compare differences in DHE staining between Lck-Bax38/1 mice and transgene negative controls.
Results
Increased oxidative stress in thymocytes from Lck-Bax38/1 transgenic mice
To determine if enforced Bax expression increased free radical levels, DHE staining was performed on pre-malignant thymocytes isolated from 6 to 10 week old Lck-Bax38/1 transgenic mice. Thymocytes were also stained with an anti-Thy1.2 antibody to ensure our analysis focused specifically on T cells. Flow cytometric analysis of Thy1.2-postitive DHE-stained thymocytes revealed two populations harboring different levels of DHE staining (Figure 1A). The lower population had essentially the same fluorescence as unstained cells (data not shown). We therefore based the analysis on the population with higher DHE fluorescence. Thymocytes from Lck-Bax38/1 transgenic mice had an increase in DHE fluorescence compared to control mice (Figure 1B). DHE staining of thymocytes from the Lck-Bax38/1 were significantly higher when four independent experiments were analyzed (Figure 1C).
Figure 1. Increased DHE oxidation in Lck-Bax38/1 transgenic mice.
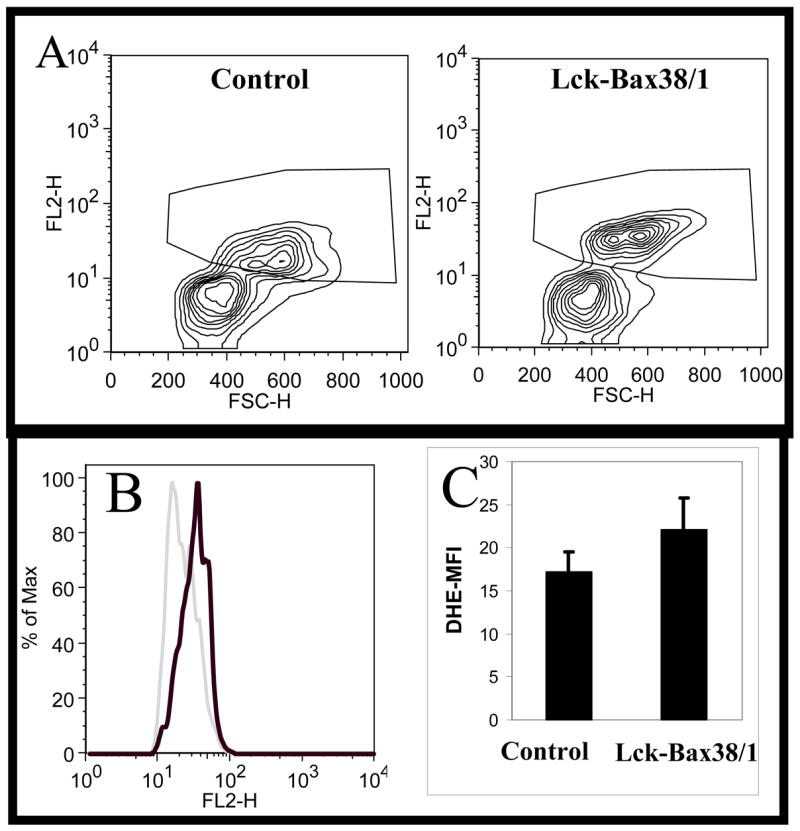
Thymocytes from control and Lck-Bax38/1 mice were isolated and stained with DHE as described in the Materials and Methods. Contour plots of viable (based on FSC-SSC staining) Thy1.2-positive lymphocytes is shown. The plots illustrate the two populations that are observed in these experiments and the gating strategy use to analyze the DHE high population. (B) Representative histogram overlay of the DHE positive population from the Lck-Bax38/1 sample (heavy dark line) and the control sample (light gray line). (C) The FL2-H mean fluorescence intensity (DHE-MFI) values (Mean +/− SEM) from four independent experiments is shown. In all four experiments, thymocytes from Lck-Bax38/1 mice had increased DHE staining relative to control mice.*P <0.01 using a two-way analysis of variance (ANOVA).
Antioxidant levels in Lck-Bax38/1 pre-malignant thymocytes and thymic tumors
To determine if steady state levels of endogenous antioxidants varied in pre-malignant thymocytes and in thymic tumors in MnSOD +/+ Lck-Bax38/1 mice, immunoblot analysis for MnSOD, CuZnSOD, and Catalase was carried out. In the pre-malignant thymi, the average antioxidant enzyme expression levels of 8 Lck-Bax38/1 mice were not statistically different than controls (Figure 2A and B). However, two mice had approximately a three-fold increase in MnSOD expression prompting us to further examine antioxidant levels in the tumors. Significant differences in all three antioxidant enzymes were detected in thymic tumor lysates. For MnSOD, increased expression was observed in six out of ten tumors whereas three had reduced expression compared to normal thymic tissue. All tumors had displayed reduced CuZnSOD expression. Nine out of ten tumors had increased catalase expression (Figure 2C and D). These alterations in anti-oxidant enzyme levels and previous studies linking MnSOD levels to tumor formation led us to examine the tumor suppressive properties of this enzyme in Lck-Bax38/1 transgenic mice.
Figure 2. Altered antioxidant levels in Lck-Bax38/1 thymic tumors.

Protein levels of key antioxidants were assessed in thymi isolated from control and MnSOD +/+ Lck-Bax38/1 premalignant mice and thymic tumors from these mice. Immunoblot analysis for MnSOD, CuZnSOD, and Catalase from pre-malignant thymi (A) and thymic tumors (C) are shown and compared to samples from three control non-transgenic thymi. Quantification of antioxidant protein expression in pre-malignant thymi (B) or thymic tumors (D) from Lck-Bax38/1 mice is normalized to Actin. Each diamond corresponds to the relative amount of protein expression from an individual thymus or thymic tumor. Statistical significance for differences in antioxidant expression in both Lck-Bax38/1 pre-malignant thymi and thymic tumors were assessed by a two-tailed Student’s t test. The mean value for all three enzymes were not statistically different between pre-malignant Lck-Bax38/1 mice and control thymi while the mean values in the tumors were significantly different from the controls (*p<0.05).
Generation of Lck-MnSOD transgenic mice
The human MnSOD cDNA was placed under control of the Lckpr promoter to restrict MnSOD expression to the T cell lineage. Transgenic mouse lines were generated that expressed elevated levels of MnSOD and the highest expressing line (Line A) was selected for subsequent studies. Immunoblot analysis revealed a marked increase in protein expression in the Lck-MnSOD versus the non-transgenic control mice (Figure 3A and B). Importantly, the precursor protein was not detected in these lysates suggesting the mitochondrial leader sequence was efficiently removed when the protein was imported into the mitochondria [29]. However, we cannot exclude the expression of MnSOD in non-mitochondrial compartments. To verify that the protein was functional, an activity assay was performed on lysates isolated from thymic tissue. MnSOD activity was approximately nine-fold higher in Lck-MnSOD mice as compared to control mice (Figure 3C). Since both Bax and MnSOD transgenes are being expressed off the same promoter, the effect of the Lck-MnSOD transgene on Bax protein levels was determined. Bax expression in the Lck-Bax38/1 mice was not reduced by the presence of the Lck-MnSOD transgene. Normalized to Actin, Bax levels were 32.85 ± 25.02 (mean ± SD) in the Lck-MnSOD positive mice and 21.74 ± 7.43 in the Lck-MnSOD negative mice.
Figure 3. Increased expression and activity of MnSOD in transgenic mice.

Thymocyte lysates were isolated from three control and three Lck-MnSOD transgenic mice as described in the Materials and Methods. (A) Immunoblot analysis for MnSOD from transgene negative (MnSOD +/+) and transgene positive mice is shown. (B) Quantification (Mean ± SD) of MnSOD thymocyte protein expression normalized to Actin is shown. (C) MnSOD activity (Mean ± SD) in thymocyte lysates from three transgene negative (MnSOD +/+) and three Lck-MnSOD mice is shown.
The effect of MnSOD gene dosage on thymic cellularity and apoptosis
MnSOD expression has been reported to be anti-apoptotic in some settings [30]. To determine if MnSOD levels affected Bax-induced apoptosis in vivo, thymic cellularity (known to be reduced by enforced Bax expression) was assessed in MnSOD +/−, +/+, and Lck-MnSOD mice. Thymic cellularity in Lck-Bax38/1 transgenic mice was not affected by MnSOD gene dosage (Figure 4A). Furthermore, MnSOD gene dosage did not affect either dexamethasone-induced cell death or spontaneous in vitro cell death in either control or Lck-Bax38/1 mice (Figure 4B).
Figure 4. MnSOD gene dosage does not affect thymic cellularity and apoptosis.

(A) The total number of thymocytes from mice of the indicated genotypes is shown. Each diamond corresponds to the total number of viable thymocytes observed from an individual mouse. (B) The graph shows in vitro thymocyte viability (trypan blue exclusion) from mice of the indicated genotypes either 12 hours after treatment with 1 μM dexamethasone (Black bars) or 48 hours in culture in the absence of any treatment (Gray bars). The data shown are the mean ± SD from two independent experiments.
The effect of MnSOD gene dosage on cellular proliferation
Enforced Bax expression increased the percentage of proliferating thymocytes in transgenic mice [10] and shortened the transition time from G0/G1 to S phase in ConA-stimulated Bax-expressing T cells [31]. To determine if MnSOD levels affect thymocyte proliferation in Lck-Bax38/1 transgenic mice, cell cycle analysis of freshly isolated thymocytes was carried out. As was shown in previous studies, the percentage of cells in S/G2/M was increased in Lck-Bax38/1 mice; however, variations in MnSOD levels had no effect on thymocyte proliferation in either the presence or absence of enforced Bax expression (Figure 5A and B).
Figure 5. MnSOD gene dosage does not alter thymocyte cell cycle in control or Lck-Bax38/1 transgenic mice.
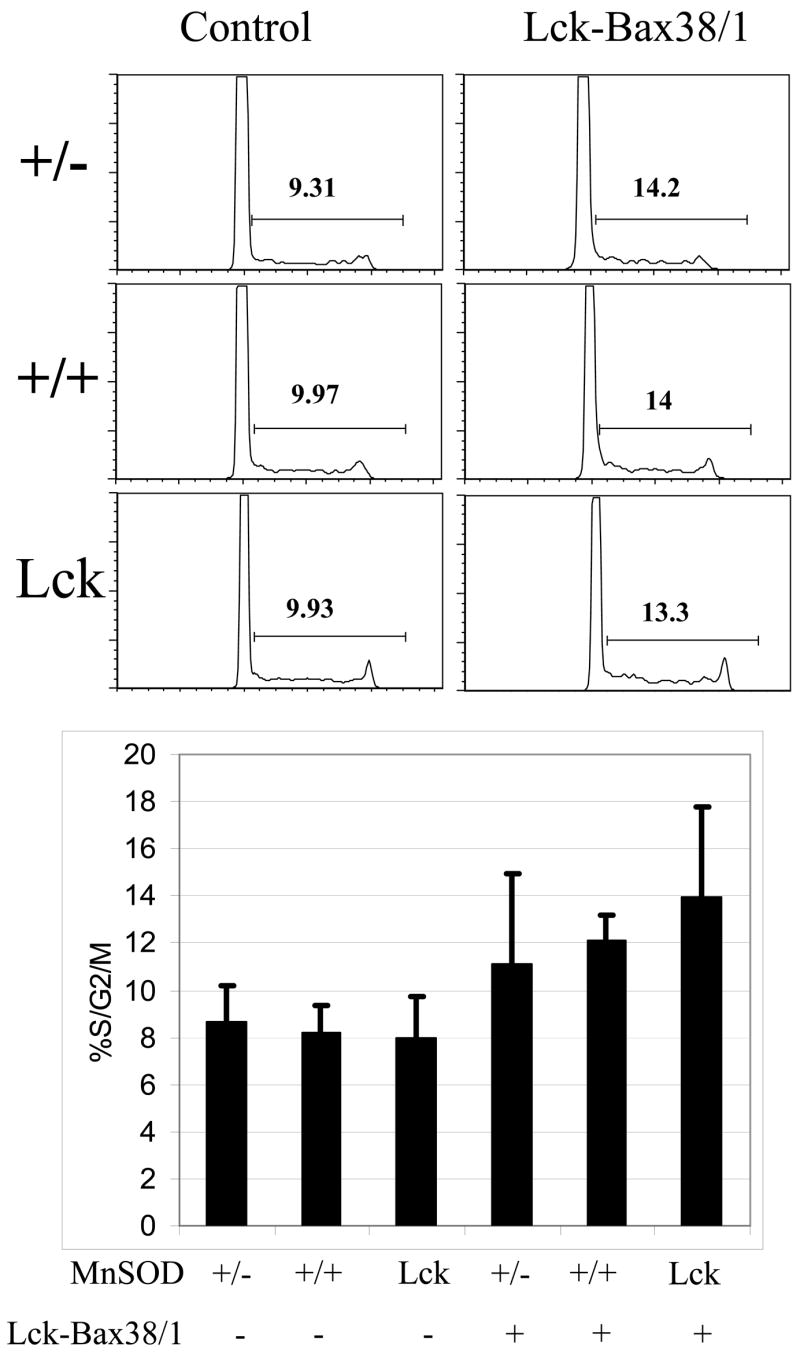
(A) Shown are representative DNA content profiles or propidium iodide stained cells from mice of the indicated genotypes. The percentage of proliferating (%S/G2/M) cells for each panel is indicated. (B) The % S/G2/M (mean ± SD) of thymocytes from 6–12 week old mice of the indicated genotype is shown. A minimum of four mice was examined in each group. While Lck-Bax38/1 transgenic mice had a higher fraction of dividing cells, MnSOD gene dosage had no significant effect on thymocyte proliferation in either control or Lck-Bax38/1 mice.
Aneuploidy in Lck-Bax38/1 transgenic mice is attenuated by increased MnSOD expression
Previous studies have demonstrated that aneuploidy is an early event, relative to tumor formation, in Lck-Bax38/1 mice [4]. To determine if MnSOD gene dosage affects aneuploidy, quantitative cytogenetic analysis was carried out on thymocytes isolated from 6 to 12 week old MnSOD +/−, MnSOD +/+, and Lck-MnSOD mice with and without Lck-Bax38/1 expression. All cytogenetic samples were prepared directly from the mice without in vitro culturing to assure that the observed aneuploidy occurred in vivo. For each mouse, mitotic spreads were stained with Giemsa, photographed, and the number of chromosomes in each metaphase cell was counted. Based on the level of aneuploidy in control mice, a cutoff of 5% was used for statistical analysis to determine if MnSOD affected aneuploidy. MnSOD +/− and Lck-MnSOD control mice by themselves did not affect the level of thymocyte aneuploidy. However, in the MnSOD +/+ Lck-Bax38/1 mice, eight out of nine had levels of aneuploidy above the cutoff which was significantly different from the MnSOD +/+ controls. In the MnSOD +/− mice, all six of the Lck-Bax38/1 mice had aneuploidy levels above the cutoff. This was significantly different from the MnSOD +/− controls but was not significantly different from the MnSOD +/+ Lck-Bax38/1 mice. Remarkably, increased MnSOD expression significantly attenuated aneuploidy as only two out of eight Lck-MnSOD Lck-Bax38/1 mice were aneuploid (Figure 6). In MnSOD +/−, +/+, and Lck-MnSOD control mice, the rare aneuploid cells generally differed from diploid by the loss of one or two chromosomes that likely represent chromosomes lost in sample preparation (data not shown). In contrast, the distribution of the chromosome numbers in metaphase spreads from individual Lck-Bax38/1 mice regardless of MnSOD gene dosage frequently differed from diploid by a gain of one or more chromosomes making an error in sample preparation unlikely (data not shown).
Figure 6. MnSOD gene dosage affects thymic aneuploidy in Lck-Bax38/1 transgenic mice.
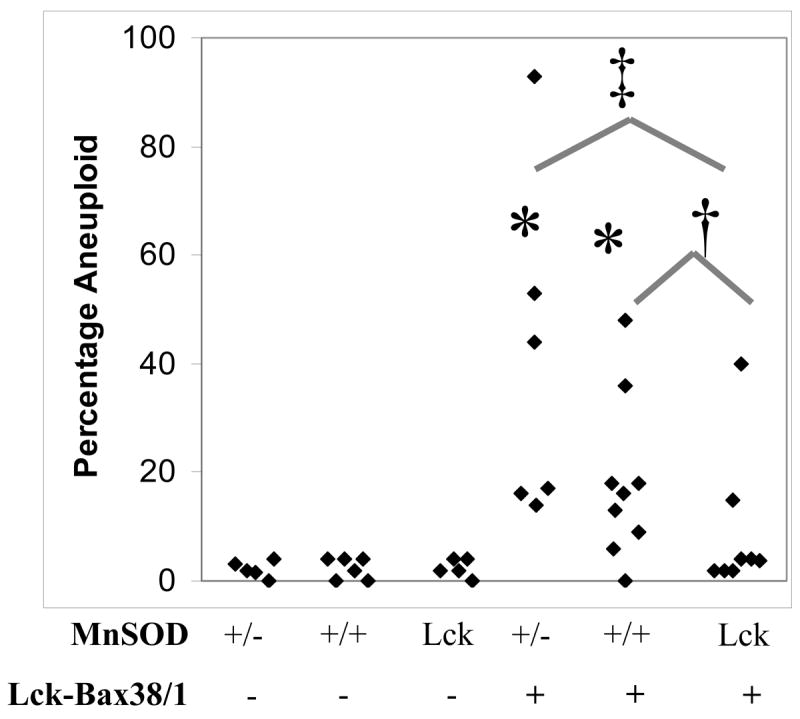
Shown are the percentage of aneuploid thymocytes from mice between 6 and 12 weeks of age. Each diamond represents the percentage of aneuploid cells observed in a minimum of 50 thymic metaphase spreads from each individual mouse. Statistical significance for ploidy analysis was assessed by Fisher’s exact test as described in the Materials and Methods. *p<0.01 vs transgene negative control mice. Lck-MnSOD expression attenuated aneuploidy in Lck-Bax38/1 mice. †p<0.05 vs MnSOD +/+ Lck-Bax38/1 mice. ‡p<0.01 vs MnSOD +/− Lck-Bax38/1 mice.
The effect of MnSOD gene dosage on lymphomagenesis
To determine if MnSOD exhibits tumor suppressive properties in this mouse model of lymphoma, tumor formation was examined in Lck-Bax38/1 mice expressing various levels of MnSOD. Spontaneous tumor formation in Lck-Bax38/1 mice was significantly accelerated in MnSOD +/−mice compared to Lck-MnSOD transgene positive mice (Figure 7). Survival of the MnSOD +/+ Lck-Bax38/1 mice was intermediate between the Lck-MnSOD transgene positive mice and the MnSOD +/− mice. This study was not powered to detect differences in tumor formation of this magnitude but the observed dose response reinforces the significant difference between the MnSOD +/− mice and the Lck-MnSOD mice.
Figure 7. MnSOD gene dosage affects the onset of tumorigenesis in Lck-Bax38/1 transgenic mice.

Kaplan-Meier lymphoma free survival analysis of Lck-Bax38/1 mice on backgrounds expressing various levels of MnSOD is shown. MnSOD +/+ (●), MnSOD +/− (□), and Lck-MnSOD (♦) mice were followed for lymphoma free survival as described in the Materials and Methods. Lymphoma formation in Lck-Bax38/1 mice was significantly (P=0.015) accelerated in MnSOD +/− mice compared to Lck-MnSOD transgene positive mice. Tumor formation of the MnSOD +/+ Lck-Bax38/1 was not significantly different from either the MnSOD +/− (P=0.062) or Lck-MnSOD (P=0.400) but survival of these mice was intermediate between the groups supporting a dose response relationship between tumor formation and MnSOD expression levels.
MnSOD protein expression is retained in MnSOD +/− Lck-Bax38/1 thymic tumors
A limited number of studies have reported loss of heterozygosity (LOH) for MnSOD in malignancy [32]. To determine if the wild-type MnSOD allele is lost in tumors from MnSOD +/− Lck-Bax38/1 mice, protein expression was determined by immunoblots. Ten out ten MnSOD +/− Lck-Bax38/1 tumors examined retained MnSOD protein expression (Figure 8). While MnSOD enzyme activity was not determined, normalized MnSOD protein expression in thymic tumors was approximately half that of pre-malignant MnSOD +/+ thymic controls. While these studies do not rule out point mutations that disrupt MnSOD activity in these tumors, point mutations in the MnSOD gene have not been previously described in human or murine tumors. These results are consistent with studies in humans in which MnSOD protein and activity are reduced but not completely lost in cancer and suggest that LOH is an infrequent event in tumors arising in MnSOD +/− mice.
Figure 8. MnSOD protein expression is retained in MnSOD +/− Lck-Bax38/1 thymic tumors.

Thymocyte and thymic tumor lysates were prepared from mice of the indicated genotypes. (A) Immunoblot analysis for MnSOD expression in three MnSOD +/+ control thymi and ten MnSOD +/−Lck-Bax38/1 thymic tumors is shown. (B) Quantification (Mean ± SD) of MnSOD protein expression normalized to Actin is shown. The means of these groups were not significantly different.
Discussion
Oxidative stress is thought to play an integral role in oncogenesis. Many studies have shown that ROS-mediated DNA damage can promote oncogenic transformation by increasing mutation rates [33]. In addition to being mutagenic, recent studies have shown that ROS can function as second messengers in signal transduction pathways [34]. These pathways are known to influence various cellular processes such as proliferation, survival, and motility. Not surprisingly, activation of one or more of these signal transduction pathways could augment oncogenic transformation. Previous studies of Lck-Bax38/1 transgenic mice demonstrated increased thymocyte proliferation [10] and increased CIN [4]. In this study, increased DHE staining in pre-malignant thymocytes from Lck-Bax38/1 transgenic mice and significant changes in MnSOD, CuZnSOD, and Catalase protein expression in thymic tumors suggest that ROS pathways may be involved in this model. Based on these observations and other studies that demonstrate members of the Bcl-2 family can modulate ROS, we hypothesized that oxidative stress was contributing to the pathogenesis of lymphoma formation in Lck-Bax38/1 mice and that alteration of MnSOD gene dosage may impact tumor formation in this model.
MnSOD has been shown to influence cell death pathways. Many reports have demonstrated increased MnSOD expression can suppress apoptosis induced by a variety of different stimuli [35]. In contrast, MnSOD deficiency increased apoptosis in cardiomyocytes [36] and hepatocytes from MnSOD +/− mice exhibited age related decline of mitochondrial function had increased apoptosis [37]. In the studies described herein, increased or reduced MnSOD expression did not appear to affect thymocyte apoptosis in either control or Lck-Bax38/1 transgenic mice. Both in vivo death as measured by cellularity data and in vitro death following dexamethasone treatment or spontaneous cell death were altered by MnSOD dosage. Of note, increased MnSOD enhanced dexamethasone induced death of IM-9 multiple myeloma cells [38]. However, we did not observe an increase in death in thymocytes expressing MnSOD. Thus alterations in apoptotic pathways do not appear to explain the tumor suppressive properties of MnSOD.
Many studies have shown that increased expression of MnSOD exhibits tumor suppressive properties. In many of these studies, the tumor suppressive effect of increased MnSOD expression appears to affect cellular proliferation and this activity has been proposed to explain the tumor suppressive properties of MnSOD (Figure 9) [39]. It has been posited that the tumor suppressive effect of MnSOD is based on changing the cellular redox state by altering the superoxide/hydrogen peroxide balance [39, 40]. This in turn can affect signal transduction pathways that govern cellular proliferation and therefore contribute to malignant transformation. However, in this study, MnSOD gene dosage had no effect on cellular proliferation in either pre-malignant control or Lck-Bax38/1 thymocytes. This suggests that the tumor suppressive activity of MnSOD may involve pathways other than cellular proliferation.
Figure 9. Model for Bax induced lymphoma formation.
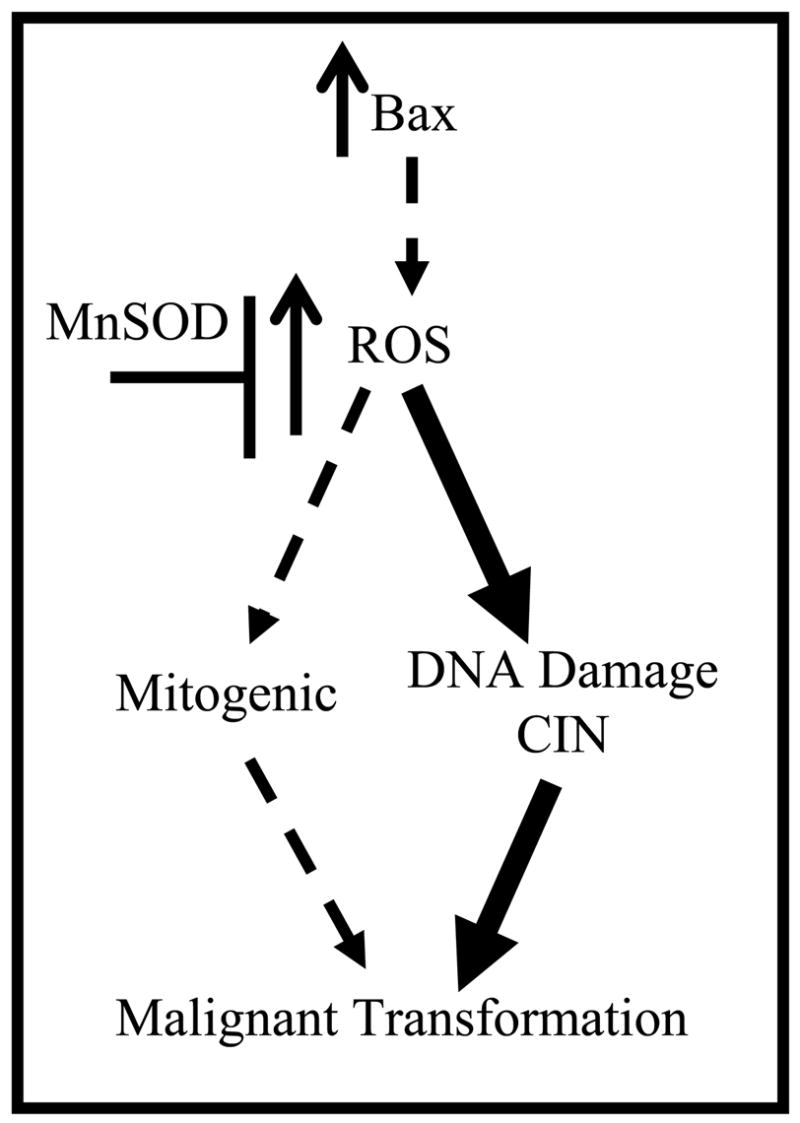
Previous studies suggest that ROS may promote malignant transformation by one of two routes either involving cellular proliferation or genomic instability. We hypothesized that Bax-induced lymphoma was mediated in part by alterations in ROS. The current study supports this hypothesis by demonstrating that MnSOD levels alter aneuploidy and the rate of tumor formation in Lck-Bax38/1 mice. Furthermore, since MnSOD had no impact on pre-malignant cellular proliferation in this model, the data suggest that the major route for ROS involvement in this model is via alterations in genomic instability (heavy arrows) as opposed to changes in mitogenic pathways (dotted arrows).
Finally, MnSOD may be a tumor suppressor by limiting genomic instability caused by ROS. Numerous studies link ROS to genomic instability. ROS can damage DNA directly by forming base modifications such as 8-OH-dG, DNA-protein cross links, and can physically induce strand breakage, which can introduce mutations into the genome [41]. Alternatively, ROS may inactivate components of the mismatch repair pathway [42] and indirectly result in a “mutator phenotype” [43]. At the chromosome level, oxidative stress can also promote CIN in the form of aneuploidy and chromosomal breakage and translocations. CHO cells cultured in increasing amounts of hydrogen peroxide displayed changes in ploidy as well as catalase gene amplification [21, 44]. Fibroblasts derived from MnSOD −/− mice displayed increased dihydroethidium oxidation, a superoxide sensitive dye, as well as chromosomal aberrations in the form of breakage and translocations [20]. Similarly, another study has implicated superoxide radical as inducing CIN when Chinese hamster lung fibroblasts expressing a mutant form of succinate dehydrogenase subunit C had increased superoxide production and became aneuploid [19]. Of note, this phenotype was reversed upon restoration of the wild-type isoform in mutant-expressing cells. In the studies described here, MnSOD significantly reduced aneuploidy in thymocytes isolated from young mice. The dramatic reduction in thymic cellularity (due to Bax expression) confirms that this effect precedes overt tumor formation. Since the only known function of MnSOD is its anti-oxidant activity, these results support an important role for ROS in both CIN and lymphoma development in this model. These observations are in concordance with other studies implicating ROS as an upstream mediator of CIN and support the hypothesis that increased ROS promotes CIN in this lymphoma model.
Variations in MnSOD expression levels did have a significant effect on tumor formation in Lck-Bax38/1 transgenic mice. These results can be explained in the context of MnSOD activity. Previous reports have shown that MnSOD +/− mice have approximately half of the enzyme activity as compared to their wild-type counterparts in various tissues [16, 36]. Our results have demonstrated that thymic MnSOD activity in Lck-MnSOD transgenic mice was approximately nine fold more than that of MnSOD +/+ controls (Figure 3). Since tumor formation in Lck-Bax38/1 mice was significantly accelerated in MnSOD +/− mice compared to Lck-MnSOD transgene positive mice, these findings support the hypothesis that MnSOD as a tumor suppressor and are consistent with a role for ROS in the development of CIN. Studies of DHE oxidation and fluorescence of thymocytes from Lck-Bax38/1 mice support a role for ROS in this process (Figure 1). However, we note that DHE staining was not significantly reduced by enforced expression of MnSOD (data not shown). This suggests that over-expression of MnSOD may not alter basal levels of oxidant production under physiological conditions but only becomes important under pathological conditions.
The current study supports a pathogenic role for ROS in Bax-induced lymphoma. While conflicting data exist concerned the mechanism for ROS in tumor formation (Figure 9), these studies support a model where Bax-induced lymphoma formation involves ROS mediated alterations in CIN that are independent of any changes in cell death or cell proliferation. This data also supports the model that CIN is an early precursor lesion in cancer and “enables” the additional genetic changes required for malignant transformation [18].
Acknowledgments
We thank Agnieska Wydra and Peter Harris for assistance in animal husbandry, Frank Faraci for providing MnSOD heterozygous mice, Sean Martin for technical support and Larry Oberley for providing the hMnSOD cDNA.
Abbreviations
- CIN
Chromosomal Instability
- ROS
reactive oxygen species
- MnSOD
superoxide dismutase 2
- H2O2
hydrogen peroxide
This work was supported in part by RO1 #CA104695 (CMK), a predoctoral NRSA fellowship grant 5F31CA103362 (CIvdW), NIH RO1-CA100045 (DRS) and NIH P30-CA086862 (DRS, MCC) from the NIH.
Publisher's Disclaimer: This is a PDF file of an unedited manuscript that has been accepted for publication. As a service to our customers we are providing this early version of the manuscript. The manuscript will undergo copyediting, typesetting, and review of the resulting proof before it is published in its final citable form. Please note that during the production process errors may be discovered which could affect the content, and all legal disclaimers that apply to the journal pertain.
References
- 1.Bakhshi A, Jensen JP, Goldman P, Wright JJ, McBride OW, Epstein AL, Korsmeyer SJ. Cloning the chromosomal breakpoint of t(14;18) human lymphomas: clustering around JH on chromosome 14 and near a transcriptional unit on 18. Cell. 1985;41:899–906. doi: 10.1016/s0092-8674(85)80070-2. [DOI] [PubMed] [Google Scholar]
- 2.Rampino N, Yamamoto H, Ionov Y, Li Y, Sawai H, Reed JC, Perucho M. Somatic frameshift mutations in the bax gene in colon cancers of the microsatellite mutator phenotype. Science. 1997;275:967–969. doi: 10.1126/science.275.5302.967. [DOI] [PubMed] [Google Scholar]
- 3.Meijerink JPP, Mensink EJBM, Wang K, Sedlak TW, Sloetjes AW, Dewitte T, Waksman G, Korsmeyer SJ. Hematopoietic malignancies demonstrate loss-of-function mutations of. BAX Blood. 1998;91:2991–2997. [PubMed] [Google Scholar]
- 4.Luke JJ, Van de Wetering CI, Knudson CM. Lymphoma development in Bax transgenic mice is inhibited by Bcl-2 and associated with chromosomal instability. Cell Death Differ. 2003;10:740–748. doi: 10.1038/sj.cdd.4401233. [DOI] [PubMed] [Google Scholar]
- 5.de la Coste A, Mignon A, Fabre M, Gilbert E, Porteu A, Van Dyke T, Kahn A, Perret C. Paradoxical inhibition of c-myc-induced carcinogenesis by Bcl-2 in transgenic mice. Cancer Res. 1999;59:5017–5022. [PubMed] [Google Scholar]
- 6.Callagy GM, Pharoah PD, Pinder SE, Hsu FD, Nielsen TO, Ragaz J, Ellis IO, Huntsman D, Caldas C. Bcl-2 Is a Prognostic Marker in Breast Cancer Independently of the Nottingham Prognostic Index. Clin Cancer Res. 2006;12:2468–2475. doi: 10.1158/1078-0432.CCR-05-2719. [DOI] [PubMed] [Google Scholar]
- 7.Hogarth LA, Hall AG. Increased BAX expression is associated with an increased risk of relapse in childhood acute lymphocytic leukemia. Blood. 1999;93:2671–2678. [PubMed] [Google Scholar]
- 8.Schmitt CA, Fridman JS, Yang M, Baranov E, Hoffman RM, Lowe SW. Dissecting p53 tumor suppressor functions in vivo. Cancer Cell. 2002;1:289–298. doi: 10.1016/s1535-6108(02)00047-8. [DOI] [PubMed] [Google Scholar]
- 9.Gurova KV, Gudkov AV. Paradoxical role of apoptosis in tumor progression. J Cell Biochem. 2003;88:128–137. doi: 10.1002/jcb.10382. [DOI] [PubMed] [Google Scholar]
- 10.Knudson CM, Johnson GM, Lin Y, Korsmeyer SJ. Bax accelerates tumorigenesis in p53-deficient mice. Cancer Res. 2001;61:659–665. [PubMed] [Google Scholar]
- 11.Hockenbery DM, Oltvai ZN, Yin XM, Milliman CL, Korsmeyer SJ. Bcl-2 functions in an antioxidant pathway to prevent apoptosis. Cell. 1993;75:241–251. doi: 10.1016/0092-8674(93)80066-n. [DOI] [PubMed] [Google Scholar]
- 12.Veis DJ, Sorenson CM, Shutter JR, Korsmeyer SJ. Bcl-2-deficient mice demonstrate fulminant lymphoid apoptosis, polycystic kidneys, and hypopigmented hair. Cell. 1993;75:229–240. doi: 10.1016/0092-8674(93)80065-m. [DOI] [PubMed] [Google Scholar]
- 13.Priault M, Bessoule JJ, Grelaud-Coq A, Camougrand N, Manon S. Bax-induced cell death in yeast depends on mitochondrial lipid oxidation. Eur J Biochem. 2002;269:5440–5450. doi: 10.1046/j.1432-1033.2002.03234.x. [DOI] [PubMed] [Google Scholar]
- 14.Kirkland RA, Franklin JL. Bax affects production of reactive oxygen by the mitochondria of non-apoptotic neurons. Exp Neurol. 2007;204:458–461. doi: 10.1016/j.expneurol.2006.09.013. [DOI] [PMC free article] [PubMed] [Google Scholar]
- 15.Elchuri S, Oberley TD, Qi W, Eisenstein RS, Jackson Roberts L, Van Remmen H, Epstein CJ, Huang TT. CuZnSOD deficiency leads to persistent and widespread oxidative damage and hepatocarcinogenesis later in life. Oncogene. 2005;24:367–380. doi: 10.1038/sj.onc.1208207. [DOI] [PubMed] [Google Scholar]
- 16.Van Remmen H, Ikeno Y, Hamilton M, Pahlavani M, Wolf N, Thorpe SR, Alderson NL, Baynes JW, Epstein CJ, Huang T-T, Nelson J, Strong R, Richardson A. Life-long reduction in MnSOD activity results in increased DNA damage and higher incidence of cancer but does not accelerate aging. Physiol Genomics. 2003;16:29–37. doi: 10.1152/physiolgenomics.00122.2003. [DOI] [PubMed] [Google Scholar]
- 17.Neumann CA, Krause DS, Carman CV, Das S, Dubey DP, Abraham JL, Bronson RT, Fujiwara Y, Orkin SH, Van Etten RA. Essential role for the peroxiredoxin Prdx1 in erythrocyte antioxidant defence and tumour suppression. Nature. 2003;424:561–565. doi: 10.1038/nature01819. [DOI] [PubMed] [Google Scholar]
- 18.Hanahan D, Weinberg RA. The hallmarks of cancer. Cell. 2000;100:57–70. doi: 10.1016/s0092-8674(00)81683-9. [DOI] [PubMed] [Google Scholar]
- 19.Slane BG, Aykin-Burns N, Smith BJ, Kalen AL, Goswami PC, Domann FE, Spitz DR. Mutation of succinate dehydrogenase subunit C results in increased O2.−, oxidative stress, and genomic instability. Cancer Res. 2006;66:7615–7620. doi: 10.1158/0008-5472.CAN-06-0833. [DOI] [PubMed] [Google Scholar]
- 20.Samper E, Nicholls DG, Melov S. Mitochondrial oxidative stress causes chromosomal instability of mouse embryonic fibroblasts. Aging Cell. 2003;2:277–285. doi: 10.1046/j.1474-9728.2003.00062.x. [DOI] [PubMed] [Google Scholar]
- 21.Hunt CR, Sim JE, Sullivan SJ, Featherstone T, Golden W, Vonkappherr C, Hock RA, Gomez RA, Parsian AJ, Spitz DR. Genomic instability and catalase gene amplification induced by chronic exposure to oxidative stress. Cancer Res. 1998;58:3986–3992. [PubMed] [Google Scholar]
- 22.Oberley LW, Buettner GR. Role of superoxide dismutase in cancer: a review. Cancer Res. 1979;39:1141–1149. [PubMed] [Google Scholar]
- 23.Church SL, Grant JW, Ridnour LA, Oberley LW, Swanson PE, Meltzer PS, Trent JM. Increased manganese superoxide dismutase expression suppresses the malignant phenotype of human melanoma cells. Proceedings of the National Academy of Sciences of the United States of America. 1993;90:3113–3117. doi: 10.1073/pnas.90.7.3113. [DOI] [PMC free article] [PubMed] [Google Scholar]
- 24.Weydert C, Roling B, Liu J, Hinkhouse MM, Ritchie JM, Oberley LW, Cullen JJ. Suppression of the malignant phenotype in human pancreatic cancer cells by the overexpression of manganese superoxide dismutase. Mol Cancer Ther. 2003;2:361–369. [PubMed] [Google Scholar]
- 25.Venkataraman S, Jiang X, Weydert C, Zhang Y, Zhang HJ, Goswami PC, Ritchie JM, Oberley LW, Buettner GR. Manganese superoxide dismutase overexpression inhibits the growth of androgen-independent prostate cancer cells. Oncogene. 2005;24:77–89. doi: 10.1038/sj.onc.1208145. [DOI] [PubMed] [Google Scholar]
- 26.Zhao Y, Xue Y, Oberley TD, Kiningham KK, Lin SM, Yen HC, Majima H, Hines J, St Clair D. Overexpression of manganese superoxide dismutase suppresses tumor formation by modulation of activator protein-1 signaling in a multistage skin carcinogenesis model. Cancer Res. 2001;61:6082–6088. [PubMed] [Google Scholar]
- 27.Sentman CL, Shutter JR, Hockenbery D, Kanagawa O, Korsmeyer SJ. Bcl-2 inhibits multiple forms of apoptosis but not negative selection in thymocytes. Cell. 1991;67:879–888. doi: 10.1016/0092-8674(91)90361-2. [DOI] [PubMed] [Google Scholar]
- 28.Spitz DR, Oberley LW. An assay for superoxide dismutase activity in mammalian tissue homogenates. Anal Biochem. 1989;179:8–18. doi: 10.1016/0003-2697(89)90192-9. [DOI] [PubMed] [Google Scholar]
- 29.Wispe JR, Clark JC, Burhans MS, Kropp KE, Korfhagen TR, Whitsett JA. Synthesis and processing of the precursor for human mangano-superoxide dismutase. Biochim Biophys Acta. 1989;994:30–36. doi: 10.1016/0167-4838(89)90058-7. [DOI] [PubMed] [Google Scholar]
- 30.Dasgupta J, Subbaram S, Connor KM, Rodriguez AM, Tirosh O, Beckman JS, Jourd'Heuil D, Melendez JA. Manganese superoxide dismutase protects from TNF-alpha-induced apoptosis by increasing the steady-state production of H2O2. Antioxid Redox Signal. 2006;8:1295–1305. doi: 10.1089/ars.2006.8.1295. [DOI] [PubMed] [Google Scholar]
- 31.Brady HJ, Gil-Gomez G, Kirberg J, Berns AJ. Bax alpha perturbs T cell development and affects cell cycle entry of T cells. EMBO J. 1996;15:6991–7001. [PMC free article] [PubMed] [Google Scholar]
- 32.Liang BC, Ross DA, Greenberg HS, Meltzer PS, Trent JM. Evidence of allelic imbalance of chromosome 6 in human astrocytomas. Neurology. 1994;44:533–536. doi: 10.1212/wnl.44.3_part_1.533. [DOI] [PubMed] [Google Scholar]
- 33.Jackson AL, Loeb LA. The contribution of endogenous sources of DNA damage to the multiple mutations in cancer. Mutat Res. 2001;477:7–21. doi: 10.1016/s0027-5107(01)00091-4. [DOI] [PubMed] [Google Scholar]
- 34.Storz P. Reactive oxygen species in tumor progression. Front Biosci. 2005;10:1881–1896. doi: 10.2741/1667. [DOI] [PubMed] [Google Scholar]
- 35.Kahl R, Kampkotter A, Watjen W, Chovolou Y. Antioxidant enzymes and apoptosis. Drug Metab Rev. 2004;36:747–762. doi: 10.1081/dmr-200033488. [DOI] [PubMed] [Google Scholar]
- 36.Van Remmen H, Williams MD, Guo Z, Estlack L, Yang H, Carlson EJ, Epstein CJ, Huang TT, Richardson A. Knockout mice heterozygous for Sod2 show alterations in cardiac mitochondrial function and apoptosis. Am J Physiol Heart Circ Physiol. 2001;281:H1422–1432. doi: 10.1152/ajpheart.2001.281.3.H1422. [DOI] [PubMed] [Google Scholar]
- 37.Kokoszka JE, Coskun P, Esposito LA, Wallace DC. Increased mitochondrial oxidative stress in the Sod2 (+/−) mouse results in the age-related decline of mitochondrial function culminating in increased apoptosis. Proc Natl Acad Sci U S A. 2001;98:2278–2283. doi: 10.1073/pnas.051627098. Epub 2001 Feb 2213. [DOI] [PMC free article] [PubMed] [Google Scholar]
- 38.Hodge DR, Xiao W, Peng B, Cherry JC, Munroe DJ, Farrar WL. Enforced expression of superoxide dismutase 2/manganese superoxide dismutase disrupts autocrine interleukin-6 stimulation in human multiple myeloma cells and enhances dexamethasone-induced apoptosis. Cancer Res. 2005;65:6255–6263. doi: 10.1158/0008-5472.CAN-04-4482. [DOI] [PubMed] [Google Scholar]
- 39.Oberley LW. Mechanism of the tumor suppressive effect of MnSOD overexpression. Biomed Pharmacother. 2005;59:143–148. doi: 10.1016/j.biopha.2005.03.006. [DOI] [PubMed] [Google Scholar]
- 40.Ridnour LA, Oberley TD, Oberley LW. Tumor suppressive effects of MnSOD overexpression may involve imbalance in peroxide generation versus peroxide removal. Antioxid Redox Signal. 2004;6:501–512. doi: 10.1089/152308604773934260. [DOI] [PubMed] [Google Scholar]
- 41.Toyokuni S, Okamoto K, Yodoi J, Hiai H. Persistent oxidative stress in cancer. FEBS Lett. 1995;358:1–3. doi: 10.1016/0014-5793(94)01368-b. [DOI] [PubMed] [Google Scholar]
- 42.Chang CL, Marra G, Chauhan DP, Ha HT, Chang DK, Ricciardiello L, Randolph A, Carethers JM, Boland CR. Oxidative stress inactivates the human DNA mismatch repair system. Am J Physiol Cell Physiol. 2002;283:C148–154. doi: 10.1152/ajpcell.00422.2001. [DOI] [PubMed] [Google Scholar]
- 43.Loeb LA. A mutator phenotype in cancer. Cancer Res. 2001;61:3230–3239. [PubMed] [Google Scholar]
- 44.Spitz DR, Mackey MA, Li GC, Elwell JH, McCormick ML, Oberley LW. Relationship between changes in ploidy and stable cellular resistance to hydrogen peroxide. Journal of Cellular Physiology. 1989;139:592–598. doi: 10.1002/jcp.1041390320. [DOI] [PubMed] [Google Scholar]