

Abstract
Timing is critical. The same event can mean different things at different times and some events are more likely to occur at one time than another. We used a cued visual classification task to evaluate how changes in temporal context affect neural responses in inferior temporal cortex, an extrastriate visual area known to be involved in object processing. On each trial a first image cued a temporal delay before a second target image appeared. The animal’s task was to classify the second image by pressing one of two buttons previously associated with that target. All images were used as both cues and targets. Whether an image cued a delay time or signaled a button press depended entirely upon whether it was the first or second picture in a trial. This paradigm allowed us to compare inferior temporal cortex neural activity to the same image subdivided by temporal context and expectation. Neuronal spiking was more robust and visually evoked local field potentials (LFP’s) larger for target presentations than for cue presentations. On invalidly cued trials, when targets appeared unexpectedly early, the magnitude of the evoked LFP was reduced and delayed and neuronal spiking was attenuated. Spike field coherence increased in the beta-gamma frequency range for expected targets. In conclusion, different neural responses in higher order ventral visual cortex may occur for the same visual image based on manipulations of temporal attention.
Keywords: temporal lobe, monkey, attention, object recognition, vision, local field potentials
Introduction
In the real world, we are flooded by sensory input and, at any given time, some sensory events are more critical than the rest. Operationally defined, attention filters less relevant inputs in favor of more important inputs. Thus, we are quicker and more accurate in responding to attended, compared to unattended, events. Context and experience determine our expectations such that we may be biased to a particular location (spatial attention), a particular item (object based attention), or to a time of occurrence (temporal attention).
For visual processing, the focus of the present study, behavioral and neurophysiological investigations of attentional processes have focused largely on spatial manipulations. The electrophysiological correlate of spatial attention at the cellular level is generally seen as an increase in the magnitude of the spiking response as well as its correlation to ongoing local field activity. These effects can be found at the earliest cortical areas devoted to visual processing. For example, Ito & Gilbert (1999) showed that spatial attention modulated the firing response of neurons in primary visual cortex to bars of light in their receptive field when the animal was spatially cued and the target bars were accompanied by flankers. Effects in extrastriate cortex (V2 and V4) have been more extensively demonstrated (McAdams & Maunsell, 1999, 2000; Motter, 1993; Reynolds, Pasternak, & Desimone, 2000). As one example, Luck, Chelazzi, Hillyard, & Desimone (1997) measured neuronal spike responses to target locations and “ignored” locations that were both in the receptive field of V2 and V4 neurons. Simultaneous presentation of targets and distractors in the receptive field decreased firing compared to sequential presentations. However, in the former condition there was a greater attentional effect. The spiking response to a target stimulus was greater than a “pseudotarget” presented at the ignored location even when targets and pseudotargets were in a cell’s receptive field. Other physiological effects of attention have been observed in V4 as well. Using a paradigm in which a visual stimulus appeared in the receptive field of a V4 cell during a time when a monkey’s attention was either directed towards or away from that location, Fries et al. (2001) reported modulation of the correlation between neuron spiking and background local field potentials (the spike field coherence; SFC) suggesting that timing between neuronal events, and not just magnitude of response, may be an important component to attentional processing.
While temporal aspects of attention have been studied since the time of Wundt (Carlson, Hogendoorn, & Verstraten, 2006), such investigations have typically focused on the dynamics of attention, for example how rapidly a spatial focus of attention can shift location. More recently, investigators have begun to consider how temporal information can speed or enhance processing of targets. Nobre and colleagues (reviewed in Nobre (2001)) have provided extensive behavioral evidence that attending to locations in time (in analogy with attending to spatial locations) does speed response times. Logically, this speeded response could be solely a consequence of motor processes. Modulations of later components of the visual evoked potential are consistent with this interpretation (Doherty, Rao, Mesulam, & Nobre, 2005). However, it has been recently shown that cueing to instants in time enhances perceptual processing (Correa, Lupianez, Madrid, & Tudela, 2006; Correa, Lupianez, & Tudela, 2005). Further, in a recent study on the physiological correlates of temporal attention Doherty, et al (2005) measured the evoked potential responses while subjects performed a target detection task under conditions of spatial, temporal, or spatial + temporal attention. Temporal attention augmented the increase in the magnitude of the P1 component of the visual evoked response seen with spatial attention. This effect was maximal in parietal-occipital regions and suggested top-down effects on perceptual processing.
Exploring the cellular basis for effects of temporal attention on perceptual processing, Ghose & Maunsell (2002) demonstrated that attentional modulation of V4 neuron activity was dependent on task timing, and paralleled the temporal hazard function of visual target appearance. In that experiment, monkeys were trained to report the occurrence of a change in stimulus orientation at a peripheral location. For more complex visual discriminations, one might expect that other visual areas could be more affected by manipulation of temporal attention. For example, the large receptive fields of inferior temporal cortex (IT) neurons combined with their object specificity make them well suited to play a critical role in the detection of specific targets, even under conditions of little or no spatial ambiguity. Based on their firing profiles, IT neuron activity provides a strong signal for active processing of particular visual targets. They respond selectively to complex images and their spiking is relatively invariant to modest alterations of image size, rotation, or retinal position (Booth & Rolls, 1998; M. Ito, Tamura, Fujita, & Tanaka, 1995; Logothetis, Pauls, & Poggio, 1995; Schwartz, Desimone, Albright, & Gross, 1983; Tovee, Rolls, & Azzopardi, 1994).
To evaluate whether IT cortex reflects context dependent differences in temporal attention, we trained two monkeys on an object classification task where a single set of images were used as both temporal cues and as targets. Each image in the set was randomly assigned a temporal cue value and a button response association. Which meaning of the image was relevant was determined solely by timing within the task: (temporal context). To determine that the temporal cues had been learned we occasionally rendered them invalid and looked for response time costs.
To improve the chance of detecting the effects of temporal attention, we increased task demands by presenting targets with varying contrast. This manipulation was motivated by the hypothesis of Reynolds and Chelazzi (2004) who proposed that spatial attention alters the contrast sensitivity of neurons with receptive fields overlapping attended spatial locations. As a potential mechanism for this effect, Reynolds and Chelazzi (2004) reported that changes in the variance of input excitatory and inhibitory activity could cause changes in contrast sensitivity. Altering the synchrony of arriving inputs is one plausible mechanism for affecting these dynamic changes in input variance. Therefore, we also measured the LFP activity and the correlation between spiking and LFP activity in IT.
Materials and Methods
General
The subjects were two male macaque monkeys, M (10.0 kg) and O (8.8 kg) housed and trained in accordance with the policies and procedures set forth in the U.S. Public Health Service Policy on Humane Care and Use of Laboratory Animals and the National Institutes of Health Guide for the Care and Use of Laboratory Animals, as adopted by the Society for Neuroscience in its Policy on the Use of Animals in Neuroscience Research. All experiments were approved by the Institutional Animal Care and Use Committee of Brown University.
Both monkeys had titanium head posts implanted for maintaining head restraint. At a separate surgery both monkeys were fitted with titanium recording chambers that provided access to the left anterior temporal lobe (Horsley-Clark coordinates: +15 anterior, + 20 lateral - see Figure 1). All surgeries were performed using sterile techniques with the monkeys intubated and anesthetized with isoflurane. The combined duration of daily test sessions was between 1 to 3 hours.
Figure 1.

Recording Location. On a lateral view of the macaque brain (A.), the vertical black line shows the dorsal to ventral approach used to reach visually responsive inferior temporal cortex (gray). B. An outline of a coronal section (adapted from (Paxinos, Huang, & Toga, 2000) of the recording plane with the same gray region highlighted. The recording area targeted the inferior lip of the superior temporal sulcus and the deeper cortex on the lateral temporal lobe
Eye position was monitored with an infrared camera system (Eye Link II, SRS Research, Mississauga, Ontario, Canada) sampling at 200 Hz. Stimulus presentation was through a locally written OpenGL based stimulation program running on a dedicated graphics workstation with a screen resolution of 1024 × 768 pixels and vertical refresh rate of 100 Hz. Behavioral control for the experiments was maintained by a network of interconnected PCs running the QNX real-time OS (QSSL, Ontario, Canada). Communication with the graphics computer was by dedicated Fast-Ethernet. All events relevant to the experiment, including lever presses, eye position, and stimulus information, were streamed to disk and available for on-line monitoring. Images were clip art picture of simple everyday objects (Hemera Technologies Corporation; Seattle, Washington).
Electrophysiology
We recorded neural activity with two separate systems. One system was the Thomas Recording (Giessen, Germany) multi-channel system with a five channel head (Mountcastle, Reitboeck, Poggio, & Steinmetz, 1991). In some sessions we used a standard single electrode approach. We used glass coated tungsten electrodes (Alpha Omega, Nazareth, Israel) advanced by a Kopf Hydraulic Micropositioner (Model 670, David Kopf Instruments, Tujunga, California), interfaced to a Grass HZP input module and Model 15 Amplifier system (Grass Technologies, West Warwick, RI). The Alpha Omega electrodes were used with the Grass amplifier system which did not permit measuring impedance online. Impedances for these electrodes were typically 1.5 MOhm before use. The Thomas electrodes, which were manufactured locally, were more variable in their impedances. We pulled our electrodes to a very fine tip and they would typically have impedances in the 2-4 MOhm range.
Signals were amplified and filtered for the simultaneous recording of both action potentials (500 Hz to 8 KHz) and local field potentials (LFP; 1Hz to 100Hz -Thomas, or 0.3 Hz to 300 Hz, Grass System). For LFP recording we used a notch filter to reduce 60Hz interference. For spike analyses we sampled at 34 KHz and for LFP at 2500 Hz.
All data from a trial were saved for off-line analysis. Spike sorting employed locally written software. We visually inspected tracings to identify channels with well isolated spikes and then set amplitude thresholds and limits to select waveform samples. Subsequently k-means clustering was done on the waveform samples to divide them into separate populations. Spike density functions were generated using an adaptive kernel method similar to that of Optican and Richmond (1987).
Behavioral Task
A set of 100 objects was used as both cues and targets. Each picture had two different meanings depending on whether it was the first or second image in a trial (“context”, see also Figure 2). When a picture appeared as the first image in a trial, it carried information about the delay until the target would appear. This cue value was generally valid. On 1/5th of a day’s trials the cue was invalid and the target followed after the alternative delay (the invalid trials were randomly generated and therefore the exact proportion varied slightly from session to session). Figure 2 provides an overview of the behavioral paradigm and trial types.
Figure 2.

Behavioral Task Overview. A) The time course of a single trial. Trials began with a centered fixation spot. After the monkey fixated the spot, it was extinguished, and a single visual image from a library of 100 appeared centered in a dynamic colored frame (cue). After 500 msec this image was extinguished, but the dynamic frame remained. A delay of 1000 msec (early trials) or 2000 msec (late trials) followed after which a second image (target) selected from the same set of 100 images appeared in the center of the colored frame. The animal had to press a button to acquire a juice reward. Each image in the set of 100 was associated with both a specific temporal delay (1000 or 2000 msec) and a specific button press (right or left), each randomly assigned. The animal learned these associations over several months of preliminary behavioral training. B) Trial types used in the experiments. For 1/5th of the trials the delay value of the cue was invalid. For example, the pacifier was a “late” cue and was followed 4/5 of the time by a 2000 msec delay. However, for invalid trials the target would appear unexpectedly early (“Invalid cue/Early target” --- row 3). In addition, the pacifier could also appear as a target (as shown in row 4).
Specifically, each trial began with a 0.3 degree visual angle square fixation spot at the center of the computer screen. The monkey had to acquire this fixation spot and maintain gaze for 450 msec. Following a 200 msec gap, a cue image was presented for 500 msec at the center of the computer screen centered in a dynamically modulating colored frame. The offset of each cue image was followed by a time gap of 1000 or 2000 msec during which only the dynamically modulating frame was visible. Subsequently a target image appeared and was visible until the monkey responded with a button press, for which a correct selection yielded a juice reward. Cues and targets were both scaled to 3 degrees of visual angle. Each image was presented at the center of the screen and their position was completely predictable. The exterior border of the colored frame was 4.5 degrees in size and its interior opening was 3 degrees in size. Each target could appear at one of four contrast levels. The progression from full to low contrast was implemented by averaging the colors of the image with the neutral gray background (from low contrast to high contrast the weightings for the image were: 0.015, 0.02, 0.1 and 1.0 -- full contrast).
The purpose of the dynamically modulating colored frame was to clearly delineate the locations of the cue and the target thus reducing spatial ambiguity and differences in spatial attention. Because our monkeys also participate in paradigms where exploratory eye movements are important variables of interest, we did not over train on the restriction of exploratory eye movements. For this experiment, we did not abort trials where the animals’ eye position left the central frame, but instead eliminated from analysis those trials in which the monkeys were not looking within the location of the colored frame at the time of the cue and target onsets.
The selectivity of IT cells presented a hurdle for our protocol. Because IT cells can be highly selective and we wished to analyze visually induced spiking activity, we created a large image set so that we could be sure to have images available that would drive any particular isolated cell. On the other hand, the need for the same image to be shown on multiple trials in multiple conditions made using a small image set desirable; otherwise we could never complete a dataset within the time constraints of a daily session. We balanced these conflicting requirements by training on a large image set and then, on test days, increasing the proportion of trials with particular images to match the response properties of the isolated cells. This selection of the images for each day was done by visually inspecting online raster plots from a preliminary passive viewing task. For analyses involving spikes (including the spike field coherence measure) we restricted ourselves to trials containing one of the images defined at the start of that day’s recording as being one of the “test” images. For the power and LFP analyses we used all available trials meeting the eye movement requirements.
Analyses
To compare the behavioral results across conditions we used an ANOVA (Trujillo-Ortiz, Hernandez-Walls, & Trujillo-Perez, 2006). Otherwise the statistical tests were randomization tests or non-parametric.
Electrophysiological comparisons used the same image for each category, i.e. cue versus target, or valid versus invalid. There were not equal numbers of trials in all groups because an imbalance in numbers was necessary for the validity effect. Additionally, the monkeys were less likely to be looking inside the colored frame for invalidly cued early trials (i.e. the cue said the target image would appear two seconds later when it actually appeared one second later). So, while there was the same number of invalid early and late trials administered there were fewer invalid early trials included in the statistical analyses.
For analysis of the power in the LFP signal we computed the absolute value of the Fourier transform and averaged over trials. To compare power between conditions we calculated the ratio at each frequency band. To compute the probability of the result we used the binomial distribution with the null hypothesis that results greater or less than one were equally probable.
The spike field coherence (SFC) was computed by taking the ratio of the power of the spike triggered average to the average of the power spectra for each of the LFP samples comprising the spike triggered average. We used spikes and LFP recorded from the same electrode (Anderson, Harrison, & Sheinberg, 2006). We analyzed spikes from the image evoked transient (75- 200 msec after image onset), with an LFP duration of 250 ms centered on the time of each spike. For graphical comparisons we plot confidence intervals for the SFC difference due to cue validity separately for each of the delay values. The confidence intervals were calculated from 1000 bootstrap samples of the SFC.
Results
The data reported are restricted to those sessions used for electrophysiological analyses. These recording sessions had at least one well isolated neuron that responded to one or more images in the set and followed several months of preliminary behavioral training. There were 26 sessions for monkey M (12,424 trials) and 15 for monkey O (3,406 trials) for a combined total of 50 neurons. The number of neurons is greater than the number of sessions because we occasionally acquired more than one neuron in a given recording session. LFP analyses are restricted to the channels with recorded spiking activity. We can therefore assert that the LFP comes from an area of IT known to contain at least one cell directly affected by at least one image in the set.
Behavioral
Both monkeys learned the response associations of the stimuli and their temporal cue values. For both monkeys their button press performance was greater than 98% across all contrast values. Table 1 shows the number of trials meeting the eye movement requirements, the percent correct, and the mean response time for both monkeys subdivided by contrast, validity and trial types.
Table 1.
Behavioral Results
| Monkey M | Monkey O | |||||||||||
|---|---|---|---|---|---|---|---|---|---|---|---|---|
| Contrast Level |
Valid Early/Late |
Invalid Early/Late |
Valid Early/Late |
Invalid Early/Late |
||||||||
| Trial Number |
Percent correct |
Mean RT (ms) |
Trial Number |
Percent correct |
Mean RT (ms) |
Trial Number |
Percent correct |
Mean RT (ms) |
Trial Number |
Percent correct |
Mean RT (ms) |
|
| 0.015 | 1304/1104 | 98/97 | 619/562 | 233/455 | 98/99 | 746/511 | 394/402 | 99/99 | 640/502 | 118/127 | 100/99 | 646/486 |
| 0.020 | 1264/1180 | 99/99 | 434/444 | 230/426 | 97/>99 | 569/419 | 359/435 | 99/99 | 546/485 | 88/111 | 100/100 | 560/472 |
| 0.100 | 1290/1227 | >99/>99 | 335/352 | 209/431 | 100/>99 | 375/351 | 419/376 | 100/>99 | 480/418 | 89/137 | 100/100 | 517/402 |
| 1.000 | 1279/1210 | 99/99 | 325/342 | 264/430 | 100/100 | 376/326 | 372/416 | 100/100 | 470/402 | 103/147 | 100/100 | 486/400 |
Since we employed only two delays an invalid cue could only “surprise” the monkey when the target appeared at the early, 1000 msec, delay. Despite the asymmetry of this design, it avoided the need to include additional longer delays (the trials were already several seconds long) or trials for which no target appears. This latter approach introduces its own difficulty because it requires rewarding the monkey for not responding or increasing the number of available button press responses. While these manipulations can be justified, we made a design decision to avoid further complicating an already difficult protocol even though it gave us only one time period for evaluating cue validity effects.
To demonstrate a validity effect we computed for each monkey a validity by delay interaction using a three way repeated measures ANOVA with the grouping factor as the date and the repeated measures as contrast level (4 levels), cue validity (valid or invalid), and trial type (early or late). Both monkeys were slower to respond to low contrast images (M: F3,75 = 170.32, p < 0.0001; O: F3,24 = 39.2, p < 0.0001) and faster to respond to the late trials (M: F1,25 = 16.93, p = 0.0004; O: F1,8 = 40.7, p = 0.0002). Both monkeys showed the expected delay validity by trial type interaction (M: F1,25 = 74.5, p < 0.0001; O: F1,8 =6.12, p = 0.04). Figure 3 shows this effect graphically with the monkeys grouped. In summary, the monkeys knew the meaning of the collection of images when they appeared as cues (inferred from the validity effect) and targets (inferred from button press accuracy).
Figure 3.

Response Times by Delay, Target Contrast, and Cue Validity. The black bars in the center of the boxes mark the median response times. Boxes show the 25 and 75% range and the 10 and 90% ranges are delimited by the whiskers. For each contrast value the invalid early trials (lighter shaded boxes, upper panel) are, on average, slower. Lower contrast images are responded to more slowly.
Differences in Temporal Context
Single cells spiked more to an image when it was a target than when it was a cue. These results are summarized in Figure 4. The upper panel shows an example neuron and panel B shows the overall spike density function for all the neurons. Thirty six of the 50 neurons had, on average, more spikes during valid, full contrast target presentations than they did for cue presentations (time period 80-200 msec after image onset; p < 0.0005 binomial). The LFP results (panel C Figure 4) corroborate and extend the spike data. To provide a statistical test for when the visually evoked LFP differed between the two conditions we subtracted one from the other to generate a difference plot and repeated this 1000 times after shuffling the condition labels. The bottom panel in Figure 4 reveals a statistically significant difference between the two conditions beginning about 100 msec following stimulus onset.
Figure 4.
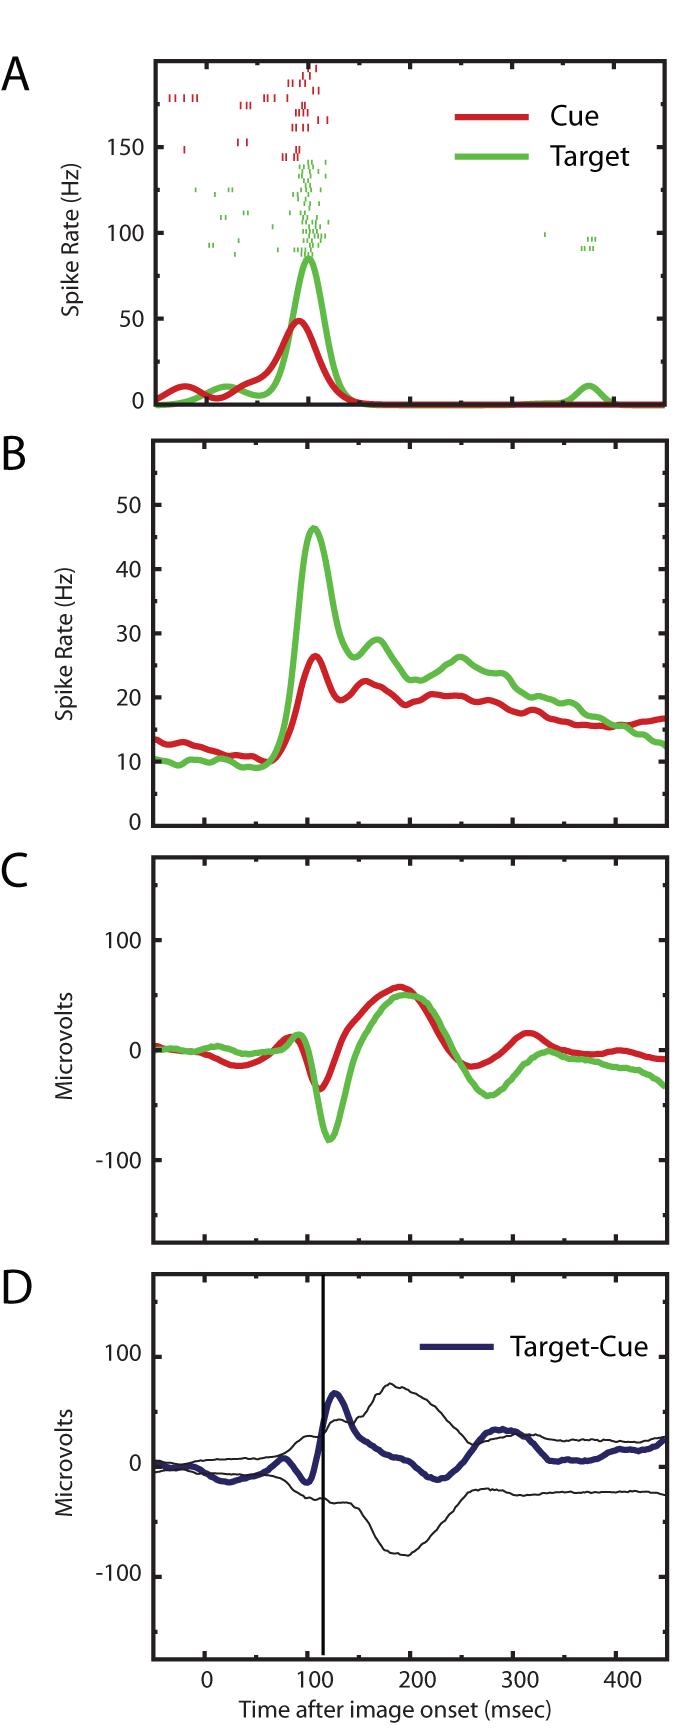
Neural Effects of Meaning. A) The raster plots for one neuron along with the spike density functions are presented divided into cue presentations and target presentations. The target trials are those when the image was validly cued and full contrast. Note the decreased number of spikes to cue presentations. B) The spike density functions for the full population of recorded cells are shown and demonstrate the consistent increases for target trials across the population. C) Shows the visually evoked LFP for the population. Note an increase in magnitude of the signal for the target presentations. D) This quantifies the probability of the difference between the two LFP traces shown in panel C. We subtracted the average LFP for target presentations from that for cue presentations (heavy blue trace). We then randomized the labels: target or cue, and repeated the average and differencing 1,000 times. The thinner lines mark the 99% confidence intervals computed from this randomization procedure. The time window when there were consistent differences in the magnitude of the LFP for cue and target presentations is marked by vertical lines.
Differences in Temporal Expectation
We observed that IT activity is affected by temporal expectation. Figure 5 provides an overview of the spike responses. There was a decrease in the number of spikes for effective images appearing at unexpected times. A detailed statistical analysis of the population response for both spikes and LFP subdivided by contrast and temporal expectation is shown in Figure 6. The significance of the difference in neural activity is computed in a sliding window and demonstrates the approximate time when differences emerge. Since our target images could only appear at one of two times, the target had to appear late if it did not appear early. Therefore, regardless of the cue value there was no uncertainty about when the target would appear unless it appeared in the early time slot (see Figure 2 for the different trial types).
Figure 5.

Effects of Temporal Attention on Spike Rate - Qualitative. This figure provides an overview of the effect of temporal attention on spike rates. Spike density functions are shown collapsed across data sets and monkeys for all early and late, validly and invalidly cued, trials where the target appeared at full contrast. Validly cued trials are shown by solid lines and invalidly cued trials by broken lines. Since there were only two time points at which images could appear, only the early, invalidly cued, trials should be unexpected. This is confirmed by the similarity of all the spike density functions except for early, invalidly cued trials which show a reduced initial transient response and a greater number of later spikes. Because some neuronal populations show delay activity, we extend the display to 450 msec before image onset (target onset occurred at time 0). There was no increase in spiking during the delay period, nor were there any differences across conditions.
Figure 6.

Effects of Temporal Attention - Detailed. This figure shows the spike density functions for neurons and evoked potentials for all contrasts (columns) and delays (rows) subdivided by cue validity. To examine the temporal evolution of these differences and to demonstrate their statistical significance we calculated a p-value for sliding data windows from -50 to 450 msec after image onset. The scale for the p-values is on the right side of each graph and is a base 2 logarithmic scale where the increment of each tick mark reflects a doubling/halving from 0.5. The upper two rows of plots show that there are consistent statistical increases in early spike numbers for validly cued early trials. The bottom two rows show analogous findings for the visually evoked LFP.
To compare these plots (Figure 6) statistically, we used the binomial cumulative distribution comparing the mean numbers of spikes for valid and invalid trials in 50 msec windows slid along in 2 msec steps for each time delay. The first window was centered at -50 msec before target image onset and the last one was centered at 450 msec post target image onset. For comparison purposes we did a similar analysis for the LFP where we used the binomial cumulative distribution function to compare the mean voltage every 2 msec beginning at -50 msec before target onset to 450 msec after target image onset.
To improve the visualization of these p-value traces (red lines in Figure 6) we used a three value moving average filter and plot the p-values on a logarithmic progression (right axes of all plots in Figure 6). There is a clear difference between the early and late trials consistent with our assertion that targets are only unexpected for the early target presentations. The early trials show significant differences between the validly and invalidly cued trials for both spiking (top two rows Figure 6) and LFP activity (bottom two rows Figure 6) beginning about 100 msec after target onset. In addition, the direction of the effect reverses for spikes later in the analysis window. That is, while there are more spikes for validly cued early trials in the time shortly after image onset, the opposite is observed later.
The data in Figure 6 also show that increasing stimulus contrast had not only had the expected effect of increasing overall response magnitude and reducing onset latency, but also decreased the time at which observed effects of expectation became significant. In the top row of Figure 6, for example, which shows effects of expectation on spiking activity, the initial valid-invalid differences reach the p < 0.01 level of significance for the high contrast condition at approximately 80ms (top right panel) whereas differences in the low contrast condition are not evident until approximately 150ms following stimulus onset (top left panel). Similar effects of contrast on latency of valid-invalid differences can also be observed in the LFP responses for the early trials (Figure 6, third row).
Because of the relatively small number of trials in some datasets it was not always possible to conduct proper statistical tests on individual neurons. However, when a dataset contained at least five valid and invalid trials shown at full contrast (n = 38 for early trials, n = 35 for late trials) the difference in spike number between 80 - 200 ms compared by a sum of ranks test was significant at the p < 0.05 level for the early trials of 10 neurons and for the late trials of only 2 neurons.
One potential advantage of the LFP signal over spikes for analyzing neural activity is that we can evaluate changes in neural processing at times when no significant spiking activity is observed. For example, if the monkey uses the cue to prepare for a visual stimulus then there should be changes in the time period when he expects a visual stimulus compared to when he does not, even if no stimulus is present at that time and despite the fact that spike rates for IT cells often do not sustain themselves during delay periods (Miller, Erickson, & Desimone, 1996).
We assessed LFP power in the time window from 525 msec after cue offset to 1025 msec after cue offset comparing trials with cues having a 1000 msec delay or a 2000 msec delay value. For this analysis we altered the eye movement requirements to require gaze to be at the center of the screen at the time immediately prior to when an early target image could have appeared.
When cues had a delay value of 1000 msec there was a ∼4/5 chance that a target would appear 1000 msec after cue offset. If a cue’s value was 2000 msec then there was only a ∼1/5 chance of the target image appearing 1000 msec after cue offset. Figure 7 shows the distribution of the power ratios. There was a broad band of significant increases in the power in the beta frequency range from 18-24 Hz for trials when a target was highly probable (4/5) versus when it was improbable (1/5) (p < 0.001).
Figure 7.

LFP Power Increases in the Beta Frequency Range for Expected Targets. The LFP power at each frequency band between DC and 80 Hz was computed for the time period 525 - 1025 msec after cue image offset and figure shows the ratio of power for the 1000 msec cue trials relative to the power for the 2000 msec cue value trials. The binomial distribution was used to calculate the probability of the fraction of neurons showing values greater than 1.0. The box and whisker plot shows the median difference value as a black line, the boxes demarcate the 25 to 75% range and the whiskers mark the 10 to 90% range. Frequency bands with a significance of p < 0.001 (binomial) are colored black. There is a broad band from 18 - 24 Hz (beta frequency range) where there is consistently greater power for trials where the expected target is imminent.
A consistent neurophysiological effect of attentional allocation in V4 has been a correlation between spiking activity and LFP (Bichot, Rossi, & Desimone, 2005; Fries et al., 2001). We compared SFC estimates across a large range of frequency bands for both the validly and invalidly cued target responses. Figure 8 plots the 99% confidence intervals for differences in the SFC for validly and invalidly cued trials. For the early trials (1000 msec delay), we found a smooth increase in coherence near the gamma frequency range for valid trials. For both sets of trials (early and late) there was a significant increase in low frequency coherence (approx. 4 Hz) for the valid trials.
Figure 8.

Spike Field Coherence. Panels A and B show the SFC for 1000 msec trials (left) and 2000 msec trials (right). Invalid trials are shown as dashed lines. Below each SFC plot we show the median (black bar) and 99% confidence intervals (gray boxes) for the difference at each frequency band between the valid and invalid conditions normalized by the SFC for the validly cued trials. The confidence intervals were computed from a bootstrap resampling with 1000 repetitions. Both target delays show changes at the low frequencies, but only the 1000 msec comparison (Panel C) shows a broad increase in the beta to gamma frequency range (32 - 40 Hz). Increases in low frequency SFC are seen for both trial types and may reflect an error signal.
Eye Movement Effects
Prior to cue onset the monkey fixated a centered spot. Prior to target onset the monkey was looking within a modulating colored frame. Therefore, there are some expected differences in the position of the eyes at the time of stimuli onset for the two time periods. The median distance from fixation to the center of the screen was slightly larger for the target period than the cue period (23 of 26 sessions) but the overall average was less than 0.1 degree of visual angle. As an additional control, all analyses were repeated for the monkey with most data by analyzing only the trials where gaze was completely within the interior of the 3 degree aperture of the colored frame for both the first 200 msec of cue presentation and the first 200 msec of target presentation. None of the basic results were altered.
One of our principal results is that early trials show differences in spiking, LFP, and SFC depending on cue validity. While all analyzed trials had the monkeys fixating within 3 degrees of screen center at the time of target image onset there remain slight differences in eye position between the valid and invalid early trials. Figure 9 (upper panel) shows the mean difference between the gaze eccentricity for valid and invalid trials subdivided by early and late types. As shown by the distribution of late trial eccentricity differences, the invalidly cued trials are accompanied by eyes positions that are slightly closer to the screen center (positive late-early trials values). We observed the opposite effect for the early trials (mean difference 0.24 degrees of visual angle). To assess the possible effect of this magnitude of difference in eye position with respect to the center of the stimulus on neural responses for those cells used in our analyses, we examined the effect on spike rates of varying fixation by this small amount (Figure 9, lower panel). We split the fixation for validly cued target presentations at the median and plot the difference in visual angle between these two subgroups. The difference in eye position is somewhat greater than that observed between invalid and validly cued early trials. However, the inset shows that there is no effect on spike rate. The distribution of the difference in the mean number of spikes per trial is centered at zero with a median of zero. This lack of an effect for small shifts of gaze is consistent with the fact that IT neurons are known to have large receptive fields. In the presence of distractor images, functional receptive field sizes for IT cells are on the order of 4-6 degrees (Mruczek & Sheinberg, 2007a). On a plain background receptive field sizes may approach 40 degrees (Rolls, Aggelopoulos, & Zheng, 2003). With a more complicated background, functional receptive field sizes are about 10 degrees (Mruczek & Sheinberg, 2007b; Rolls et al., 2003). Further, in our study images were presented at the center of a computer screen. We did not optimize the location of the images in the receptive field of the cells from which we recorded. Therefore slight shifts in position between validly and invalidly cued trials would be as likely to move the image closer to a neuron’s receptive field center as away from it.
Figure 9.

Eye Position Distributions. A. For each dataset the location of the eyes from the center of the screen at the time of image onset was calculated and the mean of the invalid trials was subtracted from the mean of the valid trials. For both trial types the difference was less than 0.5 degrees of visual angle. For early trials the eyes tended to be slightly farther from the center of the screen on invalid trials compared to valid trials (the opposite was observed for late trials), but the distance was much smaller than the size of IT visual neurons’ receptive fields. B. We created two groups of near and far trials by performing a median split of all valid trials and then compared the mean number of spikes per trial in these two groups. The inset shows that the median difference was zero, and therefore slight differences of the eyes with respect to the center of the screen do not explain the differences in spiking and LFP reported above.
Discussion
Visually selective IT neurons change their firing to preferred visual stimuli as a function of non-visual manipulations (Chelazzi, Duncan, Miller, & Desimone, 1998; Jagadeesh, Chelazzi, Mishkin, & Desimone, 2001; Sheinberg & Logothetis, 1997, 2001). Our interest was to determine how temporal context and temporal attention influenced IT neuronal activity. We found evidence that both temporal context and temporal expectancy affect neural activity in IT.
In our study, when a particular picture served as a cue to a temporal delay, it evoked smaller LFP responses and fewer spikes than when it was the guide to a button press, even though it was shown at the same size, contrast, display position, and the fixation of the eyes were similar. Therefore, the differences must reflect a difference in extra-visual properties of the stimulus, probably attention. The cue image always appeared at full contrast and its recognition did not require a speeded response, therefore the animals might have been less attentive to cue presentations than target presentations. A related explanation is motivation. In all cases the cue was a second or two more removed from reward than were the target presentations. Liu and Richmond (2000) found that monkeys were less accurate on trials when they could anticipate a longer time to reward and that this correlated to changes in the firing of perirhinal neurons. A third consideration is “meaning.” The images meant different things depending on the context: cues meant wait one or two seconds, while targets meant push left or right. If we consider it plausible that IT firing can be altered by interaction with other brain areas relevant for attention, it should be plausible that interaction with brain areas involved in the interpretation of an image’s meaning might also affect IT activity. However, what we wish to emphasize is that both cue and target presentations were important for our task to be successfully and speedily completed and that our animals’ behavior demonstrated that they learned the cue and target associations for the images. Therefore, we can conclude that IT neurons alter their responses to individual images depending on the context in which an image is viewed.
The second effect observed in our study was a change in IT neurophysiological measures as a function of temporal expectation. While a shortening of response time to forewarned stimuli is a common observation, only recently has evidence suggested that some of this benefit is due to perceptual processing and that it is not entirely due to motor response preparation (Correa et al., 2006; Correa et al., 2005). Our protocol shows an intentional similarity to the protocols used to study “attention in time” by Nobre and colleagues (Coull, Frith, Buchel, & Nobre, 2000; Doherty et al., 2005; Miniussi, Wilding, Coull, & Nobre, 1999; Nobre, 2001). Doherty et al. (2005) demonstrated a synergistic effect of temporal and spatial attention on electrophysiological measures in a task where spatial and temporal expectations could be independently manipulated. We found that visual stimuli occurring at expected times evoked more early spikes and showed a greater coherence to the underlying LFP activity. Our differences in spike counts between validly and invalidly cued target presentations for 1000 msec trials provide a single cell signature of this effect and could provide a substrate for the EEG differences observed in humans.
In addition to differences in absolute numbers of spikes, we also observed changes in how these spikes correlated to underlying background LFP activity and the LFP power. Slow wave activity has long been recognized to reflect changes in spatial attention (Heinze & Mangun, 1995). When examining activity in the frequency domain, the most common changes with spatial attention have been a decrease in alpha activity and an increase in beta activity (Vazquez Marrufo, Vaquero, Cardoso, & Gomez, 2001; Wrobel, 2000). Tallon-Baudry, et al. (2004) reported increased beta frequency band coherence in monkey IT as a correlate of correct task performance in a delayed match to sample task. Consistent with these findings, we found that the LFP showed greater power in the beta frequency range with greater temporal attention.
Changes in the SFC from spatial attentional modulation have been extensively studied in V4 (Bichot et al., 2005; Fries et al., 2001). Increases in SFC in the gamma frequency band have been consistently found when subjects attend to a relevant object feature, such as shape or color, or to a particular retinotopic location. We noted changes at slightly lower frequencies than those previously reported, but there is still substantial overlap.
Reynolds and Chelazzi (2004) hypothesize that attentional effects in the visual system are similar to changes in contrast sensitivity. We observed that lowering image contrast resulted in changes in the shape, magnitude, and onset time of neuronal spiking in visually selective IT cells and also changed the timing and magnitude of the visually evoked LFP recorded from the same area. Some of these contrast dependent changes are similar to those seen between valid and invalidly cued trials, and are reminiscent of the traces shown in Reynolds and Chelazzi (2004). Recently, Lee, Williford, & Maunsell (2007) examined the effects of attention and contrast on V4 neurons. They assessed neuronal firing latency and magnitude to odd-symmetric Gabor patches. Lee et al (2007) found strong effects of contrast on both neuronal response magnitude and latency, but they found spatial attention effects only for response magnitude. This suggests that the neuronal effects of attention and contrast may be different. An effect of stimulus contrast on response magnitude and timing is seen in our data as well (see Figure 6) and the magnitude of the changes seen with lower stimulus contrast are much greater than those seen for our manipulation of temporal attention.
A consistent finding from our SFC analysis was that the strongest difference between invalidly and validly cued trials was an increase in coherence between spikes and the LFP at frequencies in the 4 Hz range. This was the same for both the early and late trials. What is common to both conditions is that for invalid trials the image appears at the “wrong” time, even if it does not appear unexpectedly. The evoked potential recorded during time estimation tasks has been shown to alter its shape and magnitude to incorrectly estimated intervals (Holroyd & Krigolson, in press; Miltner, Braun, & Coles, 1997). We suspect that the difference in the SFC between valid and invalid trials of both early and late types may also reflect some sort of error signal in IT.
In summary, we found the magnitude of the spiking response of IT neurons was less to a visual image when it communicated a delay time than when it signaled which button to press for reward. Similarly, the magnitude of the visually evoked LFP was different across the two conditions. Expected visual stimuli resulted in more spikes and a greater coherence to the underlying LFP activity. Expectation also increased the power of the LFP in the beta frequency band. These findings suggest that IT neuronal responses to visual stimuli are modifiable by context and expectation and could participate in the perceptual differences observed behaviorally with attentional modulation in time.
Acknowledgements
This work was supported by the James S McDonnell Foundation, NIH RO1-EY014681, and NSF CRCNS 0423031.
Footnotes
Publisher's Disclaimer: This is a PDF file of an unedited manuscript that has been accepted for publication. As a service to our customers we are providing this early version of the manuscript. The manuscript will undergo copyediting, typesetting, and review of the resulting proof before it is published in its final citable form. Please note that during the production process errors may be discovered which could affect the content, and all legal disclaimers that apply to the journal pertain.
Contributor Information
Britt Anderson, Dept. of Neuroscience, Brown University*.
David L. Sheinberg, Dept. of Neuroscience, Brown University.
References
- Anderson B, Harrison M, Sheinberg DL. A multielectrode study of the inferotemporal cortex in the monkey: effects of grouping on spike rates and synchrony. Neuroreport. 2006;17:407–411. doi: 10.1097/01.wnr.0000203349.22128.e0. [DOI] [PubMed] [Google Scholar]
- Bichot NP, Rossi AF, Desimone R. Parallel and serial neural mechanisms for visual search in macaque area V4. Science. 2005;308:529–534. doi: 10.1126/science.1109676. [DOI] [PubMed] [Google Scholar]
- Booth MC, Rolls ET. View-invariant representations of familiar objects by neurons in the inferior temporal visual cortex. Cerebral Cortex. 1998;8:510–523. doi: 10.1093/cercor/8.6.510. [DOI] [PubMed] [Google Scholar]
- Carlson TA, Hogendoorn H, Verstraten FAJ. The speed of visual attention: What time is it? Journal of Vision. 2006;6:1406–1411. doi: 10.1167/6.12.6. [DOI] [PubMed] [Google Scholar]
- Chelazzi L, Duncan J, Miller EK, Desimone R. Responses of Neurons in Inferior Temporal Cortex During Memory-Guided Visual Search. Journal of Neurophysiology. 1998;80:2918–2940. doi: 10.1152/jn.1998.80.6.2918. [DOI] [PubMed] [Google Scholar]
- Correa A, Lupianez J, Madrid E, Tudela P. Temporal attention enhances early visual processing: A review and new evidence from event-related potentials. Brain Research. 2006;1076:116. doi: 10.1016/j.brainres.2005.11.074. [DOI] [PubMed] [Google Scholar]
- Correa A, Lupianez J, Tudela P. Attentional Preparation Based on Temporal Expectancy Modulates Processing at the Perceptual Level. Psychonomic Bulletin & Review. 2005;12:328. doi: 10.3758/bf03196380. [DOI] [PubMed] [Google Scholar]
- Coull JT, Frith CD, Buchel C, Nobre AC. Orienting attention in time: Behavioural and neuroanatomical distinction between exogenous and endogenous shifts. Neuropsychologia. 2000;38:808. doi: 10.1016/s0028-3932(99)00132-3. [DOI] [PubMed] [Google Scholar]
- Doherty JR, Rao A, Mesulam MM, Nobre AC. Synergistic Effect of Combined Temporal and Spatial Expectations on Visual Attention. Journal of Neuroscience. 2005;25:8259–8266. doi: 10.1523/JNEUROSCI.1821-05.2005. [DOI] [PMC free article] [PubMed] [Google Scholar]
- Fries P, Reynolds JH, Rorie AE, Desimone R. Modulation of oscillatory neuronal synchronization by selective visual attention. Science. 2001;291:1560. doi: 10.1126/science.1055465. [DOI] [PubMed] [Google Scholar]
- Ghose GM, Maunsell JHR. Attentional modulation in visual cortex depends on task timing. Nature. 2002;419:616. doi: 10.1038/nature01057. [DOI] [PubMed] [Google Scholar]
- Heinze HJ, Mangun GR. Electrophysiological signs of sustained and transient attention to spatial locations. Neuropsychologia. 1995;33:889. doi: 10.1016/0028-3932(95)00023-v. [DOI] [PubMed] [Google Scholar]
- Holroyd CB, Krigolson OE. Reward prediction error signals associated with a modified time estimation task. Psychophysiology. doi: 10.1111/j.1469-8986.2007.00561.x. in press. [DOI] [PubMed] [Google Scholar]
- Ito M, Gilbert CD. Attention modulates contextual influences in the primary visual cortex of alert monkeys. Neuron. 1999;22:593–604. doi: 10.1016/s0896-6273(00)80713-8. [DOI] [PubMed] [Google Scholar]
- Ito M, Tamura H, Fujita I, Tanaka K. Size and position invariance of neuronal responses in monkey inferotemporal cortex. J Neurophysiology. 1995;73:218–226. doi: 10.1152/jn.1995.73.1.218. [DOI] [PubMed] [Google Scholar]
- Jagadeesh B, Chelazzi L, Mishkin M, Desimone R. Learning increases stimulus salience in anterior inferior temporal cortex of the macaque. Journal of Neurophysiology. 2001;86:290–303. doi: 10.1152/jn.2001.86.1.290. [DOI] [PubMed] [Google Scholar]
- Lee J, Williford T, Maunsell JHR. Spatial attention and the latency of neuronal responses in macaque area V4. Journal of Neuroscience. 2007;27:9632–9637. doi: 10.1523/JNEUROSCI.2734-07.2007. [DOI] [PMC free article] [PubMed] [Google Scholar]
- Liu Z, Richmond BJ. Response differences in monkey TE and perirhinal cortex: stimulus association related to reward schedules. Journal of Neurophysiology. 2000;83:1677–1692. doi: 10.1152/jn.2000.83.3.1677. [DOI] [PubMed] [Google Scholar]
- Logothetis NK, Pauls J, Poggio T. Shape representation in the inferior temporal cortex of monkeys. Current Biology. 1995;5:552–563. doi: 10.1016/s0960-9822(95)00108-4. [DOI] [PubMed] [Google Scholar]
- Luck SJ, Chelazzi L, Hillyard SA, Desimone R. Neural mechanisms of spatial selective attention in areas V1, V2, and V4 of macaque visual cortex. Journal of Neurophysiology. 1997;77:24–42. doi: 10.1152/jn.1997.77.1.24. [DOI] [PubMed] [Google Scholar]
- McAdams CJ, Maunsell JH. Effects of attention on the reliability of individual neurons in monkey visual cortex. Neuron. 1999;23:765. doi: 10.1016/s0896-6273(01)80034-9. [DOI] [PubMed] [Google Scholar]
- McAdams CJ, Maunsell JH. Attention to both space and feature modulates neuronal responses in macaque area V4. Journal of Neurophysiology. 2000;83:1751–1755. doi: 10.1152/jn.2000.83.3.1751. [DOI] [PubMed] [Google Scholar]
- Miller EK, Erickson CA, Desimone R. Neural Mechanisms of Visual Working Memory in Prefrontal Cortex of the Macaque. Journal of Neuroscience. 1996;16:5154–5167. doi: 10.1523/JNEUROSCI.16-16-05154.1996. [DOI] [PMC free article] [PubMed] [Google Scholar]
- Miltner WHR, Braun CH, Coles MGH. Event-related brain potentials following incorrect feedback in a time-estimation task: Evidence. Journal of Cognitive Neuroscience. 1997;9:788. doi: 10.1162/jocn.1997.9.6.788. [DOI] [PubMed] [Google Scholar]
- Miniussi C, Wilding EL, Coull JT, Nobre AC. Orienting attention in time: Modulation of brain potentials. Brain. 1999;122:1507–1518. doi: 10.1093/brain/122.8.1507. [DOI] [PubMed] [Google Scholar]
- Motter BC. Focal attention produces spatially selective processing in visual cortical areas V1, V2, and V4 in the presence of competing stimuli. Journal of Neurophysiology. 1993;70:909–919. doi: 10.1152/jn.1993.70.3.909. [DOI] [PubMed] [Google Scholar]
- Mountcastle VB, Reitboeck HJ, Poggio GF, Steinmetz MA. Adaptation of the Reitboeck method of multiple microelectrode recording to the neocortex of the waking monkey. Journal Neuroscience Methods. 1991;36:77–84. doi: 10.1016/0165-0270(91)90140-u. [DOI] [PubMed] [Google Scholar]
- Mruczek R, Sheinberg D. Activity of inferior temporal cortical neurons predicts recognition choice behavior and recognition time during visual search. Journal of Neuroscience. 2007a;27:2825–2836. doi: 10.1523/JNEUROSCI.4102-06.2007. [DOI] [PMC free article] [PubMed] [Google Scholar]
- Mruczek R, Sheinberg D. Context familiarity enhances target processing by inferior temporal cortex neurons. Journal of Neuroscience. 2007b;27:8533–8545. doi: 10.1523/JNEUROSCI.2106-07.2007. [DOI] [PMC free article] [PubMed] [Google Scholar]
- Nobre AC. Orienting attention to instants in time. Neuropsychologia. 2001;39:1317–1328. doi: 10.1016/s0028-3932(01)00120-8. [DOI] [PubMed] [Google Scholar]
- Optican LM, Richmond BJ. Temporal encoding of two-dimensional patterns by single units in primate inferior temporal cortex. III. Information theoretic analysis. Journal of Neurophysiology. 1987;57:162–178. doi: 10.1152/jn.1987.57.1.162. [DOI] [PubMed] [Google Scholar]
- Paxinos G, Huang X-F, Toga AW. The Rhesus Monkey Brain in Stereotaxic Coordinates. Academic Press; San Diego: 2000. [Google Scholar]
- Reynolds JH, Chelazzi L. Attentional modulation of visual processing. Annual Review Neuroscience. 2004;27:611–647. doi: 10.1146/annurev.neuro.26.041002.131039. [DOI] [PubMed] [Google Scholar]
- Reynolds JH, Pasternak T, Desimone R. Attention increases sensitivity of V4 neurons. Neuron. 2000;26:703–714. doi: 10.1016/s0896-6273(00)81206-4. [DOI] [PubMed] [Google Scholar]
- Rolls ET, Aggelopoulos NC, Zheng F. The receptive fields of inferior temporal cortex neurons in natural scenes. Journal of Neuroscience. 2003;23:339–348. doi: 10.1523/JNEUROSCI.23-01-00339.2003. [DOI] [PMC free article] [PubMed] [Google Scholar]
- Schwartz EL, Desimone R, Albright TD, Gross CG. Shape recognition and inferior temporal neurons. Proceedings of the National Academy of Sciences. 1983;80:5776–5778. doi: 10.1073/pnas.80.18.5776. [DOI] [PMC free article] [PubMed] [Google Scholar]
- Sheinberg DL, Logothetis NK. The role of temporal cortical areas in perceptual organization. Proceedings of the National Academy of Sciences. 1997;94:3408–3413. doi: 10.1073/pnas.94.7.3408. [DOI] [PMC free article] [PubMed] [Google Scholar]
- Sheinberg DL, Logothetis NK. Noticing familiar objects in real world scenes: the role of temporal cortical neurons in natural vision. Journal of Neuroscience. 2001;21:1340–1350. doi: 10.1523/JNEUROSCI.21-04-01340.2001. [DOI] [PMC free article] [PubMed] [Google Scholar]
- Tallon-Baudry C, Mandon S, Freiwald WA, Kreiter AK. Oscillatory synchrony in the monkey temporal lobe correlates with performance in a visual short-term memory task. Cerebral Cortex. 2004;14:713–720. doi: 10.1093/cercor/bhh031. [DOI] [PubMed] [Google Scholar]
- Tovee MJ, Rolls ET, Azzopardi P. Translation invariance in the responses to faces of single neurons in the temporal visual cortical areas of the alert macaque. Journal of Neurophysiology. 1994;72:1049–1060. doi: 10.1152/jn.1994.72.3.1049. [DOI] [PubMed] [Google Scholar]
- Trujillo-Ortiz A, Hernandez-Walls R, Trujillo-Perez FA. RMAOV33: Three-way Analysis of Variance With Repeated Measures on Three Factors Test. 2006 A MATLAB file http://www.mathworks.com/matlabcentral/fileexchange/loadFile.do?objectId=9638.
- Vazquez Marrufo M, Vaquero E, Cardoso MJ, Gomez CM. Temporal evolution of alpha and beta bands during visual spatial attention. Cognitive Brain Research. 2001;12:315–320. doi: 10.1016/s0926-6410(01)00025-8. [DOI] [PubMed] [Google Scholar]
- Wrobel A. Beta activity: a carrier for visual attention. Acta Neurobiologiae Experimentalis. 2000;60:247–260. doi: 10.55782/ane-2000-1344. [DOI] [PubMed] [Google Scholar]