

Abstract
Trpm5 and α-gustducin are key to the transduction of tastes of sugars, amino acids and bitter compounds. This study investigated the role of these signaling proteins in the preference for fat, starch, and starch-derived polysaccharides (Polycose), using Trpm5 knockout (Trpm5 KO) and α-gustducin knockout (Gust KO) mice. In initial two-bottle tests (24 h/day), Trpm5 KO mice showed no preference for soybean oil emulsions (0.313 - 2.5%), Polycose solutions (0.5 - 4%) or starch suspensions (0.5 - 4%). Gust KO mice displayed an attenuated preference for Polycose, but their preference for soybean oil and starch was comparable to that of C57BL/6J wild-type mice (WT). Gust KO mice preferred starch to Polycose whereas WT mice had the opposite preference. Following extensive experience with soybean oil emulsions (Intralipid) and Polycose solutions, the Trpm5 KO mice developed preferences comparable to the WT mice, although their absolute intakes remained suppressed. Similarly, Gust KO mice developed a strong Polycose preference with experience but they continued to consume less than WT mice. These results implicate α-gustducin and Trpm5 as mediators of polysaccharide taste and Trpm5 in fat taste. The disruption in Polycose, but not starch preference, in Gust KO mice indicates that distinct sensory signaling pathways mediate the response to these carbohydrates,. The experience-induced rescue of fat and Polycose preferences in the KO mice likely reflects the action of a post-oral conditioning mechanism, which functions in the absence of α-gustducin and Trpm5.
Keywords: Soybean oil, Polycose, Starch, Sefa Soyate oil, Post-Oral Conditioning
Introduction
Five basic taste qualities have been identified in humans and many non-human mammals: sweet, sour, bitter, salty and umami. Two of these taste qualities, sweet and umami, play a key role in the identification of and attraction to foods rich in sugar and protein, respectively (2;7). Significant progress has been made in identifying the taste signaling elements that mediate the peripheral gustatory response to sugars and amino acids (5). These include the T1R2/T1R3 sweet receptor, the T1R1/T1R3 and mGluR4 umami receptors, the G-protein gustducin, and the Ca2+-activated cation channel Trpm5 (5). Gustducin and Trpm5 also mediate the transduction of compounds that elicit bitter taste, but not of compounds that elicit salty or sour taste qualities (6;11).
Macronutrients other than sugars and amino acids may also activate taste cells, although much less is known about the gustatory mechanisms involved. There is converging evidence from behavioral and physiological studies that the flavor of fat includes a taste component, in addition to its well recognized texture and odor components (15;19). One putative fat taste receptor is the CD36 fatty acid translocase that is found in circumvallate taste cells, where it is co-localized with α-gustducin (16). Knock-out mice with CD36 gene deletion were found to be indifferent to a fatty acid (linoleic acid) emulsion whereas wild-type (WT) mice preferred the fatty acid to the vehicle in two-bottle tests (16). CD36 KO mice, unlike WT mice, also fail to prefer a triglyceride (soybean oil) emulsion in two-bottle tests (37;38). Other data indicate that the preference of rodents for triglycerides is mediated, in part, by the free fatty acids hydrolyzed in the mouth by salivary lipase (14) and that gustatory nerve denervation attenuates fatty acid preference and detection (20;46).
Rodents and some other species also appear to have a taste for starch-derived oligo- and polysaccharides. A series of behavioral studies reported in 1987 revealed that rats are very attracted to Polycose, a mixture of polysaccharides derived from corn starch as well as other maltooligosaccharide mixtures (see reference (31)). Like their sucrose appetite, the rat’s attraction to polysaccharides appears to be unlearned since it is displayed by neonatal rats without prior experience with these saccharides (49). Furthermore, Polycose and sucrose elicit distinct taste percepts as indicated by the lack of cross-generalization between Polycose- and sucrose-conditioned taste aversions (21;30). These and other findings suggested that different receptors mediate the tastes for polysaccharides and sugar (41;42). Consistent with this view, sweet taste inhibitors differentially affect the gustatory nerve response to Polycose and sucrose (30;45), selective gustatory nerve transection differentially attenuates Polycose and sucrose preferences (50), and lingual stimulation with Polycose and sucrose elicits different neural response patterns in the nucleus of the solitary tract (10). Rodents also display preferences for pure corn starch presented as a powder or a liquid suspension (43). It was initially thought that starch preference is mediated by maltooliogosaccharides hydrolyzed in the mouth by salivary amylase, which stimulate polysaccharide taste receptors (31). However, subsequent work indicated that starch and Polycose have distinctive “tastes” to rats (23;34;43) and starch preference persists in desalivated rats (22).
The present study examined the role of gusducin and Trpm5 in the preference for and acceptance of fat and non-sweet carbohydrates, using knockout mice lacking either gustducin’s α-subunit (α-gustducin) or Trpm5 (henceforth, Gust KO or Trpm5 KO mice, respectively). These mice display attenuated preferences for sugars and amino acids in two-bottle preference tests (6;28;29), but their preference for fat, starch and starch-derived polysaccharides had not been investigated. Gust KO, Trpm5 KO and C57BL/6J wild-type (WT) mice were compared in a series of two-bottle choice tests using soybean oil emulsions, Polycose solutions and starch suspensions. In addition, choice tests were conducted with non-nutritive oil emulsions (Sefa Soyate) and sweeteners (saccharin, sucrose) to determine the specificity of the “taste” preference deficits of KO mice. Both unlearned and learned preference (relative intake) and acceptance (absolute intake) were evaluated (33). Initially, nutrient intakes were evaluated in two-bottle choice tests using dilute concentrations which minimize post-oral conditioning effects. Soybean oil and Polycose intakes were then measured at higher concentrations with documented post-oral reinforcing actions followed by additional tests at very low concentrations. Recent studies demonstrate that experience with the post-oral actions of soybean oil and Polycose, as well as sucrose, condition strong flavor preferences in WT mice (35;36;39;40). Whether similar nutrient experiential effects are obtained in Gust KO and Trpm5 KO mice is of interest given reports that these taste signaling proteins are localized in the gastrointestinal tract as well as in the oral taste cells (1;13;27;53). Thus, post-oral as well as oral sensory responses to nutrients may be compromised in Gust KO and Trpm5 KO mice.
Methods
Subjects
Trpm5 KO mice (male, n=6, female, n=4) and Gust KO mice (male, n=6, female, n=4) developed on a C57BL/6J background at the Mount Sinai School of Medicine were used (6;12). The targeted mutation for the Trpm5 KO is on the isogenic B6 background, having been generated in C57BL6 embryonic stem (ES) (Bruce 4) cells (6;12). The Gust KO mice, homozygous null for the Gnat3 allele, were created using homologous recombination in 129/Sv background ES (W9.5) cells and genotyped as previously described (52). They were backcrossed eight times to C57BL/6J, and heterozygous Gnat3 +/-mice from the last backcross generation were used to establish the experimental colony. The estimated C57BL/6J contribution to the background of this B6/129 mixed strain is >99.6%. C57BL/6J wild-type mice (WT; male, n=8, female n=8) were obtained from the Jackson Laboratory (Bar Harbor, ME). The mice were individually housed in tub cages in a vivarium maintained on 12:12 h light-dark cycle and at 22 °C. The animals had ad libitum access to laboratory chow (5001, PMI Nutrition International, Brentwood, MO). The Trpm5 KO, Gust KO, and WT mice were 69 - 84, 61-79 and 75 days old, respectively, at the start of testing. Experimental protocols were approved by the Institutional Animal Care and Use Committee at Brooklyn College and were performed in accordance with the National Institutes of Health Guidelines for the Care and Use of Laboratory Animals.
Test Fluids and Intake Measures
The test fluids used in the various two-bottle tests are listed in Table 1; all fluids were prepared with deionized water and served at room temperature. Sweetener solutions were prepared using 0.2% saccharin (sodium saccharin, Sigma Chemical Co., St. Louis, MO) and a 0.2% saccharin + 2% sucrose (Domino Sugar, Domino Foods, Yonkers, NY) mixture. Polycose (Ross Laboratories, Columbus, OH) solutions were prepared at concentrations of 0.125% to 32%. Starch suspensions (0.5 - 4%) were prepared using corn starch (ACH Foods, Memphis, TN) and 0.3% xanthan gum (Sigma) as the suspending agent. A 2% Polycose gum suspension was also prepared.
Table 1.
Test solutions and emulsions
| Test | Emulsions/Solutions | Concentrations |
|---|---|---|
| 1 | Saccharin vs. water | 0.2% w/w |
| Saccharin + sucrose vs. water | 0.2% + 2% w/w | |
| 2 | Soybean oil vs. Emplex vehicle | 0.313, 0.625, 1.25, 2.5% w/w |
| 3 | Sefa Soyate oil vs. Emplex vehicle | 0.313, 0.625, 1.25, 2.5% w/w |
| 4 | Polycose vs. water | 0.5, 1, 2, 4% w/w |
| 5 | Corn starch vs. gum vehicle | 0.5, 1, 2, 4% w/w |
| 6 | Polycose vs. corn starch in gum | 2% w/w |
| 7 | Intralipid vs. water | 0.313, 0.625, 1.25, 2.5, 5, 10, 20% v/v |
| 8 | Intralipid vs. water | 0.039, 0.078, 0.156, 0.313, 0.625, 1.25, 2.5% v/v |
| 9 | Polycose vs. water | 0.5, 1, 2, 4, 8, 16, 32% w/w |
| 10 | Polycose vs. water | 0.125, 0.25, 0.5, 1, 2, 4, 8, 16, 32% w/w |
Gum vehicle = 0.3% xanthan gum
Emplex vehicle = 0.15% sodium stearoyl lactylate
Soybean oil (Crisco oil, J.M. Smucker, Orrville, OH) emulsions were prepared at concentrations of 0.313 - 2.5% using water and 0.15% Emplex (sodium stearoyl lactylate, Caravan Ingredients, Lenexa, KS). The mixture was homogenized (Ultra-Turrax T25, IKA-Works, Cincinnati, OH) at high speed for 5 min and further processed in a microfluidizer (Microfluidics, Newton, MA). A similar procedure was used to prepare non-nutritive oil emulsions (Sefa Soyate, Proctor & Gamble, Cincinnati, OH). Sefa Soyate consists of sucrose esters of fatty acids made from partially hydrogenated soybean oil and is the precursor of olestra used in human food products. The oil emulsions were not completely stable over 24 h and analysis of the 2.5% emulsion indicated that the oil concentration at the bottom of the drinking tube (the fluid available to the animals) had declined to approximately 1.8% at 24 h. Soybean oil was also presented in the form of a stable emulsion using 20% Intralipid (Baxter, Deerfield, IL) which contains 20% soybean oil, 2.25% glycerol and 1.2% egg yolk phospholipids (36). The 20% Intralipid was used at full strength and was also diluted with water to produce emulsions that contained 0.039 - 10% soybean oil. These diluted versions are referred to as 0.039 - 10% Intralipid. Note that B6 mice prefer Intralipid to soybean oil emulsions prepared using the procedures of the present study (Sclafani, unpublished observations). This may be related to the different non-oil constituents of the two emulsions (glycerol, egg yolk phospholipids, Emplex) or to possible differences in fat particle sizes.
Fluid preferences were compared to a vehicle solution containing deionized water, 0.15% Emplex, or 0.3% xanthan gum as indicated in Table 1. All test fluids, except the Intralipid emulsions, were prepared on a w/w basis because solution intakes were recorded by weight. Because 20% Intralipid is formulated on a v/v basis, lower concentrations were also prepared v/v. However, Intralipid intakes were measured by weight and caloric intakes were calculated accordingly (the caloric density of 20% Intralipid is 2.0 kcal/ml or 2.03 kcal/g).
Test fluids were presented in 50 or 80 ml plastic tubes and were available through a stainless steel sipper spout with a 1.5 mm opening designed for mice (Ancare, Bellmore, NY). The drinking tubes were placed on the top of the tub cage to the right of the feeder. Fluid intakes were measured to the nearest 0.1 g by weighing the drinking tubes on an electronic balance interfaced to a laptop computer; the weights were automatically entered into a spreadsheet. Spillage was estimated daily by recording the change in weight of two drinking tubes that were placed on an empty cage; one tube contained that day’s test solution, the other tube contained the vehicle. The spillage from these tubes averaged 0.2 - 0.3 g/tube/day and intake measures were corrected by this amount. To eliminate the possibility that the mice might acquire preferences for sipper spouts associated with specific nutrient solutions (see (8)), the sipper spouts were assigned to a side rather than a fluid. The left-right positions of the test fluids alternated daily.
Procedure
The mice were adapted to the laboratory for several weeks and were then given a series of two-bottle preference tests with the various test fluids as outlined in Table 1. Except where noted, the test fluids were presented in order of increasing concentration, each concentration was presented for 2 consecutive days, and between each test series the mice were given two-bottle access to deionized water for 3 or more days. The solutions were available 23 h/day and the bottles were weighed, cleaned and refilled during the remaining hour.
The mice were first given two-bottle sweetener tests (Test 1) to confirm the reduced sweet taste preferences of the Trpm5 KO and Gust KO mice relative to WT mice. Initially they were given the choice of 0.2% saccharin vs. water and were then given the choice of 0.2% saccharin + 2% sucrose mixture vs. water; the saccharin + sugar mixture is very palatable to rodents (44). Next, the mice were given preference tests using nutritive and non-nutritive oil emulsions at concentrations of 0.313 - 2.5%. In Test 2 the choice was between soybean oil vs. vehicle (Emplex) and in Test 3 the choice was between Sefa Soyate oil vs. vehicle. The mice were then given carbohydrate preference tests using Polycose vs. water (Test 4) and starch vs. gum vehicle (Test 5) at 0.5 - 4% concentrations. In Test 6 the animals were offered 2% starch vs. 2% Polycose, both presented in gum; the rationale for this test is described in the Results.
The next test series examined preferences for low to high concentrations of Intralipid and Polycose. The mice were tested twice with each nutrient to reveal experiential effects on their fat and carbohydrate preferences. Test 7 involved a choice between Intralipid vs. water at concentrations of 0.313 - 20%. In Test 8 a lower range (0.039 - 2.5%) of Intralipid concentrations was used to reveal possible genotype differences in fat taste sensitivity. In Test 8 the choice test involved Polycose at concentrations of 0.5% to 32%. Test 9 expanded the concentration range from 0.125% to 32% because it was expected based on prior work (35) that the mice would show enhanced preferences for dilute Polycose solutions.
Statistical Analysis
Fluid intakes were averaged over the two days at each solution concentration. Intakes were expressed as g intake per 30 g body weight per day using body weight averages for each mouse based on the weights obtained before and after each test series. This accounted for the body weight differences between male and female mice. Intralipid and Polycose intakes were also expressed as kcal/30 g bw/day. Taste preferences were expressed as percent intakes (solution intake/total intake × 100). Between strain differences were assessed using repeated measures analysis of variance (genotype × concentration). Following a significant genotype effect, separate analyses compared each KO genotype with the B6 WT mice; significant interaction effects were evaluated using simple main effects tests at each concentration according to Winer (51). The significance of the fluid preference at each concentration was evaluated for each strain by comparing test fluid intake vs. vehicle intake using paired t-tests. To control for the multiple comparisons, the α level (0.05 prior to correction) for the t-tests was corrected with the Bonferroni procedure that yielded a critical level of statistical significance that depended upon the number of concentrations within a test series. Sex differences in fat and carbohydrate intake were not analyzed because of the small group sizes (n=4 or 6) in the two KO groups.
RESULTS
At the start of the study, the WT mice weighed less than did the Trpm5 KO and Gust KO mice, which were comparable (19.9 vs. 23.1 vs. 22.1 g) (F(2,33) = 6.98, P < 0.01). At the end of the study, the body weights of the three genotypes did not differ significantly (25.4 vs. 27.3 vs. 28.8 g). The water intakes of the WT, Trpm5 KO and Gust KO mice prior to the first preference test were similar (8.2, 8.8, 9.0 g/30 g bw/day).
Test 1: Sweetener vs. water
In the choice test with the sweetener solutions vs. water (Figure 1), the WT mice consumed substantially more sweet solutions than did the Gust KO mice which, in turn, drank more than did the Trpm5 KO mice (F(2,33) = 119.66, P < 0.001). The genotype differences were greater with the saccharin + sucrose than with the saccharin solution (Genotype × Solution interaction, F(2,33) = 29.48, P < 0.001). The genotypes also differed in their sweetener preference: the WT mice showed near-total preferences, the Gust KO mice showed weaker, but significant preferences, and the Trpm5 KO mice showed no preferences for the sweet solutions (F(2,33) = 287.98, P < 0.001).
Figure 1.
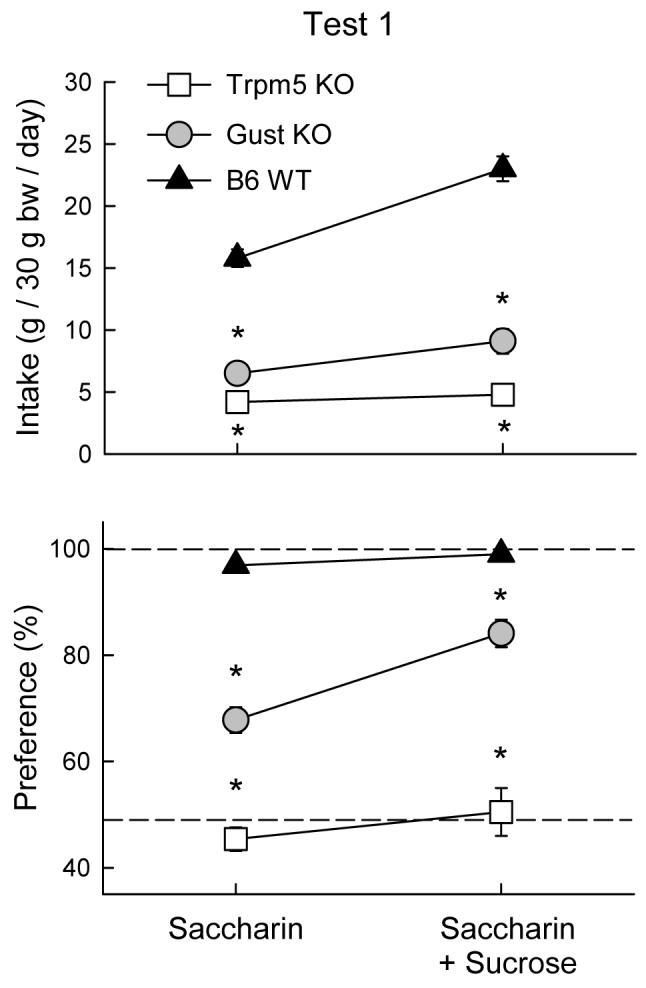
Intake (mean ± SEM) of 0.2% saccharin and 0.2% saccharin + 2% sucrose solutions (top panel) and percent preference for sweetener solutions over water (bottom panel) in Trpm5 KO, Gust KO, and B6 WT mice during two-bottle sweetener vs. water tests. Intakes of water are not shown. Significant (P < 0.05) differences between KO and WT genotypes are indicated by an asterisk (*).
Test 2: Soybean oil vs. vehicle
Figure 2 presents the results of the soybean oil vs. vehicle test. Overall, the Gust KO mice consumed more oil than the WT mice which, in turn, consumed substantially more than did the Trpm5 KO mice (F(2,33) = 28.81, P < 0.001). The group differences increased with concentration and were significant at the 1.25% and 2.5% concentrations (Genotype × Concentration, F(6,99) = 32.08 P < 0.001). The WT and Gust KO mice displayed similar preferences for the soybean oil which increased with concentration and which were greater than that of the Trpm5 KO mice (Genotype × Concentration, F(6,99) = 8.01 P < 0.001). Within group analyses revealed that WT mice and Gust KO mice consumed more (P < 0.05) soybean oil than vehicle at 0.313 - 2.5% and 0.625% - 2.5% concentrations, respectively. The Trpm5 KO mice, in contrast did not consume significantly more oil than vehicle at any concentration although their percent oil intake increased somewhat at the 2.5% concentration.
Figure 2.

Intake (mean ± SEM) of oils (top panels) and percent preference for oils over vehicle (bottom panels) in Trpm5 KO, Gust KO, and B6 WT mice during oil vs. vehicle two-bottle choice tests. Intakes of the vehicle are not shown. Left panels: Soybean oil intakes in Test 2. Right Panels: Non-nutritive Sefa Soyate oil intakes in Test 3. Significant (P < 0.05) differences between KO and WT genotypes are indicated by an asterisk (*).
Test 3: Sefa Soyate oil vs. vehicle
In the preference tests with the non-nutritive Sefa Soyate oil (Figure 2), the Gust KO and WT mice consumed similar amounts which increased with concentration and they consumed more oil than did the Trpm5 mice at the 1.25% and 2.5% concentrations (Genotype × Concentration, F(6,99) = 6.83, P < 0.001). The oil preferences of the Gust KO and WT mice were also similar, increased with concentration, and were much greater than that of Trpm5 KO mice (Genotype × Concentration, F(6,99) = 2.83, P < 0.001). The Gust KO and WT mice preferred Sefa Soyate to vehicle at all concentrations whereas the Trpm5 KO mice did not consume more oil than vehicle at any concentration.
Test 4: Polycose vs. water
As illustrated in Figure 3, the WT mice consumed substantially more Polycose than did the Gust KO and Trpm5 KO mice, which did not differ in their solution intakes (F(2,33) = 52.77, P < 0.001). Only the WT mice increased their Polycose intake as concentration increased and they consumed more solution than did the two KO genotypes at 1 - 4% concentrations (Group × Concentration, F(6,99) = 18.15, P < 0.001). The Polycose preference of the WT mice exceeded that of the KO mice at all concentrations although in this case, all three genotypes increased their preference as concentration increased (Group × Concentration, F(6,99) = 3.16, P < 0.001). The WT mice consumed more (P < 0.05) Polycose than water at all concentrations. In contrast, the Polycose and water intakes of the Gust KO mice differed only at 4% and did not significantly differ at any concentration for the Trpm5 KO mice.
Figure 3.

Intake (mean ± SEM) of carbohydrates (top panels) and percent preference for carbohydrate over vehicle (bottom panels) in Trpm5 KO, Gust KO, and B6 WT mice during carbohydrate vs. vehicle two-bottle choice tests. Intakes of the vehicle are not shown. Left panels: Polycose solution intakes in Test 4. Right panels: Starch suspension intakes in Test 5. Significant (P < 0.05) differences between KO and WT genotypes are indicated by an asterisk (*).
Tests 5 and 6: Starch and Polycose
Figure 3 shows that when given the choice between the starch suspension and gum vehicle, WT and Gust KO mice consumed similar amounts of starch and increased their intake with concentration. The Trpm5 KO mice, in contrast, did not change their starch intake during the test and consumed less of 1 to 4% starch than did WT and Gust KO mice (Group × Concentration, F(6,99) = 8.35, P < 0.001). In addition, starch preference of the WT and Gust KO mice exceeded that of the Trpm5 mice at all concentrations (Group × Concentration, F(6,99) = 7.12, P < 0.001). The starch preferences of the WT and Gust KO mice did not significantly differ. The WT mice consumed more starch than vehicle at all concentrations whereas the difference was significant at 1 - 4% concentrations for the Gust KO mice. The Trpm5 KO mice, in contrast, were indifferent to starch.
The relatively strong starch preference displayed by the Gust KO mice contrasts with their weak Polycose preference displayed in Test 4. Conceivably, the experience of the Gust KO mice with the post-oral effects of Polycose in Test 4 may have conditioned a general preference for carbohydrates which was expressed in the starch vs. vehicle test. It is also possible that the gum vehicle used in the starch test enhanced the carbohydrate preference of the Gust KO mice. To determine if their starch preference was specific to starch or related to the gum vehicle, in Test 6 the mice were given the choice between 2% starch and 2% Polycose both suspended in gum. As illustrated in Figure 4, the Gust KO mice consumed much more (P < 0.05) starch than Polycose whereas the WT mice consumed much more (P < 0.05) Polycose than starch; the Trpm5 KO mice, in contrast were indifferent to the carbohydrates (Group × Stimulus, F(6,99) = 57.78, P < 0.001). The different carbohydrate choices of the Gust KO, WT, and Trpm5 KO mice are reflected by their percent Polycose intakes of 13%, 93%, and 57%, respectively, (F(2,33) = 146.47, P < 0.001).
Figure 4.
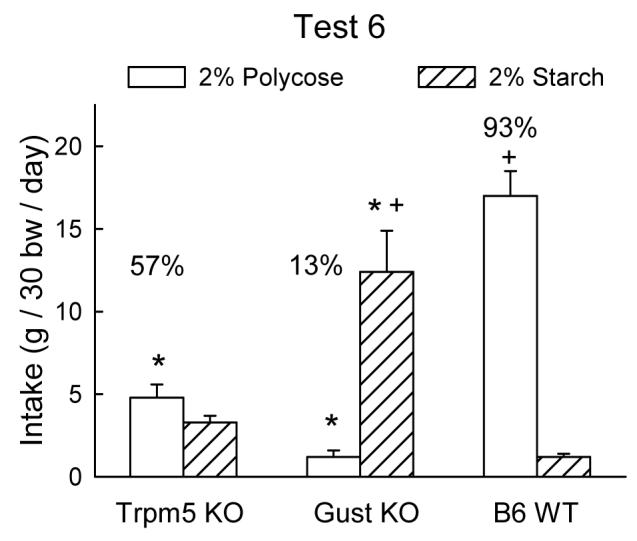
Intake (mean +SEM) of 2% Polycose vs. 2% starch in Trpm5 KO, Gust KO, and B6 WT mice during two-bottle choice test. Significant (P < 0.05) differences between KO and WT genotypes are indicated by an asterisk (*); significant (P < 0.05) differences between Polycose and starch intake indicated by plus sign (+). Numbers atop bar represent percent Polycose intake.
Tests 7 and 8: Intralipid vs. water
When offered soybean oil in the form of Intralipid in Test 7, the genotypes differed in their intake and preference as illustrated in Figure 5. The Gust KO and WT mice consumed nearly identical amounts of the oil emulsion and significantly more than did the Trpm5 KO mice at 0.313 to 2.5% concentrations (Group × Concentration, F(12,198) = 16.78, P < 0.001). All genotypes increased and then decreased their Intralipid intake as concentration increased (F(6,198) = 127.61, P < 0.001). Intralipid calorie intake, however, increased monotonically with oil concentration and the Trpm5 KO mice consumed less than did the Gust KO and WT mice at 1.25% to 20% concentrations (Group × Concentration, F(12,198) = 6.86, P < 0.001). The Gust KO and WT mice displayed near total preferences for all Intralipid solutions whereas the Trpm5 KO mice had lower preferences for the 0.313 - 2.5% Intralipid emulsions (Group × Concentration, F(12,198) = 26.57, P < 0.001). It was only at the 2.5% and higher concentrations that the Trpm5 KO mice consumed more Intralipid than water.
Figure 5.

Intake (mean ± SEM) of Intralipid emulsion (top panels), percent preference for Intralipid over water (middle panels) and Intralipid calories consumed (bottom panels) in Trpm5 KO, Gust KO, and B6 WT mice during two-bottle Intralipid vs. water choice tests. Water intakes are not shown. Significant (P < 0.05) differences between Trpm5 KO and WT genotypes are indicated by an asterisk (*).
Because the genotypes did not differ in their preferences for the concentrated Intralipid emulsions (5 - 20%) in Test 7, they were offered a lower range of oil concentrations to reveal possible differences in Intralipid sensitivity in Test 8. As indicated in Figure 5, the three genotypes displayed comparable preferences for Intralipid at 0.078 - 2.5% concentrations and differed only at the 0.039% concentration (Group × Concentration, F(12,198) = 2.26, P < 0.05). Surprisingly, of the three genotypes the Trpm5 KO mice displayed the strongest preference at the lowest concentration although specific between group differences were not significant. The three genotypes consumed more Intralipid than water at all concentrations tested. Intralipid emulsion intakes did not differ at lower concentrations (0.039 - 0.313%) but the Trpm5 KO mice consumed less emulsion than did the WT mice at the higher concentrations (0.625 - 2.5%) as in Test 7 (Group × Concentration, F(12,198) = 15.61, P < 0.001). The Trpm5 KO mice also consumed fewer Intralipid calories than did the WT mice at the 1.25% and 2.5% concentratons (Group × Concentration, F(12,198) = 10.56, P < 0.001). Note, though, that the Trpm5 KO mice consumed more 2.5% Intralipid in Test 8 than 7 (26.8 vs. 18.0 g/30 g bw/day) and their emulsion acceptance, relative to the WT mice, increased from 41% to 66%.
Tests 9 and 10: Polycose vs. Water
Figure 6 summarizes the results of the last two tests in which mice were offered a wide range of Polycose solutions. In Test 9 the genotypes differed in their Polycose intakes and preferences. Overall, the WT mice consumed more Polycose than the Trpm5 KO mice which in turn consumed more than the Gust KO mice ( F(2,33) = 23.27, P < 0.001) and these differences were most pronounced at the intermediate concentrations (4 - 16%; Group × Concentration, F(12,198) = 15.15, P < 0.001). As in the case of Intralipid, Polycose solution intake increased and then decreased as concentration increased whereas Polycose calorie intake only increased (F(6,198) = 568.75, P < 0.001). Overall, the WT mice consumed more Polycose calories than did the Trpm5 KO mice which consumed more than the Gust KO mice with the differences being significant at 4 - 32% concentrations as indicated in Figure 6 (Group × Concentration, F(12,198) = 10.83, P < 0.001). Polycose preferences were also higher in the WT mice than the KO mice at the lower but not higher concentrations as shown in Figure 6 (Group × Concentration, F(12,198) = 14.66, P < 0.001). The WT mice consumed more (P < 0.05) Polycose than water at all concentrations whereas the difference was significant only at the 8% and higher concentration for the Trpm5 KO and Gust KO mice.
Figure 6.

Intake (mean ± SEM) of Polycose solutions (top panels), percent preference for Polycose over water (middle panels) and Polycose calories consumed (bottom panels) in Trpm5 KO, Gust KO, and B6 WT mice during two-bottle Polycose vs. water choice tests. Water intakes are not shown. Significant (P < 0.05) differences between KO and WT genotypes are indicated by an asterisk (*).
In Test 10, the mice were given an extended range of Polycose concentrations. Overall, the WT mice consumed more Polycose solution than the Trpm5 KO and Gust KO mice (F(2,33) = 6.94, P < 0.01) with the difference being significant (P<0.05) at 0.5 to 8% concentrations (Group × Concentration, F(16,264) = 6.55, P < 0.01). The genotypes also differed in Polycose calorie intake (WT > Trpm5 KO = Gust KO) (F(2,33) = 7.02, P < 0.01) with the differences being significant at 4 to 32% concentrations (Group × Concentration, F(16,264) = 4.80, P < 0.01). In terms of their Polycose preference, the WT displayed stronger preferences at the 0.125 - 1% concentrations as shown in Figure 6 (Group × Concentration, F(16,264) = 10.83, P < 0.001). The WT mice consumed more (P < 0.05) Polycose than water at all concentrations tested whereas the KO mice consumed more (P < 0.05) Polycose than water at 0.5% and higher concentrations.
DISCUSSION
In agreement with prior studies (6;7;29;54), the Gust KO and Trpm5 KO mice displayed either attenuated or no preference for sweeteners. The new findings reported herein are that Gust KO and Trpm5 KO mice display distinct deficits in their preference for and acceptance of nutritive and non-nutritive oils, Polycose and starch. Fat and/or carbohydrate preferences were significantly enhanced, however, after the KO mice consumed concentrated soybean oil emulsions and Polycose solutions. This was likely due to the post-oral reinforcing actions of these nutrients. Yet, the experienced Trpm5 KO and Gust KO mice consumed less of the concentrated fat and/or carbohydrate sources than did the WT mice, indicating that α-gustducin and Trpm5 proteins contribute to fat and carbohydrate acceptance.
Oil Preference and Acceptance
The Gust KO and Trpm5 KO mice differed substantially in their preference for nutritive and non-nutritive oil emulsions. Gust KO mice were similar to WT mice in displaying significant preferences for 0.625 - 2.5% soybean oil emulsions and actually consumed more of the two highest concentrations than did the WT mice in Test 2. The two genotypes also showed comparable preferences for and intakes of the non-nutritive Sefa Soyate oil emulsions. Although their preferences for the 1.25% and 2.5% nutritive and non-nutritive oils were identical, the Gust KO and WT mice consumed substantially more soybean oil than Sefa Soyate oil. This can be attributed in part to the more palatable flavor of the soybean oil; WT mice prefer dilute emulsions of soybean oil to Sefa Soyate oil (37). In addition, at the 2.5% concentration soybean oil has post-oral reinforcing actions that stimulate consumption as revealed in intragastric (IG) infusion studies (37;40). Note that the Sefa Soyate oil preferences in Test 3 were likely enhanced by the prior experience of the mice with soybean oil in Test 2. The Sefa Soyate oil preferences displayed by the B6 mice in Test 3 were greater than those observed in a parallel study in which B6 mice were tested with the non-nutritive oil first followed by the nutritive oil (37).
In contrast to Gust KO and WT mice, the Trpm5 KO mice were essentially indifferent to the soybean oil emulsion in Test 2. Similar results were recently observed with CD36 KO mice (37) which suggests that Trpm5 is part of the signaling pathway activated by the CD36 fatty acid binding protein in taste cells. The robust oil preference of the Gust KO mice, in contrast, indicates that this G-protein does not mediate fat taste, despite its co-localization with CD36 in circumvallate taste bud cells (16). Trpm5 KO mice were indifferent to the non-nutritive Sefa Soyate oil. CD36 KO mice also failed to prefer non-nutritive oil emulsions in initial tests. This was unexpected: we assumed that KO and WT mice would show similar ingestive responses to the non-nutritive oil based on its textural properties. Sefa Soyate consists of free fatty acids attached to a sucrose core and it is possible that the free fatty acid tails bind with CD36 and stimulate taste cells to some degree.
When subsequently tested with soybean oil in the form of Intralipid in Test 7, the Gust KO and WT mice continued to display identical preference and acceptance responses, while the Trpm5 KO were again indifferent to the dilute oil emulsions. However, at 2.5% and higher concentrations the Trpm5 KO mice displayed significant preferences for Intralipid that eventually equalled those of the other genotypes. Yet, the Trpm5 KO consumed less 1.25 - 20% Intralipid, expressed in kcal/day, than did the Gust KO and WT mice. After their experience with the concentrated emulsions, the Trpm5 KO mice displayed significant preferences in Test 8 for low to high Intralipid concentrations and were similar to the other genotypes on this measure. The Trpm5 KO mice continued, however, to underconsume the more concentrated Intralipid emulsions (0.625% - 2.5%) relative to the other genotypes in Test 8. The experience-induced enhancement in soybean oil preference displayed by the Trpm5 KO mice is comparable to that observed in CD36 KO mice (37). It is likely that both genotypes developed a robust preference for the flavor (texture, odor) of the oil emulsion as they associated it with the post-oral reinforcing actions of the soybean oil. Direct evidence for this conditioning process was obtained in CD36 KO mice; they learned to prefer a flavored solution (CS+, e.g., grape-saccharin) that was paired with IG infusions of Intralipid over an alternate flavor (CS-, e.g., cherry-saccharin) that was paired with IG water infusions (37).
While repeated testing with soybean oil fully “rescued” the deficient oil preference of the Trpm5 KO mice, it only partially rescued oil acceptance in the same mice. Similar findings were obtained in studies of CD36 KO and WT mice as well as with B6 (C57BL/6J) and 129 (129P3/J, 129X1/SvJ) inbred mouse strains (36;37). In an initial test with Intralipid (0.313 - 20%), 129 mice displayed significantly reduced oil preference and acceptance at low concentrations (0.313 to 2.5 or 5%) compared to B6 mice. In a second test, the same mice showed robust preferences (>89%) at all Intralipid concentrations, but the 129 mice still underconsumed the oil at the 0.313 - 2.5% concentrations (36). As discussed below, this differential effect of prior experience on nutrient preference and acceptance is characteristic of the post-oral conditioning effects of nutrients.
The experience-induced increase in preference for soybean oil in the Trpm5 KO mice is quite remarkable. For instance, the percent preference for 0.313% oil increased from 51% in Test 2 to 67% in Test 7 and then 97% in Test 8. The WT mice also displayed an enhancement in their soybean oil preference with experience. In a prior study B6 mice increased their preference for 0.313% Intralipid from 84% in their first test to 96% in their second test (after being exposed to 0.313% - 20% in their first test) (36). In another recent study (17), naive B6 mice offered a wide range of Intralipid solutions (0.00001 - 5%) preferred 0.5% but not 0.1% Intralipid whereas the experienced B6 mice in the present study preferred the lowest concentration offered (0.039%). The sensitivity to very dilute oil emulsions observed in rats and mice may be related, in part, to fatty acid detection by taste cells (14), but this does not account for all findings. In particular, CD36 KO (37) and Trpm5 KO mice, which presumably have a reduced or absent taste sensitivity to fatty acids, show experience-induced enhancements in soybean oil preference. In addition, in two-bottle tests oil-naive or experienced B6 mice did not prefer linoleic acid to soybean oil at low concentrations (0.0025 - 0.5%; unpublished observations). Olfaction may have an important role in oil detection as experimentally-induced anosmia blocks or attenuates corn oil preference at low concentrations (0.5 - 1%) in rats and mice (26;47). Olfaction may be particularly important in the experience-induced enhancement in oil preference observed in KO mice.
In the present study nutrient experience effects were evaluated by comparing the initial and subsequent preference responses of the same groups of mice. A potential limitation of this approach is that factors such as age and repeated exposure to two-bottle testing may influence the preference responses of mice. However, it is unlikely that these factors account for the major changes in nutrient preferences displayed by the KO mice with repeated testing. In general age has relatively little effect on taste preferences in B6 and 129 mice (48) and prior experience with two-bottle testing with one nutrient (Intralipid) was found to have relatively little effect on subsequent two-bottle tests with another nutrient (sucrose) in B6 and 129 mice (36).
Polycose Preference and Acceptance
Whereas the Gust KO mice were similar to WT mice in their preference for soybean oil, they were similar to the Trpm5 KO mice in their absent or reduced preference for dilute Polycose solutions (0.5 - 4%) in Test 4. Both KO genotypes started to develop a Polycose preference at the 4% concentration, although they consumed substantially less (75%) than did the WT mice. When offered Polycose in Test 9, the KO mice continued to show weak preferences for 0.5 - 4% Polycose solutions but displayed near-total preferences at the higher concentrations. When retested with a wide range of concentrations (Test 10), the KO mice now significantly preferred Polycose starting at 0.5% and were indistinguishable from the WT mice in their strong preferences (> 95%) for 2 - 32% Polycose. Yet, the Gust KO and Trpm5 KO mice still consumed less Polycose than did WT mice at 2 - 32% concentrations. For example, whereas the Gust KO mice increased their preference for 4% Polycose from 73% in Test 4 to 99% in Test 9, they only increased their relative acceptance of the 4% Polycose solution from 26% to 57% (absolute intake relative to the WT mice).
The results of these multiple tests indicate that α-gustducin and Trpm5 are critical taste signaling proteins in the mouse’s presumably unlearned preference for starch-derived polysaccharides, but they are not essential for the animal’s learned preference for Polycose reinforced by the post-oral actions of the nutrient (39). The finding that repeated experience with Polycose eliminated or greatly reduced the preference deficit of the KO mice for dilute Polycose solutions (1-4%) but only partially rescued their deficient acceptance of these solutions is similar to the response of the Trpm5 KO mice to soybean oil. Differential experiential effects have also been observed for the reduced preference and acceptance responses displayed by 129 mice, relative to B6 mice, for Polycose and sucrose solutions (39;40).
Flavor conditioning provides one explanation for the rescue of preference and acceptance responses to nutritive solutions in some knockout and inbred strains. Mice and rats develop significant preferences for flavored solutions (CS+) paired with IG infusions of Polycose or sucrose (39;40) over alternate flavors (CS-) paired with IG water infusions. Preference conditioning occurs with initially neutral or non-preferred flavors (e.g., sour grape or cherry solutions) as well as with initially preferred flavors (e.g., sweetened grape or cherry solutions). Rodents also increase their absolute intake of a nutrient-paired CS+ flavor but this conditioned acceptance response is most pronounced with flavors that are already preferred. For example, B6 mice show a much greater stimulation of intake when trained with a sweetened flavor rather than an unsweetened flavor paired with IG Polycose infusions (39). These findings suggest that, in the Gust KO and Trpm5 KO mice, the post-oral actions of Polycose may have conditioned a strong preference for the flavor (odor, texture) of the Polycose solutions but conditioned a weaker acceptance for the solutions because the mice did not sense the inherently preferred polysaccharide taste.
While the robust preferences of Gust KO and Trpm5 KO mice for the concentrated Polycose solutions are consistent with a post-oral conditioning effect, it is also possible that the KO mice can taste Polycose at high concentrations. Measures of the gustatory nerve response to Polycose solutions in KO mice are needed to clarify this issue. Brief access lick tests have also been used to assess gustatory responsiveness to nutritive solutions with post-oral effects minimized because of limited intakes. Gust KO mice displayed licking responses to Polycose at low (1, 2, 4%) and high (8%, 16%, 32%) concentrations that were indistinguishable from those obtained with WT mice, which is in marked contrast to attenuated preferences for 1 - 4% Polycose observed in Test 4 of this study. It should be noted that the Gust KO mice also showed normal or near-normal licking responses to various sweeteners (sucrose, maltose, fructose, SC45647) (11), although other studies report greatly attenuated long-term preferences for and gustatory nerve responses to sweeteners (12;29). The reason for these discrepancies is not clear, but probably reflects the fact that the neural mechanisms determining initial licking response differ from those that determine intake across 24-h tests. Data obtained with Trpm5 KO mice are more consistent: these mice displayed virtually no gustatory nerve response or brief access licking response to a wide range of sucrose concentrations (6). They also failed to prefer sucrose in 24-h two-bottle choice tests at low concentrations yet displayed an ∼80% preference for 1 M sucrose (6). This preference presumably represents the post-oral reinforcing actions of the sugar (40). Comparable data for Polycose are not available for Trpm5 KO mice.
The findings that Gust KO and Trpm5 KO mice initially show weak or no preferences for Polycose as well as sucrose (6;29) indicate that common taste signally elements mediate the preference response for these carbohydrates. Since Polycose contains a small amount of free sugar (glucose, maltose) it could be argued that Polycose and sucrose preferences are mediated by the same taste sweet taste receptor. The taste receptor mediating Polycose preference remains to be identified, but, as reviewed elsewhere (31;32;34), various behavioral and electrophysiological findings suggest that different taste receptors are involved in the preference for polysaccharides and sugars.
Starch Preference and Acceptance
The Trpm5 KO mice failed to prefer starch in Test 5. On the other hand, the Gust KO mice significantly preferred the starch suspension to the gum vehicle at 1 - 4% concentrations and consumed as much starch as did the WT mice. The preference of Gust KO mice for 1% and 2% starch is in marked contrast to their indifference to Polycose at the same concentrations in Test 4. When subsequently given the choice of 2% starch and Polycose, the Gust KO mice preferred starch by 87% whereas the WT mice preferred Polycose by 93%. The strong Polycose preference of the WT mice is consistent with results obtained with rats given the choice of 1 or 2% Polycose vs. starch (43). Unlike the mice in the present study, the rats had no experience with either carbohydrate in pure form prior to the choice tests which were very brief (3 min/day). Consequently, their Polycose preference over starch likely represents an unlearned response to orosensory qualities of Polycose and starch.
As noted in the Introduction, early studies of Polycose and starch appetite in rats led to the hypothesis that rodents have a polysaccharide “taste” receptor which was presumed to facilitate the identification of starch-rich foods (31;32). Subsequent findings, however, indicated that starch-derived polysaccharides and pure starch elicit qualitatively different percepts to rats. In particular, aversions conditioned to Polycose and starch do not cross-generalize (23;25). The present findings that Gust KO mice were indifferent to Polycose solutions and significantly preferred starch suspensions to vehicle as well as to Polycose provides the strongest evidence to date that different sensory signaling pathways mediate the attraction to starch and starch-derived polysaccharides. Although a polysaccharide taste receptor has yet to be identified, various findings indicate gustatory system involvement in polysaccharide appetite (31;34).
The sensory mediation of starch preference in rodents remains obscure although the present results implicate an important role for Trpm5. Unlike Polycose and sucrose, lingual stimulation with starch (amylopectin) elicited minimal evoked activity in the nucleus of the solitary tract which questions the role of gustation in starch appetite (10). Anosmia produced by olfactory bulbectomy or zinc sulfate treatment blocked the rat’s preference for 0.5% starch but only attenuated the preference for 1% starch (26). This effect was not unique to starch, however, and bulbectomy also attenuated the preference for sucrose and Polycose. The recent localization of Trpm5 in olfactory sensory neurons (18) along with the lack of a starch preference in Trpm5 KO mice is consistent with an olfactory component to starch appetite. It should be noted, however, that the odors that distinguish different types of starches (e.g., corn starch vs. potato starch) come from impurities in the starch preparation. Rats can distinguish these impurities but the “off tastes” do not contribute to animals’ preference for starch (22;24;43). Further studies of Trpm5 KO and WT mice may elucidate starch chemoreception.
Summary and Speculations
The present findings provide new evidence for the gustatory mediation of fat and polysaccharide preference and acceptance in rodents. Mice lacking α-gustducin or Trpm5 signaling proteins, which are deficient in their taste response to sweet, umami, and bitter taste stimuli, were indifferent to dilute Polycose solutions that are strongly preferred and overconsumed by wild-type mice. The Trpm5 KO mice also showed no preference for dilute oil emulsions or starch suspensions. The soybean oil and Polycose preference deficits, however, were rescued by repeated experience with these nutrients; the acceptance deficit was only partially rescued. The experientially-induced increase in soybean oil and Polycose intake in the Gust KO and Trpm5 KO mice was most likely due to the post-oral reinforcing action of these nutrients. This suggests that α-gustducin and Trpm5 signaling, while critical to the oral response to fat and/or carbohydrate, does not mediate the post-oral flavor conditioning by these nutrients. Intragastric infusions studies of Gust KO and Trpm5 KO mice are required, however, to fully evaluate the role of α-gustducin and Trpm5 in the gut on the reinforcing or satiating actions of nutrients. The differential responses of Gust KO and Trpm5 KO mice to Polycose and starch indicate that different Trpm5-dependent signaling pathways mediate the preference for these closely related carbohydrates. Unlike rodents, humans are not attracted to the “taste” of polysaccharides or fatty acids in solution or suspension form (4;9). Nevertheless, some evidence suggests that gustatory detection of these nutrients may elicit cephalic phase metabolic or other responses and this issue requires further investigation (3;19).
Acknowledgments
The authors thank Karen Ackroff for her helpful comments on this paper.
Grants
This research was supported by National Institutes of Health grants DK031135 (AS), DC03055 and DC03155 (RFM).
References
- 1.Bezencon C, leCoutre J, Damak S. Taste-signaling proteins are coexpressed in solitary intestinal epithelial cells. Chem Senses. 2006;32:41–49. doi: 10.1093/chemse/bjl034. [DOI] [PubMed] [Google Scholar]
- 2.Breslin PAS. Human gustation and flavour. Flavour and Fragrance Journal. 2006;16:439–456. [Google Scholar]
- 3.Carter JM, Jeukendrup AE, Jones DA. The effect of carbohydrate mouth rinse on 1-h cycle time trial performance. Med Sci Sports Exerc. 2004;36:2107–2111. doi: 10.1249/01.mss.0000147585.65709.6f. [DOI] [PubMed] [Google Scholar]
- 4.Chale-Rush A, Burgess JR, Mattes RD. Evidence for human orosensory (taste?) sensitivity to free fatty acids. Chem Senses . 2007 doi: 10.1093/chemse/bjm007. [DOI] [PubMed] [Google Scholar]
- 5.Chandrashekar J, Hoon MA, Ryba NJP, Zuker CS. The receptors and cells for mammalian taste. Nature. 2006;444:288–294. doi: 10.1038/nature05401. [DOI] [PubMed] [Google Scholar]
- 6.Damak S, Rong M, Yasumatsu K, Kokrashvili Z, Perez CA, Shigemura N, Yoshida R, Mosinger B, Jr., Glendinning JI, Ninomiya Y, Margolskee RF. Trpm5 null mice respond to bitter, sweet, and umami compounds. Chem Senses. 2006;31:253–264. doi: 10.1093/chemse/bjj027. [DOI] [PubMed] [Google Scholar]
- 7.Danilova V, Damak S, Margolskee RF, Hellekant G. Taste responses to sweet stimuli in α-gustducin knockout and wild-type mice. Chem Senses. 2006;31:573–580. doi: 10.1093/chemse/bjj062. [DOI] [PubMed] [Google Scholar]
- 8.Elizalde G, Sclafani A. Flavor preferences conditioned by intragastric Polycose infusions: A detailed analysis using an electronic esophagus preparation. Physiol Behav. 1990;47:63–77. doi: 10.1016/0031-9384(90)90043-4. [DOI] [PubMed] [Google Scholar]
- 9.Feigin MB, Sclafani A, Sunday SR. Species differences in polysaccharide and sugar taste preferences. Neurosci Biobehav Rev. 1987;11:231–240. doi: 10.1016/s0149-7634(87)80031-3. [DOI] [PubMed] [Google Scholar]
- 10.Giza BK, Scott TR, Sclafani A, Antonucci RF. Polysaccharides as taste stimuli: Their effect in the nucleus tractus solitarius of the rat. Brain Res. 1991;555:1–9. doi: 10.1016/0006-8993(91)90852-m. [DOI] [PubMed] [Google Scholar]
- 11.Glendinning JI, Bloom LD, Onishi M, Zheng KH, Damak S, Margolskee RF, Spector AC. Contribution of α-gustducin to taste-guided licking responses of mice. Chem Senses. 2005;30:299–316. doi: 10.1093/chemse/bji025. [DOI] [PubMed] [Google Scholar]
- 12.He W, Danilova V, Zou S, Hellekant G, Max M, Margolskee RF, Damak S. Partial rescue of taste responses of alpha-gustducin null mice by transgenic expression of alpha-transducin. Chem Senses. 2002;27:719–727. doi: 10.1093/chemse/27.8.719. [DOI] [PubMed] [Google Scholar]
- 13.Höfer D, Püschel B, Drenckhahn D. Taste receptor-like cells in the rat gut identified by expression of alpha-gustducin. Proc Natl Acad Sci U S A. 1996;93:6631–6634. doi: 10.1073/pnas.93.13.6631. [DOI] [PMC free article] [PubMed] [Google Scholar]
- 14.Kawai T, Fushiki T. Importance of lipolysis in oral cavity for orosensory detection of fat. Am J Physiol. 2003;285:R447–R454. doi: 10.1152/ajpregu.00729.2002. [DOI] [PubMed] [Google Scholar]
- 15.Laugerette F, Gaillard D, Passilly-Degrace P, Niot I, Besnard P. Do we taste fat? Biochimie. 2006;89:265–269. doi: 10.1016/j.biochi.2006.10.011. [DOI] [PubMed] [Google Scholar]
- 16.Laugerette F, Passilly-Degrace P, Patris B, Niot I, Febbraio M, Montmayeur JP, Besnard P. CD36 involvement in orosensory detection of dietary lipids, spontaneous fat preference, and digestive secretions. J Clin Invest. 2005;115:3177–3184. doi: 10.1172/JCI25299. [DOI] [PMC free article] [PubMed] [Google Scholar]
- 17.Lewis SR, Dym C, Chai C, Singh A, Kest B, Bodnar RJ. Genetic variance contributes to ingestive processes: A survey of eleven inbred mouse strains for fat (Intralipid) intake. Physiol Behav. 2006;90:82–94. doi: 10.1016/j.physbeh.2006.08.028. [DOI] [PubMed] [Google Scholar]
- 18.Lin W, Margolskee R, Donnert G, Hell SW, Restrepo D. Olfactory neurons expressing transient receptor potential channel M5 (TRPM5) are involved in sensing semiochemicals. Proc Natl Acad Sci U S A. 2007;104:2471–2476. doi: 10.1073/pnas.0610201104. [DOI] [PMC free article] [PubMed] [Google Scholar]
- 19.Mattes RD. Fat taste and lipid metabolism in humans. Physiol Behav. 2005;86:691–697. doi: 10.1016/j.physbeh.2005.08.058. [DOI] [PubMed] [Google Scholar]
- 20.McCormack DN, Herzog P, Webster KL, Pittman DW. Gustatory detection of a free fatty acid, linoleic acid, by rats. Chem Senses. 2005;28:A91. [Google Scholar]
- 21.Nissenbaum JW, Sclafani A. Qualitative differences in polysaccharide and sugar tastes in the rat: A two-carbohydrate taste model. Neurosci Biobehav Rev. 1987;11:187–196. doi: 10.1016/s0149-7634(87)80025-8. [DOI] [PubMed] [Google Scholar]
- 22.Ramirez I. Chemoreception for an insoluble nonvolatile substance: Starch taste? Am J Physiol. 1991;260:R192–R199. doi: 10.1152/ajpregu.1991.260.1.R192. [DOI] [PubMed] [Google Scholar]
- 23.Ramirez I. Does starch taste like Polycose? Physiol Behav. 1991;50:389–392. doi: 10.1016/0031-9384(91)90083-z. [DOI] [PubMed] [Google Scholar]
- 24.Ramirez I. Starch flavor: can rats taste an insoluble substance? Chem Senses. 1991;16:361–371. [Google Scholar]
- 25.Ramirez I. Thresholds for starch and Polycose are lower than for sucrose in rats. Physiol Behav. 1991;50:699–703. doi: 10.1016/0031-9384(91)90005-9. [DOI] [PubMed] [Google Scholar]
- 26.Ramirez I. Role of olfaction in starch and oil preference. Am J Physiol. 1993;265:R1404–R1409. doi: 10.1152/ajpregu.1993.265.6.R1404. [DOI] [PubMed] [Google Scholar]
- 27.Rozengurt N, Wu S, Chen MC, Huang C, Sternini C, Rozengurt E. Co-localization of the α subunit of gustducin with PYY and GLP-1 in L cells of human colon. Am J Physiol Gastrointest Liver Physiol. 2006;291:G792–G802. doi: 10.1152/ajpgi.00074.2006. [DOI] [PubMed] [Google Scholar]
- 28.Ruiz CJ, Wray K, Delay E, Margolskee RF, Kinnamon SC. Behavioral evidence for a role of α-gustducin in glutamate taste. Chem Senses. 2003;28:573–579. doi: 10.1093/chemse/bjg049. [DOI] [PubMed] [Google Scholar]
- 29.Ruiz-Avila L, Wong GT, Damak S, Margolskee RF. Dominant loss of responsiveness to sweet and bitter compounds caused by a single mutation in alpha -gustducin. Proc Natl Acad Sci U S A. 2001;98:8868–8873. doi: 10.1073/pnas.151235798. [DOI] [PMC free article] [PubMed] [Google Scholar]
- 30.Sako N, Shimura T, Komure M, Mochizuki R, Matsuo R, Yamamoto T. Differences in taste responses to Polycose and common sugars in the rat as revealed by behavioral and electrophysiological studies. Physiol Behav. 1994;56:741–745. doi: 10.1016/0031-9384(94)90236-4. [DOI] [PubMed] [Google Scholar]
- 31.Sclafani A. Carbohydrate taste, appetite, and obesity: An overview. Neurosci Biobehav Rev. 1987;11:131–153. [PubMed] [Google Scholar]
- 32.Sclafani A. Starch and sugar tastes in rodents: An update. Brain Res Bull. 1991;27:383–386. doi: 10.1016/0361-9230(91)90129-8. [DOI] [PubMed] [Google Scholar]
- 33.Sclafani A. Oral and postoral determinants of food reward. Physiol Behav. 2004;81:773–779. doi: 10.1016/j.physbeh.2004.04.031. [DOI] [PubMed] [Google Scholar]
- 34.Sclafani A. The sixth taste. Appetite. 2004;43:1–3. doi: 10.1016/j.appet.2004.03.007. [DOI] [PubMed] [Google Scholar]
- 35.Sclafani A. Enhanced sucrose and Polycose preference in sweet “sensitive” (C57BL/6J) and “subsensitive” (129P3/J) mice after experience with these saccharides. Physiol Behav. 2006;87:745–756. doi: 10.1016/j.physbeh.2006.01.016. [DOI] [PubMed] [Google Scholar]
- 36.Sclafani A. Fat and sugar flavor preference and acceptance in C57BL/6J and 129 mice: experience attenuates strain differences. Physiol Behav. 2007;90:602–611. doi: 10.1016/j.physbeh.2006.11.012. [DOI] [PubMed] [Google Scholar]
- 37.Sclafani A, Ackroff K, Abumrad N. CD36 gene deletion attenuates but does not eliminate fat preference and acceptance in mice. Am J Physiol Regul Integr Comp Physiol submitted. 2007 doi: 10.1152/ajpregu.00211.2007. [DOI] [PubMed] [Google Scholar]
- 38.Sclafani A, Ackroff K, Abumrad N. Fat preference and acceptance in the CD36 knockout mice. Appetite. 2007;49:329. [Google Scholar]
- 39.Sclafani A, Glendinning JI. Flavor preferences conditioned in C57BL/6 mice by intragastric carbohydrate self-infusion. Physiol Behav. 2003;79:783–788. doi: 10.1016/s0031-9384(03)00174-4. [DOI] [PubMed] [Google Scholar]
- 40.Sclafani A, Glendinning JI. Sugar and fat conditioned flavor preferences in C57BL/6J and 129 mice: Oral and postoral interactions. Am J Physiol Regul Integr Comp Physiol. 2005;289:R712–R720. doi: 10.1152/ajpregu.00176.2005. [DOI] [PubMed] [Google Scholar]
- 41.Sclafani A, Mann S. Carbohydrate taste preferences in rats: Glucose, sucrose, maltose, fructose and Polycose compared. Physiol Behav. 1987;40:563–568. doi: 10.1016/0031-9384(87)90097-7. [DOI] [PubMed] [Google Scholar]
- 42.Sclafani A, Nissenbaum JW. Taste preference thresholds for Polycose, maltose and sucrose in rats. Neurosci Biobehav Rev. 1987;1:181–185. doi: 10.1016/s0149-7634(87)80024-6. [DOI] [PubMed] [Google Scholar]
- 43.Sclafani A, Nissenbaum JW, Vigorito M. Starch preference in rats. Neurosci Biobehav Rev. 1987;11:253–262. doi: 10.1016/s0149-7634(87)80033-7. [DOI] [PubMed] [Google Scholar]
- 44.Smith JC, Foster DF. Some determinants of intake of glucose + saccharin solutions. Physiol Behav. 1980;25:127–133. doi: 10.1016/0031-9384(80)90192-4. [DOI] [PubMed] [Google Scholar]
- 45.Somenarain L, Jakinovich W., Jr. Antagonism of the gerbil’s sweetener and Polycose gustatory responses by copper chloride. Brain Res. 1990;522:83–89. doi: 10.1016/0006-8993(90)91580-a. [DOI] [PubMed] [Google Scholar]
- 46.Stratford JM, Curtis KS, Contreras RJ. Chorda tympani nerve transection alters linoleic acid taste discrimination by male and female rats. Physiol Behav. 2006;89:311–319. doi: 10.1016/j.physbeh.2006.06.009. [DOI] [PubMed] [Google Scholar]
- 47.Takeda M, Sawano S, Imaizumi M, Fushiki T. Preference for corn oil in olfactory-blocked mice in the conditioned place preference test and the two-bottle choice test. Life Sci. 2001;69:847–854. doi: 10.1016/s0024-3205(01)01180-8. [DOI] [PubMed] [Google Scholar]
- 48.Tordoff MG. Taste solution preferences of C57BL/6J and 129X1/SvJ mice: Influence of age, sex, and diet. Chem Senses. 2007 doi: 10.1093/chemse/bjm034. [DOI] [PMC free article] [PubMed] [Google Scholar]
- 49.Vigorito M, Sclafani A. Ontogeny of Polycose and sucrose appetite in neonatal rats. Dev Psychobiol. 1988;21:457–465. doi: 10.1002/dev.420210505. [DOI] [PubMed] [Google Scholar]
- 50.Vigorito M, Sclafani A, Jacquin MF. Effects of gustatory deafferentation on Polycose and sucrose appetite in the rat. Neurosci Biobehav Rev. 1987;11:201–209. doi: 10.1016/s0149-7634(87)80027-1. [DOI] [PubMed] [Google Scholar]
- 51.Winer BJ. Statistical Principles in Experimental Design. McGraw Hill; New York: 1962. [Google Scholar]
- 52.Wong GT, Gannon KS, Margolskee RF. Transduction of bitter and sweet taste by gustducin. Nature. 1996;381:796–800. doi: 10.1038/381796a0. [DOI] [PubMed] [Google Scholar]
- 53.Wu SV, Rozengurt N, Yang M, Young SH, Sinnett-Smith J, Rozengurt E. Expression of bitter taste receptors of the T2R family in the gastrointestinal tract and enteroendocrine STC-1 cells. Proc Natl Acad Sci U S A. 2002;99:2392–2397. doi: 10.1073/pnas.042617699. [DOI] [PMC free article] [PubMed] [Google Scholar]
- 54.Zhang Y, Hoon MA, Chandrashekar J, Mueller KL, Cook B, Wu D, Zuker CS, Ryba NJP. Coding of sweet, bitter, and umami tastes: Different receptor cells sharing similar signaling pathways. Cell. 2003;112:293–301. doi: 10.1016/s0092-8674(03)00071-0. [DOI] [PubMed] [Google Scholar]