Abstract
Two putative respiratory rhythm generators (RRGs), the para-facial respiratory group (pFRG) and the pre-Bötzinger complex (preBötC), have been identified in the neonatal rodent brainstem. To elucidate their functional roles during the neonatal period, we evaluated developmental changes of these RRGs by optical imaging using a voltage-sensitive dye. Optical signals, recorded from the ventral medulla of brainstem–spinal cord preparations of neonatal (P0–P4) rats (n = 44), were analysed by a cross correlation method. With development during the first few postnatal days, the respiratory-related activity in the pFRG reduced and shifted from a preinspiratory (P0–P1) to an inspiratory (P2–P4) pattern, whereas preBötC activity remained unchanged. The μ-opioid agonist [d-Ala(2),N-Me-Phe(4),Gly(5)-ol]-enkephalin (DAMGO) augmented preinspiratory activity in the pFRG, while the μ-opioid antagonist naloxone induced changes in spatiotemporal activation profiles that closely mimicked the developmental changes. These results are consistent with the recently proposed hypothesis by Janczewski and Feldman that the pFRG is activated to compensate for the depression of the preBötC by perinatal opiate surge. We conclude that significant reorganization of the respiratory neuronal network, characterized by a reduction of preinspiratory activity in the pFRG, occurs at P1–P2 in rats. The changes in spatiotemporal activation profiles of the pFRG neurones may reflect changes in the mode of coupling of the two respiratory rhythm generators.
Recent progress in understanding where and how the mammalian respiratory rhythm is generated has been made mainly using in vitro neonatal rodent preparations. Experiments using slice and en bloc preparations have identified two regions important in generating the respiratory rhythm, i.e. the pre-Bötzinger complex (preBötC) (Smith et al. 1991; Feldman & Janczewski, 2006) and the para-facial respiratory group (pFRG) (Onimaru et al. 1988; Onimaru & Homma, 2003, 2006). As to the functional roles of these neuronal groups, the ‘coupled oscillator hypothesis’ has been proposed: the preBötC generates inspiratory rhythm and the pFRG generates expiratory activity, and these two oscillators are coupled (Janczewski et al. 2002; Feldman & Del Negro, 2006; Janczewski & Feldman, 2006).
Although the regulatory neural network responsible for respiratory control is capable of generating robust rhythm by birth (Greer et al. 2006), remarkable developmental changes continue after birth. There are profound changes in sensitivity of the respiratory rhythm to blockade of glycine receptors during the first 2 weeks of life in mice and rats (Paton et al. 1994). The reversal potential of GABAA receptor-mediated current in preBötC neurones switched from depolarizing at P0 to hyperpolarizing at P4 due to intracellular chloride concentration changes in mice (Ritter & Zhang, 2000). Further, endogenous opiates may modulate ventilatory control in the neonatal period (Jansen & Chernick, 1983). The administration of naloxone, a μ-opioid receptor competitive antagonist, increases respiratory frequency and reduces arterial  in rabbits younger than 4 days, but these effects are not observed in rabbits older than 4 days (Hazinski et al. 1981). These findings indicate that remarkable developmental changes in the neuronal network that generates respiratory rhythm may occur shortly after birth.
The question arises as to what re-organization of the respiratory network accompanies these profound developmental adjustments of respiratory motor output? To answer this question, we analysed optical signals associated with respiratory neuronal activity in the ventral medulla including preBötC and pFRG, and compared the signals between two age groups (i.e. P0–P1 and P2–P4 groups). Recent advances in imaging technology allowed us to visualize the spatiotemporal organization in the spontaneously active respiratory neuronal network (Koshiya & Smith, 1999; Onimaru & Homma, 2003, 2005; Potts & Paton, 2006; Fisher et al. 2006). To fully take an advantage of this technique, it is necessary to effectively extract spatiotemporal activation profiles from large-scale time series data. The present study employed cross correlation analysis to identify the distribution of respiratory-related neurones and the timing of their activation relative to the inspiratory activity.
We found that pixels with preinspiratory (Pre-I) activity in pFRG are present in P0–P1 animals but become obscure in P2–P4 animals. It has been proposed that the pFRG is activated to compensate for the depression of the preBötC due to the surge of opiates at birth (Feldman & Del Negro, 2006; Janczewski & Feldman, 2006). We therefore tested whether the μ-opioid agonist [d-Ala(2),N-Me-Phe(4),Gly(5)-ol]-enkephalin (DAMGO) causes compensatory activation of the pFRG, and whether the μ-opioid antagonist naloxone mimics the developmental change during the early postnatal period by relieving the depressive effect of opiates.
Methods
Animal preparation
Isolated brainstem–spinal cord preparations were made of neonatal Sprague–Dawley rats (n = 44, 0–4 days old) according to methods previously described (Okada et al. 2005). Experimental protocols were approved by the Animal Research Committee of Hyogo College of Medicine. Briefly, each animal was deeply anaesthetized with diethyl ether, quickly decerebrated at the intercollicular level, and the brainstem and spinal cord were isolated. The cerebellum and brain structures rostral to the VIth cranial nerve were removed, and the arachnoid membrane covering the ventral surface of the medulla was carefully removed. The preparation was incubated in a mock cerebrospinal fluid (CSF; for contents, see below) containing a voltage-sensitive dye, di-2-ANEPEQ (0.1–0.2 mm, Invitrogen, Carlsbad, CA, USA) for 50 min with 95% O2 and 5% CO2. After staining, the preparation was rinsed in CSF for 15 min to elute surplus dye, transferred to a 2 ml recording chamber, and pinned with the ventral surface up. The recording chamber was continuously superfused with a CSF at a rate of 3 ml min−1. The temperature of the superfusate was controlled by a water-cooled Peltier system (DTC-300, Dia Medical, Tokyo, Japan) at 27 ± 1°C. The control CSF contained (mm): NaCl 124, KCl 5.0, CaCl2 2.4, MgSO4 1.3, KH2PO4 1.2, NaHCO3 26, glucose 30, and was equilibrated with 5% CO2 and 95% O2. The pH was 7.4 at the experimental condition. DAMGO (0.2 μm; Sigma) and naloxone (10–30 μm; Sigma) containing superfusates were used when testing their effects.
Inspiratory-related respiratory activity was monitored from the C4 ventral root (C4VR) with a suction electrode. The raw nerve signal was amplified using a bioelectric amplifier (AB651J, Nihon Kohden, Tokyo, Japan) and band-pass filtered from 15 Hz to 3 kHz. The filtered signal was fed into a time–amplitude window discriminator (EN611J, Nihon Kohden) to trigger the optical recording system at the onset of inspiratory C4VR activity. The window discriminator generated a Transister-Transister Logic (TTL)-level pulse signal when the C4 activity exceeded the minimally preset threshold level, then the TTL pulse was fed into the optical recording system. In addition, the filtered signal was full-rectified and integrated using a ‘leaky’ integrator (EI601G, Nihon Kohden) with a time constant of 100 ms.
Optical recording
The recording chamber was mounted on a fluorescence macro zoom microscope (MVX-10, Olympus Optical, Tokyo, Japan). Activity of respiratory neurones in the ventral medulla was analysed using an optical recording system (MiCAM Ultima, BrainVision, Tokyo, Japan). Preparations were illuminated with a tungsten–halogen lamp (150 W) through a band-pass excitation filter (λ = 480–550 nm). Epifluorescence through a long-pass barrier filter (λ > 590 nm) was detected with a CMOS sensor array (MiCAM Ultima L-camera, BrainVision; 100 μm × 100 μm pixel size, 100 × 100 pixel array). Magnification of the microscope was adjusted to 2.8 to ∼3.3× depending on the size of the brainstem. One pixel corresponded to 30 × 30 to ∼35 × 35 μm, and the image sensor covered a total of 3 × 3 to ∼3.5 × 3.5 mm2. Optical signals were sampled at 50 Hz (20 ms frame−1). Raw and integrated C4VR activities were recorded at 1 kHz, stored in a hard disk together with optical signals for later analyses. A total of 256 frames were recorded starting at 64 frames (1.28 s) before the onset of inspiratory C4VR activity, and averaged 30 times.
Data analysis
The change in fluorescence intensity (ΔF) relative to the initial intensity of the fluorescence (F0) in each pixel was calculated. To normalize the difference in the amount of membrane-bound dye and illumination within the preparation, background fluorescence intensity at each pixel was divided by the maximal background fluorescence, then the ratio of ΔF to the normalized background fluorescence intensity (F), i.e. the fractional change in fluorescence intensity (ΔF/F), was calculated at each pixel in each frame (Fukuda et al. 2006). If F was less than 0.25, then ΔF/F was set to be zero. A negative ΔF/F corresponds to membrane depolarization.
Cross correlation coefficients between the integrated C4VR activity and each pixel were calculated after removing linear drift components associated with photo-bleaching. The cross correlation coefficient function was defined as:
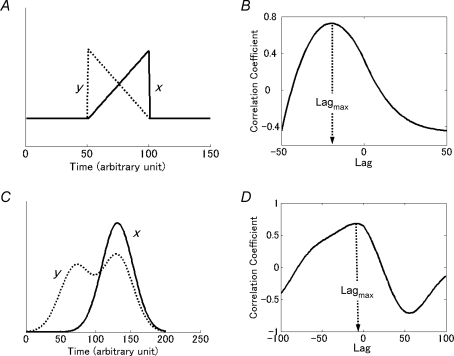
where x was the integrated C4VR activity and y was optical signal at each pixel. Cross correlation coefficients were estimated for the lag τ ranging between −1 and 1 s. When a second peak corresponding to the postinspiratory activity was observed in the latter half of time frames, cross correlation coefficients for the first 128 frames were calculated. Otherwise cross correlation coefficients were calculated using all 256 frames. Then the maximum of cross correlation coefficients (CCmax) and the lag at which the cross correlation became maximal (LAGmax) were estimated for each pixel. The physiological significance of CCmax is the strength of respiratory modulation of cellular activity within the pixel, and that of LAGmax is the temporal relationship between the C4VR activity and the overall membrane depolarization of cells within a pixel. A negative LAGmax means that the overall depolarization precedes the C4VR activity, although it does not necessarily mean that the onset or the peak of depolarization is earlier than that of C4VR. For example, suppose x is a signal with an incrementing pattern, and y is that with a decrementing pattern (Fig. 1A). The overall activity of y precedes that of x and LAGmax of Rxy(τ) is negative (Fig. 1B), even if their onset is the same. Alternatively, suppose x is a signal with a single peak, and y is a signal with an additional smaller peak at an earlier timing (Fig. 1C). Again, the overall activity of y precedes that of x and LAGmax is negative (Fig. 1D), even if their peak is the same.
Figure 1.
LAGmax represents the temporal relationship between two correlated signals A, an example where x is a signal with an incrementing pattern, and y is a signal with the same onset but has a decrementing pattern. B, cross correlation coefficient function Rxy(τ) of the signals in A is plotted against lag τ. The negative Lagmax indicates that the overall activity of y precedes that of x. C, an example where x is a signal with a single peak, and y is a signal with double peaks, a smaller early peak and a larger late peak at the same timing with that of x. D, cross correlation coefficient function Rxy(τ) of the signals in C has negative Lagmax, indicating that the overall activity of y precedes that of x.
As a test of significance of cross correlation coefficient estimates, the upper 99.9% confidence value was calculated with P < 0.001 being considered significant. The confidence value was 0.19 for 256 frames data and 0.26 for 128 frames data.
The spatiotemporal characteristics of respiratory-related neuronal activity were estimated and compared between different age groups as follows. First, we defined pixels having CCmax > 0.3 as respiratory-related pixels, and plotted on the reference image. This threshold value was greater than the upper 99.9% confidence value and eliminated most noises associated with tissue vibration and scattering light. If the threshold were lower, more pixels would have been found and possibly in different areas. However, as a tradeoff, more artifacts would have been recognized as respiratory-related pixels, and pixels with a poor signal-to-noise ratio would have been picked up, which would make subsequent analyses inaccurate.
Since our method does not take cellular properties or axonal projections into consideration, it is not possible to extract functionally homogeneous cell populations. The pFRG is not distinguished from the medially overlapped retrotrapezoid nucleus (RTN) (Pearce et al. 1989; Smith et al. 1989; Connelly et al. 1990; Onimaru & Homma, 2003; Guyenet et al. 2005), and thus we use the designation pFRG/RTN to refer to the area (Feldman et al. 2003; Feldman & Del Negro, 2006). Similarly, preBötC neurones are not distinguished from other ventral respiratory group (VRG) neurones such as inspiratory bulbospinal neurones and motoneurones (Ezure, 2004). Therefore, we use the term preBötC/VRG to refer to this region.
To quantify the time course of activity in the pFRG/RTN and of the preBötC/VRG, two adjacent 20 × 20 pixels regions of interest (ROIs) were set so that these ROIs covered most respiratory-related pixels in the pFRG/RTN and the preBötC/VRG, respectively. Two ROIs were separated at the level of the caudal border of IX/X cranial nerve rootlets. The spatial distribution of respiratory-related neurones was represented by the total count of respiratory-related pixels in each ROI, whereas the average LAGmax of respiratory-related pixels in each ROI represented the temporal profile. The Pre-I activity in the pFRG/RTN region was quantitatively measured by calculating the areas under the curve of optical signals of respiratory-related pixels at the Pre-I phase. The indices of spatiotemporal activation profile were compared between two age groups (i.e. P0–P1 and P2–P4 groups) by unpaired t test, and before and after DAMGO/naloxone treatment by Wilcoxon signed rank test because the data were not normally distributed. A P value of less than 0.05 was considered significant. Values are shown as mean ± s.e.m.
Results
Optical signals associated with respiratory-related activity
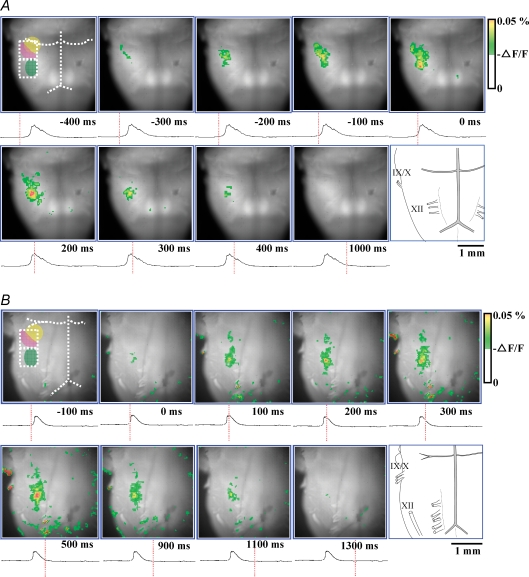
We observed different patterns of spatiotemporal activation sequence of respiratory neurones by analysing fluorescent signals recorded from the ventral surface of the medulla. Activation patterns were different among preparations (Fig. 2A and B, and also see Supplementary imaging videos available on line). In younger animals (P0, Fig. 2A), the membrane depolarization started in the crescent-shaped region in the ventrolateral medulla, the rostral border of which was 0–300 μm caudal to the anterior inferior cerebellar artery, the medial border was 800–950 μm lateral to the midline, the lateral border was 350–450 μm medial to the edge of the preparation, and the caudal border was the caudal end of the Xth cranial rootlet. This region corresponds to the pFRG/RTN (Onimaru & Homma, 2003). The excitation then spread caudally to the preBötC/VRG. Depolarization signals of both the pFRG/RTN and preBötC/VRG preceded the onset of the burst of C4VR activity by 228 ± 48 ms and 115 ± 17 ms, respectively. The peak fluorescent signal in the pFRG/RTN preceded that in the preBötC/VRG, and both reached the peak before that of C4VR activity. These respiratory-related fluorescent signals gradually decreased during the inspiratory phase. In older animals (P3, Fig. 2B), it appeared that depolarization started simultaneously in the pFRG/RTN and preBötC/VRG, and showed a similar time course. The onset of these respiratory-related fluorescent signals preceded the integrated C4VR activity by 124 ± 31 ms and 96 ± 17 ms, respectively, and reached their peaks before the peak of the integrated C4VR activity.
Figure 2.
Respiratory-related optical signals initiate at the pFRG/RTN in P0 rat, but simultaneously emerge in the pFRG/RTN and the preBötC/VRG in P3 rat A, representative optical images in which Pre-I activity was evident in the pFRG/RTN area (P0 rat). Pre-I activity preceded the C4VR activity by 228 ± 48 ms. Activity then spread caudally to the preBötC/VRG. B, representative optical images in which the neuronal activity started simultaneously in the pFRG/RTN and the preBötC/VRG (P3 rat). The onset of these activities preceded the integrated C4VR activity by 115 ± 17 ms, and reached their peak coincident with the peak of the integrated C4VR activity. The reason why only few pixels are visible in the preBötC/VRG at time 0, at which the C4VR is already active, is due to the pseudocolour-mapping threshold selection. By lowering the threshold, more pixels are displayed, but more artifacts in other locations are displayed. The recorded timing of each image is indicated by the red vertical line on the integrated C4 activity tracing. In the first panel, the anterior inferior cerebellar artery, the basilar artery, and the vertebral artery are demarcated with white dotted lines; the facial nucleus, the pFRG/RTN and the preBötC/VRG are demarcated with yellow, pink and green halftone areas; 20 × 20 pixels regions of interests are demarcated with white dotted open squares. The orientation of the preparation is also shown by the schematic drawing on the last panel. IX/X, XII, cranial nerves.
Correlation coefficient images
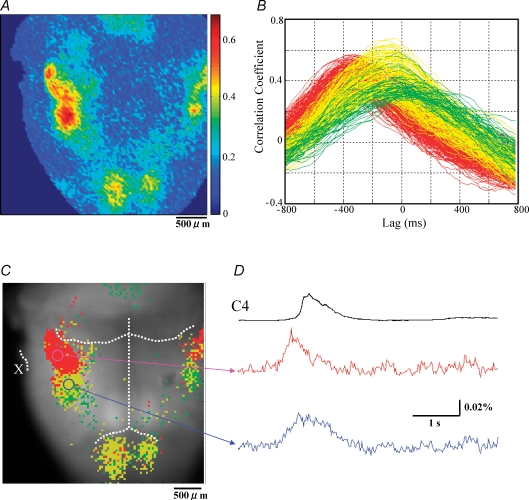
To further characterize spatiotemporal activation patterns, we imaged the peaks of cross correlation coefficient function between C4VR activity and the optical signal from respiratory-related pixels, which were defined as pixels with CCmax > 0.3 (Fig. 3A). Respiratory-related fluorescent signals were consistently identified in a continuous column in the ventral medulla in all preparations. The area located at the level rostral to the Xth cranial nerve root corresponds to the pFRG/RTN, and the area caudal to the Xth cranial nerve root corresponds to the preBötC/VRG. The most caudal respiratory-related area shown in Fig. 3 corresponds to the most rostral portion (C1–C2) of the upper cervical spinal cord. In a preliminary experiment, we extracellularly recorded inspiratory neuronal activities from this area, 150–250 μm below the surface. Since previously reported upper cervical inspiratory neurones are localized at deeper areas in the intermediolateral part of the grey matter of the upper cervical segments (Duffin & Hoskin, 1987; Nakazono & Aoki, 1994; Tian & Duffin, 1996), the imaged neuronal population may be another, possibly a novel, respiratory neurone group. However, we do not discuss this issue here in detail, because it is beyond the scope of the present study.
Figure 3.
The pFRG/RTN and the preBötC/VRG have different activation profiles in P0 rat Analyses were made from data shown in Fig. 2A. A, pseudocolour image of the peaks of cross correlation function between C4VR activity and optical signal at each pixel. B, cross correlation function plots. Only pixels with CCmax > 0.3 are shown. Pixels with Pre-I peak are shown in red (LAGmax < −200 ms) and yellow (−200 < LAGmax < 0 ms), and pixels with inspiratory peak are shown in green. Note that pixels consist of two clusters (red versus yellow + green). C, activation profile of respiratory-related areas is plotted on the reference image. Only pixels with CCmax > 0.3 are plotted. The anterior inferior cerebellar artery, the basilar artery, and the vertebral artery are demarcated with white dotted lines. X indicates the Xth cranial nerve. Note that the two clusters with different activation profiles are spatially demarcated, corresponding to the pFRG/RTN and the preBötC/VRG areas. D, optical signal waveforms representing each cluster are shown.
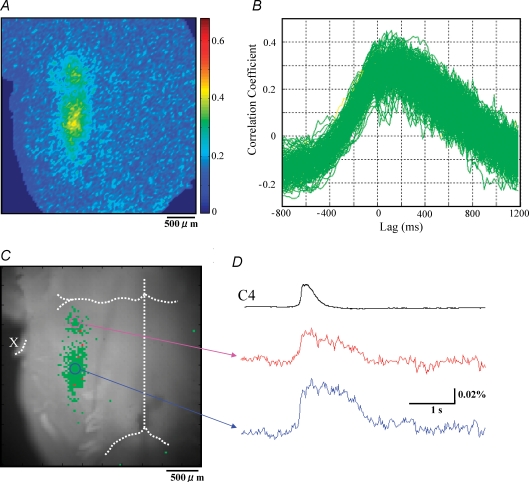
We computed the cross correlation coefficient function to evaluate the activation timing of each respiratory-related pixel relative to the onset of the C4VR activity (Fig. 3B). The activation timing of each pixel was characterized by LAGmax, the lag at which the cross correlation was maximal. A negative LAGmax value indicates that the overall membrane depolarization of cells within the pixel precedes the C4VR activity. We found that cross correlation coefficient functions consisted of two clearly separated clusters, one with LAGmax < −200 ms and the other with LAGmax > −200 ms (the K-means clustering method). In other words, there existed early-activated and late-activated pixel populations. When these activation profiles were plotted on the reference image, one cluster corresponded to the pFRG/RTN while the other corresponded to the preBötC/VRG (Fig. 3C). The membrane depolarization of pFRG/RTN neurones preceded that of preBötC/VRG (Fig. 3D). This activation profile was preferentially observed in younger animals (P0–P1). In older animals (P2–P4), the pFRG/RTN region was less conspicuous (Fig. 4A). Further, cross correlation coefficient functions consisted of a single cluster (Fig. 4B), with no observable early activated pixel population. Although two clusters corresponding to the pFRG/RTN and the preBötC/VRG were still identifiable (Fig. 4C), the membrane trajectories of the pFRG/RTN and the preBötC/VRG pixels had similar temporal activation profiles, and the membrane depolarization continued longer than the C4VR inspiratory activity (Fig. 4D).
Figure 4.
The pFRG/RTN and the preBötC/VRG have the same activation profiles in P3 rat Analyses were made from data shown in Fig. 2B. A, pseudocolour image of the peaks of cross correlation function between C4VR activity and optical signal at each pixel. B, cross correlation function plots. Each colour has the same meaning as in Fig. 3B. In contrast to Fig. 3B, almost all pixels have an inspiratory phase dominant activity pattern, and only a single cluster is recognized. C, activation profile of respiratory-related areas is plotted on the reference image. Only pixels with CCmax > 0.3 were plotted. The anterior inferior cerebellar artery, the basilar artery, and the vertebral artery are demarcated with white dotted lines. X indicates the Xth cranial nerve. Note that two regions, corresponding to pFRG/RTN and preBötC/VRG, are recognized but their activation profiles are similar. D, optical signal waveforms representing each region are shown.
Comparison of respiratory-related pixel areas between two age groups
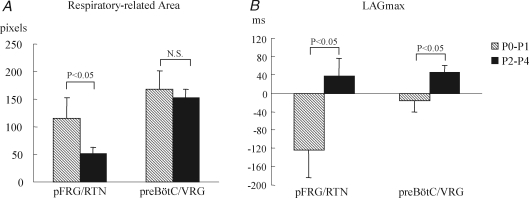
We quantified the time course of activity in selected subregions of the pFRG/RTN and of the preBötC/VRG, and timings when these areas were activated relative to the onset of the C4VR activity. We then calculated the total count of respiratory-related pixels. These indices of spatiotemporal activation profile were compared between P0–P1 (n = 16) and P2–P4 (n = 21) rats (Fig. 5A and B). The respiratory-related pixels in the pFRG/RTN region decreased with age from 105 ± 27 pixels to 52 ± 12 pixels (P < 0.05), whereas those in the preBötC/VRG area remained unchanged (162 ± 26 pixels versus 148 ± 15 pixels) (Fig. 5A). Both the time of the onset and the time when the activity became maximal within these areas delayed with age, which was reflected in the increase in LAGmax. The average LAGmax of the pFRG/RTN region in P0–P1 animals was −118 ± 42 ms, indicating that the fluorescent depolarization signals in the pFRG/RTN preceded the C4VR activity (Fig. 5B). In P2–P4 rats, the average LAGmax of the pFRG/RTN region dramatically increased to 44 ± 40 ms (P < 0.05). The average LAGmax of the preBötC/VRG also increased from −13 ± 17 ms to 50 ± 15 ms (P < 0.05).
Figure 5.
Within a few days after birth, the number of active neurones decreases and the onset of depolarization delays in the pFRG/RTN Comparisons of respiratory-related pixels in number (A) and activation timing (B) between two age groups. The average LAGmax of the pFRG/RTN region in P0–P1 animals was −118 ± 42 ms, indicating that the mean pFRG/RTN activity was attained much earlier than that of C4VR. In P2–P4 rats, the average LAGmax of the pFRG/RTN region became positive (44 ± 40 ms), meaning that the timing of depolarization dramatically delayed.
Effects of DAMGO and naloxone on spatiotemporal activation pattern
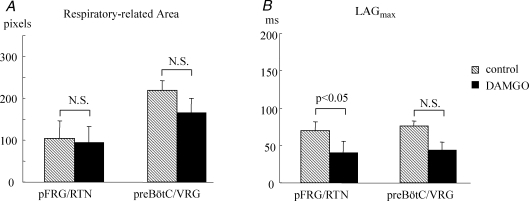
The concentration of endogenous opiates is elevated at birth in mammals (Wardlaw et al. 1979). This surge of opiates dissipates within a few days. We therefore evaluated the effects of DAMGO (a μ-opioid agonist) and naloxone (a μ-opioid receptor competitive antagonist) to elucidate the physiological mechanisms causing the age-dependent changes in spatiotemporal activation profiles of respiratory activity. DAMGO increased the Pre-I activity by 137% on average (Fig. 6), which decreased the average LAGmax in the pFRG/RTN area from 70 ± 12 ms to 40 ± 15 ms (n = 7, P1–P3, P < 0.05). In 3 of 7 preparations, the Pre-I activity in the pFRG/RTN was significantly augmented by DAMGO application (Wilcoxon's signed rank test, comparisons of 38–70 respiratory-related pixels, P < 0.01), which advanced the onset of depolarization and augmented the peak of excitation, but did not change the time when the activity became maximal. In the other four preparations where the Pre-I activity of the control had been already obvious, DAMGO did not alter the Pre-I activity in the pFRG/RTN. The onset, the peak time and the peak value of fluorescent depolarization signals in the preBötC/VRG did not change significantly. Changes in cumulative number of respiratory-related pixels in both pFRG/RTN and preBötC/VRG areas did not reach the statistically significant level.
Figure 6.
DAMGO augments the Pre-I activity and advances the onset of the pFRG/RTN neurone activity A, the numbers of respiratory-related pixels in the pFRG/RTN and preBötC/VRG areas did not significantly change with the administration of DAMGO. B, the average LAGmax of the pFRG/RTN area was significantly decreased by DAMGO, reflecting the augmentation of the Pre-I activity.
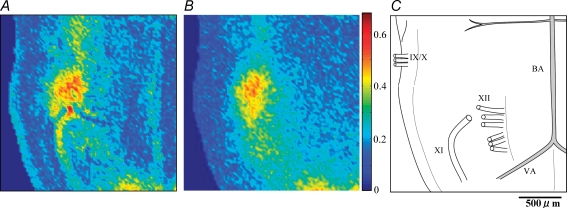
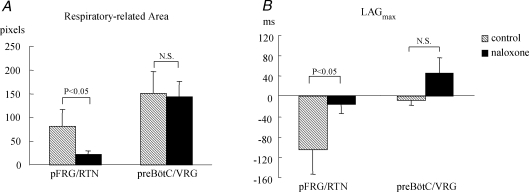
Naloxone increased respiratory frequency from 4.2 ± 0.7 min−1 (range 2.8–6.6 min−1) to 5.1 ± 0.8 min−1 (range 3.2–7.2 min−1; n = 5, P0–P1, P < 0.05), while the integrated C4VR amplitude decreased by 22 ± 4% (P < 0.05). Cross correlation coefficient images showed that naloxone diminished respiratory-related pixels in the pFRG/RTN area (Fig. 7A–C). The respiratory-related pixels in the pFRG/RTN decreased from 81 ± 35 pixels (range 12–177 pixels) to 22 ± 8 (range 7–45 pixels; n = 5, P0–P1, P < 0.05), whereas those in the preBötC/VRG area remained unchanged (150 ± 46 vs 142 ± 33, N.S.) by the administration of naloxone (Fig. 8A). The onset, the peak time and the peak value of fluorescent signals in the preBötC/VRG did not change significantly. In contrast, in 3 of 5 preparations, Pre-I activity became undetectable in the pFRG/RTN. The peak time and the peak value of excitation did not change significantly. The average LAGmax in the pFRG/RTN area increased from −105 ± 48 ms to −15 ± 19 ms (P < 0.05), while that in the preBötC/VRG did not change (−8 ± 10 ms versus 46 ± 30 ms) (Fig. 8B). These changes in spatiotemporal activation profiles by naloxone closely mimic those observed during the first few days after birth.
Figure 7.
Naloxone reduces respiratory neuronal activity within the pFRG/RTN area but not the preBötC/VRG area Correlation coefficient images before (A) and after (B) bath application of naloxone. The peaks of cross correlation function between C4VR activity and optical signal at each pixel were visualized by pseudocolour mapping. C, the orientation of the preparation is shown by the schematic drawing. IX/X, XI, XII, cranial nerves. BA, basilar artery; VA, vertebral artery.
Figure 8.
Naloxone delays the onset of the pFRG/RTN neurone activity and reduces the number of active neurones A, the respiratory-related pixels in the pFRG/RTN significantly decreased, whereas those in the preBötC/VRG area remained unchanged by the administration of naloxone. B, the average LAGmax of the pFRG/RTN area increased in all preparations (n = 5), indicating that the activity pattern shifted from preinspiratory to inspiratory.
Discussion
Developmental changes in spatiotemporal activation pattern
The present study reveals postnatal developmental changes in spatiotemporal activation profiles of the respiratory rhythm generators (RRGs). Changes in the activation pattern in the two key areas postulated to be critical for respiratory rhythmogenesis, i.e. the pFRG/RTN and the preBötC/VRG, are contrasting. Pre-I activity in the pFRG/RTN is evident in P0–P1 rats, and then rapidly decreases (P2–P4), resulting in inspiratory phase dominant activity, which is reflected in the changes in the index of activation timing LAGmax. On the other hand, inspiratory activity in the preBötC/VRG is robust and invariable throughout P0–P4.
Functional significance
Fluorescent signals in the pFRG area were detected several hundred milliseconds before those in the preBötC in P0–P1 rats using a similar optical imaging technique as ours (Onimaru & Homma, 2003), which the authors interpreted as evidence that the pFRG is the trigger site for inspiratory rhythm. Our results in P0–P1 rats are consistent with their finding. However, we have found that the spatiotemporal activation pattern in P2–P4 rats is different from that in P0–P1 rats and the Pre-I component of fluorescent signals in the pFRG/RTN is obscure in P2–P4 rats. However, it does not eliminate the possibility that it acts as a trigger to the preBötC, because our results could be just a reflection of a shortening of Pre-I activity and an increase in inspiratory activity in the pFRG. The Pre-I activity in older rats may be so small that our optical system cannot detect it (see ‘Technical considerations’).
We suggest that the reduction of pFRG/RTN activity in P2–P4 rats is, at least in part, related to changes in the level of endogenous opiates, which is elevated at birth and declines developmentally (Wardlaw et al. 1979; Jacquin et al. 1996), because DAMGO augmented Pre-I activity and naloxone-induced changes mimicked developmental changes of the spatiotemporal activity pattern in our experiments. Other mechanisms such as changes in intracellular chloride concentration may also be involved (Ritter & Zhang, 2000).
The ‘coupled oscillator hypothesis’, in which the respiratory rhythm is generated by two coupled anatomically distinct RRGs originated from experiments with frogs (Wilson et al. 2002), and was investigated for rats by Janczewski and Feldman (Janczewski et al. 2002; Janczewski & Feldman, 2006). In line with this hypothesis, they proposed a special role for the pFRG/RTN. According to their theory, the postnatal increase in opiate release (Jansen & Chernick, 1983) depresses the excitability of the preBötC but not that of the pFRG/RTN, allowing the latter to act as an ‘anti-apnoea’ centre that promotes breathing immediately after birth, either by rhythmically driving breathing or by providing the drive necessary to keep the preBötC rhythmic. Our results concerning the effects of DAMGO and naloxone on the pFRG/RTN support this concept. DAMGO increased the Pre-I activity in pFRG/RTN. Naloxone depressed the pFRG/RTN activity in P0–P1 rats, while preBötC/VRG activity remained unchanged. These results suggest that endogenous opiates act on the pFRG/RTN neuronal network and cause excitation or disinhibition of the pFRG/RTN at birth, which is counteracted by the administration of naloxone. It has been reported that the resting membrane potential and membrane resistance of Pre-I neurones are unchanged by opioid receptor agonists (Takeda et al. 2001). The mechanisms of how opiates affect the preBötC/VRG and pFRG/RTN remain to be elucidated.
The concept of an ‘anti-apnoea’ centre is also in agreement with the recent work by Onimaru et al. (2006). They transected brainstem spinal cord preparations at the level of the Xth cranial nerve root in order to separate the pFRG/RTN and preBötC/VRG regions. The C4VR activity in the caudal block recovered within 15 min, but the facial nerve activity in the rostral block remained inhibited. When DAMGO was applied, the C4VR activity was inhibited, and the rhythmic facial nerve activity recovered, which could have served as an alternative rhythm generator. Further, naloxone depressed the rhythm generation of putative Pre-I neurones in the rostral block without inducing any significant changes in membrane potentials, which is consistent with our results.
Technical considerations
Optical signals detected using a voltage-sensitive dye in the present study are changes in the fluorescence intensity, which have been reported to linearly and inversely correlate with changes in the membrane potential (Antic & Zecevic, 1995; Tominaga et al. 2000; Ziskind-Conhaim & Redman, 2005). However, optical signals reflect not only changes in the membrane potential of neurones but also those of glial cells (Kojima et al. 1999; Hülsmann et al. 2003). For example, within the areas where respiratory-neurones are densely distributed, there would be a synchronous release of the excitatory neurotransmitter glutamate, coincident with the burst activity of these neurones (Greer et al. 1991). The released glutamate activates the glial glutamate transporter GLT-1, where the transport of one glutamate anion is coupled to the cotransport of three Na+ and one H+ and to the countertransport of one K+ (Levy et al. 1998). This process evokes a net inward current across glial plasma membrane and membrane depolarization. Therefore, it must be noted that the optical signals detected in the present study may be partly originated from glial cells, although we could not differentiate the signals derived from neurones and glial cells.
Given that the dye is added to the superfusate when staining the preparation, there should be a concentration gradient in the preparation from the surface. We evaluated the penetration of the dye by transecting the brainstem after an experiment and observing the cut surface of the preparation, and verified that the tissue up to at a depth of 500–700 μm was well dyed. However, the medullary tissue environment (tissue  and pH) in the preparation we used is in the physiological range only up to 500 μm from the surface (Okada et al. 1993). Therefore, we estimate that our optical measurement detects cellular activity at most up to 500 μm deep from the surface. With the magnification we chose, one pixel corresponded to ∼35 μm × 35 μm. It means that the optical signal of each pixel represents summated changes in membrane potential of possibly heterogeneous cell populations. We think that this heterogeneity decreases the signal-to-noise ratio of fluorescent signals originated from respiratory-related neurones. In such situations, the cross correlation method is a useful technique for mapping respiratory-related areas.
Since Pre-I neurones are detected by whole-cell patch recording in neonatal rats up to 4 days old (Arata et al. 1998), the observed decrease in active pixels in the pFRG/RTN could be due to myelination or uneven distribution of membrane-bound dye. However, this is unlikely because of the following reasons. First, active pixels in the preBötC/VRG remain unchanged. Second, we observed not only changes in active areas but also changes in activation timing in the pFRG/RTN area. Another possibility is that the location of cells visible at P0–P1 becomes too deep at P2–P4 to image due to the growth of the medulla. However, this is also unlikely because preBötC/VRG is situated much deeper from the ventral surface than pFRG/RTN (Koshiya & Smith, 1999; Onimaru & Homma, 2003; McCrimmon et al. 2004), but there is no reduction of the number of respiratory-related pixels in the preBötC/VRG. In older preparations, pFRG Pre-I neurones show a short burst before phrenic inspiration and a longer one after inspiration (Janczewski et al. 2002). It is possible that in the older preparations the short burst of Pre-I activity is missed by the optical detection because it is so short.
Distributions of inspiratory and Pre-I neurones overlap in the rostral ventrolateral medulla (Arata et al. 1990), which corresponds to the caudal part of the pFRG. The medial portion of the pFRG may overlap with the RTN (Onimaru & Homma, 2003), a likely central chemoreceptor site (Pearce et al. 1989; Smith et al. 1989; Connelly et al. 1990; Okada et al. 2002; Guyenet et al. 2005). Activities of some RTN neurones are respiratory modulated, with inspiratory, postinspiratory and expiratory patterns (Okada et al. 1993; Guyenet et al. 2005). Age-related changes in activation pattern observed in the present study may reflect changes in the relative proportion of Pre-I and other types of neurones.
In conclusion, significant reorganization of the respiratory neuronal network occurs at P1–P2 in rats. The synchronization between the pFRG/RTN and preBötC/VRG optical signals is much closer in P2–P4 than in P0–P1. Mechanisms underlying this developmental change in spatiotemporal activity remain to be further elucidated, especially in relation to opiate actions on pFRG and preBötC neurones.
Acknowledgments
We thank S. Kojima for technical assistance and R. Ueno for secretarial work.
Supplementary material
Online supplemental material for this paper can be accessed at:
http://jp.physoc.org/cgi/content/full/jphysiol.2007.138180/DC1 and http://www.blackwell-synergy.com/doi/suppl/10.1113/jphysiol.2007.138180
References
- Antic S, Zecevic D. Optical signals from neurones with internally applied voltage-sensitive dyes. J Neurosci. 1995;15:1392–1405. doi: 10.1523/JNEUROSCI.15-02-01392.1995. [DOI] [PMC free article] [PubMed] [Google Scholar]
- Arata A, Onimaru H, Homma I. Respiration-related neurones in the ventral medulla of newborn rats in vitro. Brain Res Bul. 1990;24:599–604. doi: 10.1016/0361-9230(90)90165-v. [DOI] [PubMed] [Google Scholar]
- Arata A, Onimaru H, Homma I. The adrenergic modulation of firings of respiratory rhythm-generating neurones in medulla-spinal cord preparation from newborn rat. Exp Brain Res. 1998;119:399–408. doi: 10.1007/s002210050355. [DOI] [PubMed] [Google Scholar]
- Connelly CA, Ellenberger HH, Feldman JL. Respiratory activity in retrotrapezoid nucleus in cat. Am J Physiol Lung Cell Mol Physiol. 1990;258:L33–L44. doi: 10.1152/ajplung.1990.258.2.L33. [DOI] [PubMed] [Google Scholar]
- Duffin J, Hoskin RW. Intracellular recordings from upper cervical inspiratory neurons in the cat. Brain Res. 1987;435:351–354. doi: 10.1016/0006-8993(87)91623-4. [DOI] [PubMed] [Google Scholar]
- Ezure K. Reflections on respiratory rhythm generation. Prog Brain Res. 2004;143:67–74. doi: 10.1016/S0079-6123(03)43007-0. [DOI] [PubMed] [Google Scholar]
- Feldman JL, Del Negro CA. Looking for inspiration: new perspectives on respiratory rhythm. Nat Rev Neurosci. 2006;7:232–242. doi: 10.1038/nrn1871. [DOI] [PMC free article] [PubMed] [Google Scholar]
- Feldman JL, Janczewski WA. Point: Counterpoint: the parafacial respiratory group (pFRG)/pre-Bötzinger complex (preBötC) is the primary site of respiratory rhythm generation in the mammal. Counterpoint: the preBötC is the primary site of respiratory rhythm generation in the mammal. J Appl Physiol. 2006;100:2096–2097. doi: 10.1152/japplphysiol.00119.2006. [DOI] [PubMed] [Google Scholar]
- Feldman JL, Mitchell GS, Nattie EE. Breathing: rhythmicity, plasticity, chemosensitivity. Annu Rev Neurosci. 2003;26:239–266. doi: 10.1146/annurev.neuro.26.041002.131103. [DOI] [PMC free article] [PubMed] [Google Scholar]
- Fisher JA, Marchenko VA, Yodh AG, Rogers RF. Spatiotemporal activity patterns during respiratory rhythmogenesis in the rat ventrolateral medulla. J Neurophysiol. 2006;95:1982–1991. doi: 10.1152/jn.00674.2005. [DOI] [PubMed] [Google Scholar]
- Fukuda K, Okada Y, Yoshida H, Aoyama R, Nakamura M, Chiba K, Toyama Y. Ischemia-induced disturbance of neural network function in the rat spinal cord analyzed by voltage-imaging. Neuroscience. 2006;140:1453–1465. doi: 10.1016/j.neuroscience.2006.03.034. [DOI] [PubMed] [Google Scholar]
- Greer JJ, Funk GD, Ballanyi K. Preparing for the first breath: prenatal maturation of respiratory neural control. J Physiol. 2006;570:437–444. doi: 10.1113/jphysiol.2005.097238. [DOI] [PMC free article] [PubMed] [Google Scholar]
- Greer JJ, Smith JC, Feldman JL. Role of excitatory amino acids in the generation and transmission of respiratory drive in neonatal rat. J Physiol. 1991;437:727–749. doi: 10.1113/jphysiol.1991.sp018622. [DOI] [PMC free article] [PubMed] [Google Scholar]
- Guyenet PG, Mulkey DK, Stornetta RL, Bayliss DA. Regulation of ventral surface chemoreceptors by the central respiratory pattern generator. J Neurosci. 2005;25:8938–8947. doi: 10.1523/JNEUROSCI.2415-05.2005. [DOI] [PMC free article] [PubMed] [Google Scholar]
- Hazinski TA, Grunstein MM, Schlueter MA, Tooley WH. Effect of naloxone on ventilation in newborn rabbits. J Appl Physiol. 1981;50:713–717. doi: 10.1152/jappl.1981.50.4.713. [DOI] [PubMed] [Google Scholar]
- Hülsmann S, Straub H, Richter DW, Speckmann EJ. Blockade of astrocytes causes stimulation-induced depolarization as revealed by voltage sensitive dyes in mouse brainstem slices. Exp Brain Res. 2003;150:117–121. doi: 10.1007/s00221-003-1410-z. [DOI] [PubMed] [Google Scholar]
- Jacquin TD, Borday V, Schneider-Maunoury S, Topilko P, Ghilini G, Kato F, Charnay P, Champagnat J. Reorganization of pontine rhythmogenic neuronal networks in Krox-20 knockout mice. Neuron. 1996;17:747–758. doi: 10.1016/s0896-6273(00)80206-8. [DOI] [PubMed] [Google Scholar]
- Janczewski WA, Feldman JL. Distinct rhythm generators for inspiration and expiration in the juvenile rat. J Physiol. 2006;570:407–420. doi: 10.1113/jphysiol.2005.098848. [DOI] [PMC free article] [PubMed] [Google Scholar]
- Janczewski WA, Onimaru H, Homma I, Feldman JL. Opioid-resistant respiratory pathway from the preinspiratory neurones to abdominal muscles: in vivo and in vitro study in the newborn rat. J Physiol. 2002;545:1017–1026. doi: 10.1113/jphysiol.2002.023408. [DOI] [PMC free article] [PubMed] [Google Scholar]
- Jansen AH, Chernick V. Development of respiratory control. Physiol Rev. 1983;63:437–483. doi: 10.1152/physrev.1983.63.2.437. [DOI] [PubMed] [Google Scholar]
- Kojima S, Nakamura T, Nidaira T, Nakamura K, Ooashi N, Ito E, Watase K, Tanaka K, Wada K, Kudo Y, Miyakawa H. Optical detection of synaptically induced glutamate transport in hippocampal slices. J Neurosci. 1999;19:2580–2588. doi: 10.1523/JNEUROSCI.19-07-02580.1999. [DOI] [PMC free article] [PubMed] [Google Scholar]
- Koshiya N, Smith JC. Neuronal pacemaker for breathing visualized in vitro. Nature. 1999;400:360–363. doi: 10.1038/22540. [DOI] [PubMed] [Google Scholar]
- Levy LM, Warr O, Attwell D. Stoichiometry of the glial glutamate transporter GLT-1 expressed inducibly in a Chinese hamster ovary cell line selected for low endogenous Na+-dependent glutamate uptake. J Neurosci. 1998;18:9620–9628. doi: 10.1523/JNEUROSCI.18-23-09620.1998. [DOI] [PMC free article] [PubMed] [Google Scholar]
- McCrimmon DR, Alheid GF, Jiang M, Calandriello T, Topgi A. Converging functional and anatomical evidence for novel brainstem respiratory compartments in the rat. Adv Exp Med Biol. 2004;551:101–105. doi: 10.1007/0-387-27023-x_16. [DOI] [PubMed] [Google Scholar]
- Nakazono Y, Aoki M. Excitatory connections between upper cervical inspiratory neurons and phrenic motoneurons in cats. J Appl Physiol. 1994;77:679–683. doi: 10.1152/jappl.1994.77.2.679. [DOI] [PubMed] [Google Scholar]
- Okada Y, Chen Z, Jiang W, Kuwana S, Eldridge FL. Anatomical arrangement of hypercapnia-activated cells in the superficial ventral medulla of rats. J Appl Physiol. 2002;93:427–439. doi: 10.1152/japplphysiol.00620.2000. [DOI] [PubMed] [Google Scholar]
- Okada Y, Kuwana S, Kawai A, Mückenhoff K, Scheid P. Significance of extracellular potassium in central respiratory control studied in the isolated brainstem-spinal cord preparation of the neonatal rat. Respir Physiol Neurobiol. 2005;146:21–32. doi: 10.1016/j.resp.2004.10.009. [DOI] [PubMed] [Google Scholar]
- Okada Y, Mückenhoff K, Holtermann G, Acker H, Scheid P. Depth profiles of pH and PO2 in the isolated brain stem-spinal cord of the neonatal rat. Respir Physiol. 1993;93:315–326. doi: 10.1016/0034-5687(93)90077-n. [DOI] [PubMed] [Google Scholar]
- Onimaru H, Arata A, Homma I. Primary respiratory rhythm generator in the medulla of brainstem-spinal cord preparation from newborn rat. Brain Res. 1988;445:314–324. doi: 10.1016/0006-8993(88)91194-8. [DOI] [PubMed] [Google Scholar]
- Onimaru H, Homma I. A novel functional neuron group for respiratory rhythm generation in the ventral medulla. J Neurosci. 2003;23:1478–1486. doi: 10.1523/JNEUROSCI.23-04-01478.2003. [DOI] [PMC free article] [PubMed] [Google Scholar]
- Onimaru H, Homma I. Developmental changes in the spatio-temporal pattern of respiratory neuron activity in the medulla of late fetal rat. Neuroscience. 2005;131:969–977. doi: 10.1016/j.neuroscience.2004.11.041. [DOI] [PubMed] [Google Scholar]
- Onimaru H, Homma I. Point: Counterpoint: the parafacial respiratory group (pFRG)/pre-Bötzinger complex (preBötC) is the primary site of respiratory rhythm generation in the mammal. Point: the PFRG is the primary site of respiratory rhythm generation in the mammal. J Appl Physiol. 2006;100:2094–2095. doi: 10.1152/japplphysiol.00119.2006. [DOI] [PubMed] [Google Scholar]
- Onimaru H, Kumagawa Y, Homma I. Respiration-related rhythmic activity in the rostral medulla of newborn rats. J Neurophysiol. 2006;96:55–61. doi: 10.1152/jn.01175.2005. [DOI] [PubMed] [Google Scholar]
- Paton JF, Ramirez JM, Richter DW. Mechanisms of respiratory rhythm generation change profoundly during early life in mice and rats. Neurosci Lett. 1994;170:167–170. doi: 10.1016/0304-3940(94)90265-8. [DOI] [PubMed] [Google Scholar]
- Pearce RA, Stornetta RL, Guyenet PG. Retrotrapezoid nucleus in the rat. Neurosci Lett. 1989;101:138–142. doi: 10.1016/0304-3940(89)90520-x. [DOI] [PubMed] [Google Scholar]
- Potts JT, Paton JF. Optical imaging of medullary ventral respiratory network during eupnea and gasping in situ. Eur J Neurosci. 2006;23:3025–3033. doi: 10.1111/j.1460-9568.2006.04809.x. [DOI] [PubMed] [Google Scholar]
- Ritter B, Zhang W. Early postnatal maturation of GABAA-mediated inhibition in the brainstem respiratory rhythm-generating network of the mouse. Eur J Neurosci. 2000;12:2975–2984. doi: 10.1046/j.1460-9568.2000.00152.x. [DOI] [PubMed] [Google Scholar]
- Smith JC, Ellenberger HH, Ballanyi K, Richter DW, Feldman JL. Pre-Bötzinger complex: a brainstem region that may generate respiratory rhythm in mammals. Science. 1991;254:726–729. doi: 10.1126/science.1683005. [DOI] [PMC free article] [PubMed] [Google Scholar]
- Smith JC, Morrison DE, Ellenberger HH, Otto MR, Feldman JL. Brainstem projections to the major respiratory neuron populations in the medulla of the cat. J Comp Neurol. 1989;281:69–96. doi: 10.1002/cne.902810107. [DOI] [PubMed] [Google Scholar]
- Takeda S, Eriksson LI, Yamamoto Y, Joensen H, Onimaru H, Lindahl SG. Opioid action on respiratory neuron activity of the isolated respiratory network in newborn rats. Anesthesiology. 2001;95:740–749. doi: 10.1097/00000542-200109000-00029. [DOI] [PubMed] [Google Scholar]
- Tian GF, Duffin J. Connections from upper cervical inspiratory neurons to phrenic and intercostal motoneurons studied with cross-correlation in the decerebrate rat. Exp Brain Res. 1996;110:196–204. doi: 10.1007/BF00228551. [DOI] [PubMed] [Google Scholar]
- Tominaga T, Tominaga Y, Yamada H, Matsumoto G, Ichikawa M. Quantification of optical signals with electrophysiological signals in neural activities of Di-4-ANEPPS stained rat hippocampal slices. J Neurosci Meth. 2000;102:11–23. doi: 10.1016/s0165-0270(00)00270-3. [DOI] [PubMed] [Google Scholar]
- Wardlaw SL, Stark RI, Baxi L, Frantz AG. Plasma beta-endorphin and beta-lipotropin in the human fetus at delivery: correlation with arterial pH and PO2. J Clin Endocrinol Metab. 1979;49:88–91. doi: 10.1210/jcem-49-6-888. [DOI] [PubMed] [Google Scholar]
- Wilson RJA, Vasilakos K, Harris MB, Straus C, Remmers JE. Evidence that ventilatory rhythmogenesis in the frog involves two distinct neuronal oscillators. J Physiol. 2002;540:557–570. doi: 10.1113/jphysiol.2001.013512. [DOI] [PMC free article] [PubMed] [Google Scholar]
- Ziskind-Conhaim L, Redman S. Spatiotemporal patterns of dorsal root-evoked network activity in the neonatal rat spinal cord: optical and intracellular recordings. J Neurophysiol. 2005;94:1952–1961. doi: 10.1152/jn.00209.2005. [DOI] [PubMed] [Google Scholar]
Associated Data
This section collects any data citations, data availability statements, or supplementary materials included in this article.


