Abstract
Higher cortical functions (perception, cognition, learning and memory) are in large part based on the integration of electrical and calcium signals that takes place in thin dendritic branches of neocortical pyramidal cells (synaptic integration). The mechanisms underlying the synaptic integration in thin basal dendrites are largely unexplored. We use a recently developed technique, multisite voltage–calcium imaging, to compare voltage and calcium transients from multiple locations along individual dendritic branches. Our results reveal characteristic electrical transients (plateau potentials) that trigger and shape dendritic calcium dynamics and calcium distribution during suprathreshold glutamatergic synaptic input. We regularly observed three classes of voltage–calcium interactions occurring simultaneously in three different zones of the same dendritic branch: (1) proximal to the input site, (2) at the input site, and (3) distal to the input site. One hundred micrometers away from the synaptic input site, both proximally and distally, dendritic calcium transients are in tight temporal correlation with the dendritic plateau potential. However, on the same dendrite, at the location of excitatory input, calcium transients outlast local dendritic plateau potentials by severalfold. These Ca2+ plateaus (duration 0.5–2 s) are spatially restricted to the synaptic input site, where they cause a brief down-regulation of dendritic excitability. Ca2+ plateaus are not mediated by Ca2+ release from intracellular stores, but rather by an NMDA-dependent small-amplitude depolarization, which persists after the collapse of the dendritic plateau potential. These unique features of dendritic voltage and calcium distributions may provide distinct zones for simultaneous long-term (bidirectional) modulation of synaptic contacts along the same basal branch.
Current theories of dendritic physiological function and integration of synaptic potentials are mostly based on findings from electrical recordings performed in thick apical dendrites (Johnston et al. 1996; Hausser et al. 2000). The trunk of an apical dendrite, however, represents just a small fraction of the pyramidal dendritic tree. A major fraction of the neuronal membrane resides within thin dendritic branches, in basal and oblique dendrites. Judging by the number and density of the dendritic spines, glutamatergic excitatory synaptic contacts are distributed throughout the entire length of a basal dendrite (Ballesteros-Yanez et al. 2006). Synchronized activation of one subset of neighbouring synaptic contacts may therefore generate a strong localized depolarization anywhere on a dendrite. Electrical signals generated in one part of the dendrite may or may not propagate along the dendrite toward the soma or, distally, toward the dendritic tip. In the absence of experimental measurements one cannot predict how synaptically evoked depolarizations in the middle part of the dendrite might affect membrane potential and Ca2+ influx in the distal dendritic tip, for instance. Also, it is not yet known whether the same rules of synaptic integration apply to proximal, middle and distal segments of basal and oblique dendrites.
Understanding the spatial distribution of synaptically evoked dendritic electrical transients in basal and oblique dendrites is valuable for three reasons. First, these thin dendritic branches receive > 2/3 of the total cortical excitatory synaptic input (Gilbert & Wiesel, 1979; Larkman, 1991). According to the modern view, dendrites perform the first stage of synaptic integration (Poirazi et al. 2003; Polsky et al. 2004). Second, the basal dendrites of pyramidal neurons are almost exclusively the major recipients of excitatory synaptic contacts that are involved in ‘recurrent excitation’, which is thought to represent a cellular substrate of working memory (Goldman-Rakic, 1995; Compte et al. 2000; Durstewitz et al. 2000). Third, basal dendrites express voltage-gated Ca2+ channels (Westenbroek et al. 1992) and exhibit substantial Ca2+ transients that can mediate synaptic plasticity (Linden, 1999).
Calcium ions accumulate in basal and oblique dendrites as a consequence of action potential (AP) backpropagation (Schiller et al. 1995), the activation of glutamate receptors (Regehr & Tank, 1992) or Ca2+ release from intracellular stores (Emptage et al. 1999; Nakamura et al. 1999). Synaptically induced changes in internal Ca2+ concentration can be very localized, sometimes involving small 10–20 μm long dendritic segments (Schiller et al. 2000; Holthoff et al. 2004; Kaiser et al. 2004) or even individual dendritic spines (Koester & Sakmann, 1998; Takechi et al. 1998; Mainen et al. 1999). Measuring dendritic free Ca2+ is useful, because Ca2+ is a fundamental intracellular messenger involved in synaptic plasticity, learning and memory (Augustine et al. 2003). But, measuring Ca2+ exclusively is no longer sufficient to answer the vital questions about the electrical events which trigger, sculpt and terminate calcium surges in different dendritic regions (Wei et al. 2001; Larkum et al. 2003; Sjostrom & Hausser, 2006). For example, when a postsynaptic calcium signal is localized in a ∼20 μm segment of a basal dendrite, as reported by Schiller et al. (2000) and Holthoff et al. (2004), does that mean that the underlying dendritic potential is spatially restricted in a similar fashion?
Suprathreshold excitatory synaptic inputs can provide enough depolarizing current to keep the cell body in a sustained depolarized state lasting several hundred milliseconds (Oakley et al. 2001). What is the time course of an electrical transient taking place in the middle of a basal dendrite, at the point of strong (suprathreshold) excitatory input? How does the time course of this electrical signal compare and correlate with the Ca2+ transient in the same dendritic segment? To investigate the electrical transients that underlie the complex spatial profile of Ca2+ signals in distal dendritic segments, we used a cocktail containing a calcium-sensitive dye and a voltage-sensitive dye to measure both the Ca2+ and voltage transients from the same neuron. Using different stimulation protocols, pharmacological agents and simultaneous electrical and multisite optical recordings, we have characterized the membrane mechanisms that are activated in the basilar dendritic tree by strong glutamatergic synaptic drive. These same mechanisms might contribute depolarizing current to the sustained depolarized state, previously observed in the rat prefrontal cortex in vivo (Branchereau et al. 1996; Lewis & O'Donnell, 2000).
Methods
Electrophysiology and dye injections
Sprague–Dawley rats (postnatal day 21–42) were deeply anaesthetized by inhalation of halothane or isoflurane, and then swiftly decapitated, according to institutional guidelines. The experiments were approved by the Yale University Institutional Animal Care and Use Committee (IACUC).
All experiments were carried out in coronal 300 μm-thick brain slices harvested from the medial prefrontal cortex. For recordings, dissection and storage of slices, an ACSF solution was used containing (mm): 125 NaCl, 26 NaHCO3, 1.26 KH2PO4, 2.3 KCl, 10 glucose, 2 CaCl2, and 1 MgSO4, equilibrated with 95% O2–5% CO2, pH 7.4. Slices were incubated at 35°C for 45 min and subsequently stored at room temperature. All measurements were performed at 33–34°C. Intracellular solution contained (mm): 135 potassium gluconate, 2 MgCl2, 3 Na-phosphocreatine, 3 Na2ATP, 0.3 Na2GTP, Hepes 10, pH 7.3 with KOH (final 290 mosmol l−1). Patch pipettes were formed on a Sutter Instruments (Novato, CA, USA) P-97 microelectrode puller from borosilicate glass (G150F-3, Warner Instruments, Hamden, CT, USA). Whole-cell recordings from layer 5 pyramidal neurons were carried out using a Multiclamp 700A amplifier (Axon Instruments, Union City, CA, USA) and digitized with two input boards: (1) Digidata Series 1322A (Axon Instruments) at a 5 kHz sampling rate and (2) Neuroplex (RedShirtImaging, Atlanta, GA, USA) at a 1 kHz sampling rate. Only cells having a membrane potential more hyperpolarized than −50 mV (not corrected for liquid junction potential) and AP amplitudes > 60 mV (measured from the base line) were included in the study. Voltage-sensitive dye (JPW1114) and calcium-sensitive dyes (Ca-Green-1, bis-fura-2, and Fluo-5F), as well as Alexa Fluor 594, were purchased form Molecular Probes, dissolved in intracellular solution, and injected into the cell bodies of layer 5 pyramidal neurons via a 7 MΩ patch pipette. For voltage–calcium imaging, JPW1114 (400 μm) and bis-fura-2 (200 μm) were both loaded into the same pipette. To prevent background fluorescence, a dye-free solution was used in the tip of the patch pipette. To prevent toxicity, the present concentration of JPW1114 was substantially lower than that used previously (Antic, 2003). Neutral density filters were used to reduce the intensity of epi-illumination light during positioning and focusing. Duration of illumination epochs were kept to minimum: Ca2+ imaging 2500–5000 ms; voltage imaging 500–2500 ms. In spite all precautions, after ∼16 optical recording sweeps, on average, neurons began to show an increase in AP half-width. At that point experiments were stopped. In calcium imaging experiments with Ca-Green-1 (200 μm) or Fluo-5F (200 μm), Alexa-fluor 594 (80 μm) was included in the intracellular solution to aid the visually guided dendritic stimulations.
Drug applications
Ruthenium red (cat. R2751), ryanodine (cat. R6017), heparin (cat. H0777) and thapsigargin (cat. T9033) were purchased from Sigma (St Louis, MO, USA). Ruthenium red and heparin were dissolved directly in the intracellular solution. Ryanodine and thapsigargin were first dissolved in a mixture of ethanol and DMSO (10: 1), and then added to the physiological solution. Each intracellularly applied drug was mixed with bis-fura-2 (200 μm) (and Alexa Fluor 594 (80 μm)) and loaded into the whole-cell pipette at a final concentration of 1300 μm for ruthenium red, 40 μm for ryanodine, and 2–4 mg ml−1 for heparin. The mixture of the drug and the fluorescent dyes was allowed to diffuse in the whole-cell configuration for at least 25 min before measurements of glutamate-evoked calcium plateaus were made. Thapsigargin (10 μm) was prepared in regular ACSF and loaded into 7 MΩ pipettes. With the aid of infrared and fluorescence video-microscopy, the tips of thapsigargin-loaded pipettes were positioned 15–20 μm from the dendritic shaft, just opposite the glutamate-filled pipette. Pressure pulses (duration 15–30 s) were applied to the pipette with a syringe. The thapsigargin pulse was stopped 2 s before onset of the glutamate pulse.
dl-2-Amino-5-phosphonopentanoic acid (APV), ω-conotoxin (ω-conotoxin MVIIA), verapamil ((±)-verapamil hydrochloride); diltiazem ((+)-cis-diltiazem hydrochloride), and (±)-α-methyl-(4-carboxyphenyl) glycine (MCPG) were purchased from Sigma. Verapamil and diltiazem stock solutions were made using ethanol, so that the final concentration of ethanol in the bath did not exceed 0.01%.
Stimulations
Synaptic stimulation pipettes (7 MΩ) were filled with regular ACSF and glutamate stimulation pipettes (40 MΩ) were filled with 200 mm sodium glutamate (pH 9). Following the spread of fluorescent dyes into the dendrites, stimulation pipettes were positioned in mid-regions of basal branches, at an average distance of 97 ± 4.5 μm from the cell body (n = 18). Navigation of the flexible glass pipettes through the slice tissue was achieved with the aid of a ‘fourth axis’ (concomitant engagement of both X and Z axis), available on the Sutter Instruments M-285 motorized micromanipulator. The intensities of current pulses for synaptic stimulation (5 pulses, 50 Hz, 100 μs, 50–90 μA), or of single glutamate microiontophoresis puffs (5 ms, 0.9–2.5 μA), were adjusted to produce a long-lasting somatic depolarization (half-width 200–500 ms) crowned by two to six sodium action potentials (UP-state-like depolarization, Fig. 2B and C, insets). We use the term ‘target-dendrite’ to indicate the dendritic branch targeted by the stimulation pipette, whereas the term ‘non-target dendrite’ was used for all other dendritic branches in the visual field.
Figure 2. Dendritic Ca2+ transients during the in vitro evoked sustained depolarization.
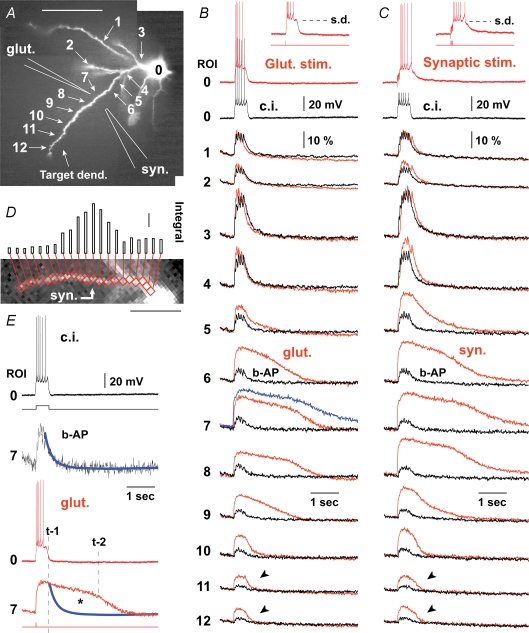
A, layer 5 pyramidal cell filled with Fluo-5F and Alexa-fluor 594. Schematic drawings mark the positions of glass pipettes used for glutamate iontophoresis (glut.) and synaptic stimulation (syn.). B, red: glutamate-evoked Ca2+ transients from 12 regions of interest (ROI) are aligned with the somatic whole-cell recording (ROI 0). Glutamate pulse duration 5 ms, intensity 2.4 μA. Blue trace: synaptically evoked transient from the same dendritic segment, copied from C to show that signal was not saturated during glutamate stimulation. Black: in the next sweep the cell was stimulated with direct current injection (c.i.). The stimulus parameters were adjusted to trigger the same number of action potentials as in the synaptic stimulation trial. ‘b-AP’ marks calcium signals evoked by backpropagating action potentials. C, red: same as in B except neuron was stimulated extracellularly (5 pulses, 50 Hz) to generate sustained depolarization (s.d., inset). Black: direct current injection into the cell body was used to produce a matching burst of action potentials (truncated). D, time integral of calcium signal (amplitude (ΔF/F) × duration (ms)) plotted at 21 adjacent recording sites along the target dendrite. Red boxes mark 2 × 2 pixel bins (spatial averaging) used to create the integral histogram. Scale = 2000%ms. E, same data as in B ROI 7 except Ca2+ transients are scaled to the same amplitude. Thick blue line: exponential fit through Ca2+ decay phase. τ = 135 ms. Dashed line: ‘t-1’ marks the breakdown of the somatic membrane potential. Line ‘t-2’ marks the breakdown of Ca2+ plateau. Asterisk marks Ca2+ accumulation which takes place after the collapse of the somatic electrical signal.
Voltage–calcium imaging
Multi-site dendritic imaging was performed on a Zeiss Axioskop 2FS microscope equipped with a UV-friendly 40× objective, two camera ports and a low-ripple light source for epi-illumination (xenon 250 W arc lamp; OptiQuip, Highland Mills, NY, USA). A Dage IR-1000 CCD camera was used for infrared video microscopy, while functional dendritic imaging was performed with a NeuroCCD camera (80 × 80 pixels, RedShirtImaging, LLC, Atlanta, GA, USA). Optical signals were sampled at a 200 Hz or 1000 Hz frame rate. Optical filters were purchased form Chroma Technology (Rockingham, VT, USA) and Omega Optical (Brattleboro, VT, USA). The filter set (cube) for Fluo-5F in Figs 1–3 consisted of a Chroma exciter 480/60x (450–510 nm bandpass), dichroic 515DCXR and emitter Q530lp (530 nm longpass). The filter set (cube) for Fluo-5F in Figs 5–7 consisted of an Omega exciter 500AF25 (485–510 nm bandpass), dichroic 525DRLP and emitter 530ALP (530 nm longpass). Filters for Alexa Fluor 594 were a Chroma exciter HQ580/20x (570–590 nm bandpass), dichroic Q595LP and emitter HQ630/60m (600–660 nm bandpass). The filter cube for Ca-Green-1 contained an Omega exciter 500AF25, dichroic 525DRLP and emitter 530ALP. The filter set for voltage imaging (JPW1114) consisted of a Chroma exciter D510/60 (480–540 nm bandpass), dichroic 570dcxru and emitter E600lp (600 nm longpass). The filter cube for bis-fura-2 contained a Chroma exciter D380/30x (365–395 nm bandpass), dichroic 400dclp and emitter E470lp (470 nm longpass). In voltage–calcium imaging experiments, optical signals were first recorded with one filter set (cube) and then, within 60 s, the experimenter would change the filter cube and repeat the recording. All the stimulus parameters (location, intensity, and duration) were kept the same during both recordings. At the end of each recording session optical measurements were repeated in the absence of stimulation. This generated traces which were used for off-line bleach compensation (subtraction). The experimental design for true simultaneous voltage–calcium imaging was developed previously and used for recording population signals in brain slices (Sinha & Saggau, 1999). That report provided a list of studies where two parameters of cellular activity were recorded optically from the same preparation, using two fluorescent dyes.
Figure 1. Somatic plateau depolarizations and dendritic Ca2+ transients.
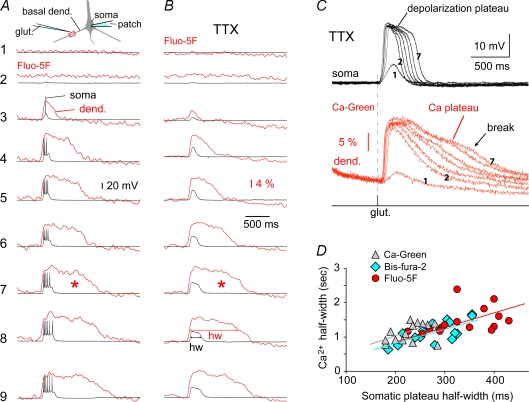
A, basal dendrites of layer 5 pyramidal cells were stimulated by glutamate microiontophoresis (glut.) as shown schematically in the inset. In 9 subsequent sweeps (1–9) the intensity of glutamate iontophoretic current was increased in equal steps (0.1 μA). Somatic Vm was measured with the patch pipette (soma), while the dendritic calcium signal (dend.) was simultaneously measured at the stimulation site using intracellularly injected Fluo-5F dye. B, same as in A except TTX (1 μm) was added in the bath to block APs. Asterisk marks strong Ca2+ signal occurring after the collapse of plateau potential. C, same as in B except Ca-Green-1 was used intracellularly. Sampling rate 1 kHz. D, half-width (hw) of the Ca2+ plateau was plotted against the half-width of the somatic plateau depolarization for neurons filled with either Ca-Green-1 (n = 14), bis-fura-2 (n = 18) or Fluo-5F (n = 15). Linear fits for each group of cells are included.
Figure 3. Spatial distribution of Ca2+ transients.
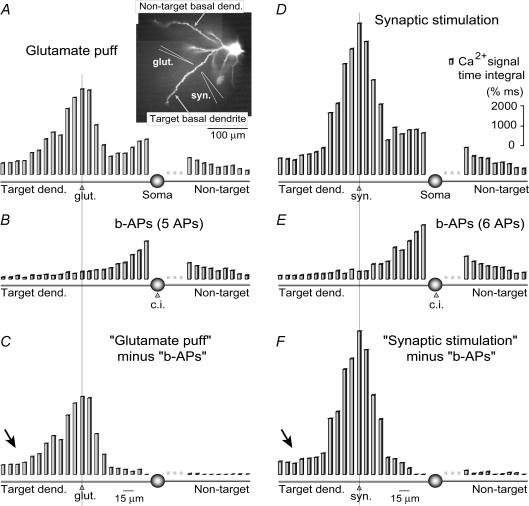
A, glutamatergic stimulation. In this and all the following panels, the time-integral (amplitude × duration) of the dendritic calcium signal was plotted along two basal dendrites (inset). Twenty-one adjacent ‘2 × 2 pixel bins’ were selected along the target branch (see example in Fig. 2D) and another 12 bins along the non-target basal dendrite. Inset: positions of stimulating pipettes. B, calcium pattern induced by a matching burst of backpropagating action potentials (b-APs). C, integrals presented in B were subtracted from corresponding integrals in A. D, same as in A except, instead of the glutamate puff, synaptic stimulation (5 pulses, 50 Hz) was used to elicit the sustained depolarization episode, crowned with 6 action potentials (see Fig. 2C). E, a matching burst of action potentials (6 APs) triggered a qualitatively and quantitatively different dendritic calcium influx than that shown in D. F, integrals presented in E were subtracted from corresponding integrals presented in D. Arrow marks a difficult-to-explain arithmetic difference between action potential-associated and plateau potential-associated dendritic calcium signals in the most distal regions of the target basal branch. Vertical lines mark the stimulation sites.
Figure 5. Internal calcium release does not mediate Ca2+ plateau signals.
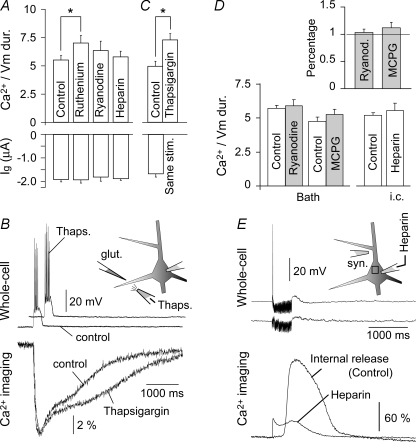
A, top, the duration ratio between Ca2+ transients at the glutamate-stimulation site and the somatic plateau depolarization was determined in drug-free neurons (control, n = 14), as well as in neurons patched with either ruthenium red (1300 μm; n = 4), or ryanodine (40 μm; n = 4) or heparin (4 mg ml−1; n = 4). Bottom, average intensity of glutamate iontophoretic current (Ig). B, glutamate-evoked Ca2+ signal was recorded before (control) and after a local puff (15 s) of thapsigargin (10 μm) from the glass pipette (n = 5). The positions of glutamate and thapsigargin pipettes are shown schematically in the inset. Respective simultaneous whole-cell recordings are displayed above dendritic Ca2+ signals. C, same as in A, except thapsigargin was applied extracellularly. D, left, bath application of ryanodine (5 μm) or MCPG (250 μm) does not affect Ca2+/voltage duration ratio. Inset, for each individual neuron treated with bath application of ryanodine or MCPG, the drug-induced change in Ca2+/voltage duration ratio was first normalized in respect to control obtained on the same neuron, and then averaged. Right, experiments with intracellular injection of heparin were repeated on the entire new set of control (n = 14) and (n = 5) test neurons. E, synaptic stimulation protocol (100 Hz, 0.5 s) which regularly induces internal release in control neurons fails in neurons injected with heparin (2 mg ml−1).
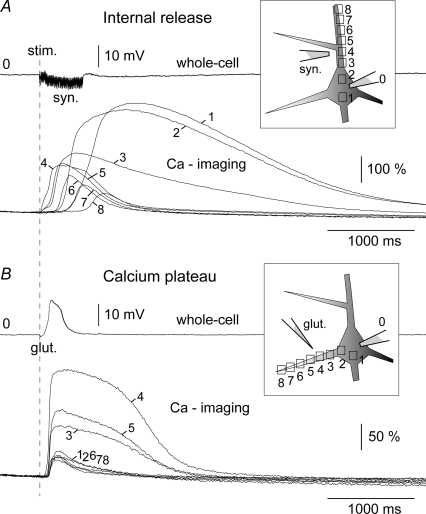
Figure 7. Differences in spatio-temporal dynamics between the internal Ca2+ release and Ca2+ plateau.
Multi-site dendritic Ca2+ imaging (Fluo-5F) reveals complex spatio-temporal profile of synaptically evoked internal release (A) and glutamate-evoked Ca2+ plateau (B). Dashed vertical line marks the onset of synaptic stimulation train (duration 500 ms) in A, as well as the onset of a single glutamate pulse (duration 5 ms) in B. Numbers 1–8 indicate ROIs shown schematically in the insets.
Data analysis
The analysis of optical data, including spatial averaging as well as high-pass and low-pass filtering, was performed in Neuroplex5.1 (RedShirtImaging, LLC). For off-line temporary filtering of optical traces, we used a high pass Butterworth at 0.1 Hz cut-off, and a low pass Gaussian at 30 Hz cut-off, unless otherwise specified. Analysis of electrical recordings was performed in AxoScope9.2 (Axon Instruments, Inc.). Statistical testing was performed using SigmaStat 3.5 and employed data points before they were normalized. When comparing data obtained from the same neuron under two different experimental treatments, we used a paired Student's t test. If a data group was not normally distributed (P > 0.05), we used the non-parametric Wilcoxon signed-rank test. When comparing data points obtained from different neurons, we used an independent Student's t test. P-values were deemed significant if < 0.05 and highly significant if P < 0.01. Values are presented as means ± s.e.m. in the figures and means ± s.d. in the text and figure legends. n = number of neurons; physical units of the calcium integral are % × ms, where ‘%’ stands for fractional change in fluorescent light intensity (ΔF/F). We refer to a selected neuronal compartment as an ROI (region of interest), where membrane potential transients were measured either optically (voltage-sensitive dyes) or electrically (whole-cell). In Figs 1 and 2, the outputs from six neighbouring pixels were averaged (spatial averaging) to improve the signal-to-noise ratio. In calcium integral histograms (Figs 2D and 3), the distances between the centres of two adjacent 2 × 2 pixel bins varied between 10 and 14 μm, depending on dendritic contours. However, in the numerical analysis and graphs, all the data points were assigned a 15 μm interval for simplicity. In Fig. 13, we define excitability as membrane potential change (output) in response to a standard glutamatergic pulse (input). The terms ‘half-width’ and ‘duration’ were used interchangeably in the text.
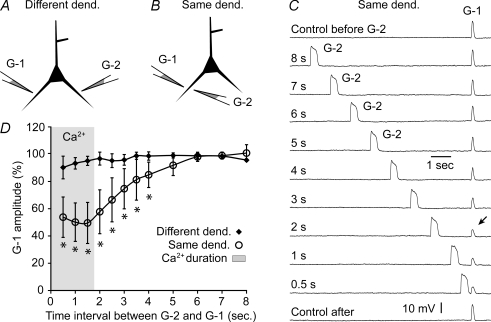
Figure 13. Glutamate-induced depression of dendritic ability to generate plateau potentials.
A, two glutamate electrodes, G-1 and G-2, positioned on two basal dendrites. B, two glutamate electrodes positioned on the same basal dendrite. C, using experimental configuration shown in B the time interval between G-2 and G-1 was gradually shortened. Peak amplitudes of G-1 induced potentials were normalized in respect to ‘Control before’, and plotted in D (circles). Arrow marks G-1 potential with notably reduced amplitude. Measurements, obtained using the experimental configuration shown in A (Different dend.) are plotted in D as diamonds. Grey area represents a period of time between the onset of glutamate pulse (0 s) and projected collapse of dendritic Ca2+ plateau (316 ms × 5.8 = 1.83 s). Asterisk marks P < 0.01.
Results
Time course of dendritic Ca2+ transient
Pyramidal layer 5 neurons were filled with the calcium sensitive dye, Fluo-5F, and middle segments of basal dendrites were stimulated by glutamate microionthophoresis, as indicated in the schematic diagram (Fig. 1A, inset). While the duration of the glutamate pulse (5 ms) and the position of the electrode tip were fixed throughout the experiment, the intensity of the iontophoretic current was gradually increased in subsequent sweeps (1–9). Once the intensity of the glutamatergic stimulus reached the threshold for the generation of somatic plateau depolarizations (sweep 4) the duration of the dendritic Ca2+ transients obtained at the point of the glutamatergic input (dend.) greatly exceeded the duration of the somatic sustained depolarization (soma). This was the case either when the bath contained normal ACSF (Fig. 1A) or after the introduction of sodium channel blocker TTX (1 μm) (Fig. 1B).
Dendritic Ca2+ signals associated with short glutamate-evoked depolarizations decayed exponentially (Fig. 1C, sweeps 2 and 3), while glutamate-evoked plateau depolarizations (of the same amplitude) produced dendritic Ca2+ signals characterized with a plateau phase (sweeps 6–7). The same was true when we compared the decay of AP-evoked Ca2+ transients (Fig. 2E, black) with the decay of glutamate-evoked Ca2+ transients (Fig. 2E, red) obtained in the same dendritic segment.
In the present study dendritic Ca2+ imaging was performed using three different Ca2+ indicators, interchangeably (Ca-Green-1 (Kd = 190 nm) or bis-fura-2 (Kd = 370 nm), or Fluo-5F (Kd = 2300 nm)). The half-width of the dendritic Ca2+ plateau correlated well with the half-width of the somatic plateau depolarization (Fig. 1D), regardless of the Ca2+ indicator used (correlation coefficient (CC): CCCa-Green = 0.4074, n = 14; CCbis-fura-2 = 0.7192, n = 18; and CCFluo-5F = 0.3972, n = 15). In optical measurements characterized with a good signal-to-noise ratio, we observed a clear break point at the end of the Ca2+ plateau phase (Fig. 1C, break). In neurons filled with bis-fura-2, the break point of the Ca2+ plateau (Fig. 2E, t-2) occurred, on average, 1006.9 ± 506 ms (n = 18) after the collapse of the somatic sustained depolarization (Fig. 2E, t-1). In neurons filled with Ca-Green-1 or Fluo-5F, the t-1 to t-2 interval was 760.7 ± 253 ms (n = 14) and 972 ± 353 ms (n = 15), respectively. These data indicate that a strong Ca2+ signal was regularly present long after the collapse of the sustained somatic depolarization episode (Figs 1A and 2E, asterisks). In addition, the prolonged Ca2+ signal cannot be explained by the buffering properties of the Ca2+ indicators (Fig. 1C, sweep 1 and Fig. 2E, black).
Spatial distribution of dendritic Ca2+ transients
To characterize the spatial distribution of dendritic Ca2+ signalling, calcium imaging was performed simultaneously at multiple sites along the target and neighbouring basal dendrites. Neurons were stimulated either with brief (5 ms) glutamate pulses or synaptically (50 Hz) to produce long-lasting episodes of sustained depolarization (Fig. 2B and C). We chose these two stimulation protocols because depolarized states similar to those depicted in Fig. 2B and C insets (amplitude 15–20 mV; duration 200–500 ms, irregular firing pattern): (1) are frequently observed in intracellular in vivo recordings (Timofeev et al. 2000), (2) are thought to play a critical role in the consolidation of memory during sleep (Sejnowski & Destexhe, 2000), and (3) provide an interesting experimental model for studying dendritic signal integration, owing to a well defined and fully controllable excitatory input (Schiller et al. 2000; Wei et al. 2001; Milojkovic et al. 2005). Both types of stimulation, focal glutamate (n = 14) and synaptic (n = 9), produced characteristic calcium plateau signals at the stimulation site (Fig. 2B and C, ROI 7, red). Not only the somatic electrical response (ROI 0), but also the spatial and temporal dynamics of dendritic calcium transients (ROIs 1–12) were nearly identical in these two stimulation protocols. In dendritic regions away from the stimulation site, calcium transients were considerably shorter in duration (half-width). This was true in both distal (ROIs 11–12, arrowheads) and proximal segments (ROIs 3–5) of the input-receiving (‘target’) dendrites (n = 23).
Contribution of APs to the Ca2+ map
Basal dendrites of neocortical pyramidal neurons exhibit substantial Ca2+ transients induced by the backpropagation of sodium action potentials (Yuste et al. 1994; Schiller et al. 1995; Antic, 2003). In order to determine if backpropagating APs were responsible for the observed calcium buildup in dendritic segments flanking the synaptic stimulation site, instead of synaptic stimulation we injected depolarizing current into the cell body (Fig. 2B and C, black). The durations and intensities of current pulses were adjusted to produce the same number of action potentials that were generated by the synaptic stimulation trials. During the trials involving synaptic stimulation and those using current injection, the position and focus of the fluorescent cells were kept fixed in the microscope. Sampling the signals from the same set of pixels, under the same set of conditions (same cellular compartment, same intracellular dye concentration) allowed comparisons to be made between calcium signals generated with (Fig. 2B and C, red) and without a synaptic component (black). The difference between these two types of calcium transients (red and black, ROIs 6–12) was quite obvious in all neurons tested (n = 5). To provide a quantitative description of this difference in each region of interest (Fig. 2D, red boxes), we calculated time integrals of the calcium signal in response to the two stimulation protocols (Fig. 3). Simple arithmetic subtraction (e.g. A minus B) revealed that during the in vitro evoked sustained depolarization, calcium influxes in proximal dendritic segments were largely due to action potential backpropagation (Fig. 3C and F; group data in online supplemental material, Supplemental Fig. S2). In contrast, the origin of free Ca2+ at the synaptic stimulation site as well as in more distal dendritic segments (Fig. 3, arrows) was AP-independent.
Origin of Ca2+ distal to the synaptic input site?
If backpropagating action potentials were not responsible for the robust calcium signal in distal tips of target basal dendrites (Fig. 2B and C, arrowheads), how did the Ca2+ ions get there? One possibility is that the excitatory neurotransmitter glutamate diffused from the stimulation site (Fig. 2A, ROI 7) to the distal dendritic segment (ROI 12). Two lines of evidence indicate that this was not the case. First, by using a biological assay, we have previously shown that a glutamate ‘cloud’ from a 5 ms-long iontophoretic application (Supplemental Fig. 3E, glut.) has an effective radius of less than 25 μm around the tip of the stimulation pipette (Milojkovic et al. 2005, their Fig. 1). Second, if glutamate diffusion was responsible for distal dendritic calcium influx, the glutamate concentration would have followed a clear gradient from the tip of the stimulation pipette in all directions. Upon the block of APs, non-target dendrites located at a distance from the glutamate ejection site equal to that of the distal segments of the target dendrite would have exhibited glutamate-evoked Ca2+ signals of similar magnitude and duration. But this was never observed. Calcium signals obtained in distal segments of the target dendrites were invariably and disproportionally larger than signals obtained in non-target branches at the same radial distance from the stimulation site (e.g. Figure 4A, ROI 7 versus ROI 2). These findings strongly indicate that signal propagation along the target dendrites, but not glutamate diffusion through brain tissue, was responsible for calcium influx distal to the stimulation site.
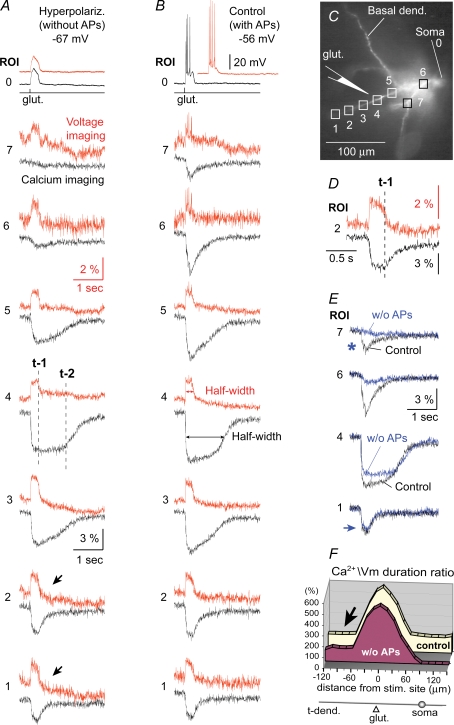
Figure 4. Voltage–calcium imaging.
A, hyperpolarizing (−150 pA) current was injected into the cell body to change the resting potential from −56 mV to −67 mV and prevent the initiation of sodium APs. Seven pairs of voltage signals (Voltage imaging – upper traces) and calcium signals (Calcium imaging – lower traces) from 7 regions of interest (ROI) marked by boxes in C are time-aligned. Vertical dashed lines mark the breakdown of the voltage plateau (t-1) and calcium plateau (t-2) at the stimulation site (ROI 4). Arrows mark distal dendritic segments, where calcium transients and membrane potential transients have nearly identical durations. B, same glutamate puff (glut.) as in A except without a hyperpolarizing current. C, layer 5 pyramidal cell was co-injected with voltage-sensitive (JPW-1114) and Ca2+-sensitive dye (bis-fura-2). D, in the dendritic segment (ROI 2) at 85 μm distally from the stimulation site, the collapse of voltage (t-1) and collapse of the calcium transient coincide. E, calcium signals from panel A (w/o AP) are superimposed with Ca2+ signals from panel B (Control). Asterisk marks the region in the dendritic tree (non-target basal dendrite) where the Ca2+ signal is entirely dependent on somatic firing of APs. Arrow marks the region in the distal tip of the target dendrite (ROI 1) where the Ca2+ signal is independent of somatic firing. F, control – four neurons were stimulated to produce UP states. Y-axis indicates the half-width of the dendritic calcium signal divided by half-width of the voltage transient. X-axis indicates distance from the stimulation site (0 μm). w/o AP – in the same 4 neurons, initiation of APs was blocked by hyperpolarizing current. For error bars see Supplemental Fig. S5.
We next considered the possibility that an electrical signal different from sodium action potentials could have triggered the calcium influx ∼100 μm distal to the stimulation site. To obtain spatially well-resolved voltage and Ca2+ measurements, we injected neurons with a cocktail of fluorescent dyes, consisting of the voltage-sensitive dye, JPW1114 (400 μm), and the calcium sensitive dye, bis-fura-2 (200 μm). Intracellular coapplication of these two dyes has also been successful in hippocampal pyramidal cells (Canepari et al. 2007). Typically, in the initial recording sweeps, glutamate-evoked sustained depolarizations were first monitored using calcium-sensitive dye imaging (Fig. 4A, lower traces). After establishing the calcium signal pattern characteristic for suprathreshold dendritic stimulation (described in Figs 2 and 3), the optical filter set (filter cube) was quickly changed to allow voltage-sensitive dye measurements and the glutamate pulse was repeated (Fig. 4A, upper traces). The same intensity and duration of glutamate iontophoretic current and the same position of the electrode tip on the same dendritic branch produced two nearly identical somatic responses (Fig. 4A, ROI 0). The characteristics of somatic sustained depolarization (amplitude 16.1 ± 1.6 mV; duration 282 ± 32 ms, n = 14 neurons) in JPW1114-loaded neurons were not statistically different from that observed in the absence of JPW1114 (bis-fura-2-loaded neurons; amplitude 15.3 ± 1.8 mV; duration 268 ± 42 ms, n = 10 cells; Pamplitude = 0.2671 (JPW versus fura); Pduration = 0.3046 (JPW versus fura), Supplemental Fig. S4). These results indicate that, at the concentration used (400 μm), JPW1114 did not alter neuronal physiological responses to glutamate puffs (see also Milojkovic et al. 2004, their Fig. 10).
Insights from voltage–calcium imaging
Sequential multi-site voltage–calcium imaging yielded two interesting results. First, there is an apparent dissociation between the durations of local voltage and local calcium signals in the dendritic segment directly exposed to the excitatory neurotransmitter glutamate. The half-width of the calcium signal at the stimulation site (Fig. 4B, ROI 4, lower trace) is on average 587 ± 133% (n = 4) of the half-width of the dendritic plateau potential change (ROI 4, upper trace). In other words, the glutamate-evoked dendritic plateau potential collapses back towards the resting membrane potential (vertical dashed line t-1) while the Ca2+ signal in the same cellular compartment persists for more than 1000 ms after the collapse of plateau potential (t-2). Second, in contrast to the glutamatergic input site (ROI 4), calcium signal in the distal dendrite (ROI 1, lower trace) has the same half-width as the membrane potential transient in the same dendritic segment (ROI 1, upper trace). The calcium signal in the distal dendritic segment begins its return to the baseline level immediately upon collapse of the local voltage-transient (Fig. 4D, vertical dashed line t-1). To provide a more quantitative description of voltage–calcium temporal relations along input receiving basal dendrites, we plotted the ratio between the half-width of the calcium signal and half-width of the voltage transient in each 15 μm long segment of the dendrite. Figure 4F (w/o AP) shows an averaged Ca2+/voltage duration ratio obtained from four neurons whose APs were blocked by somatic hyperpolarization during the plateau depolarization phase. The same four neurons were then relieved from the hyperpolarizing current and allowed to fire APs during the plateau phase (control). Action potentials brought calcium transients to the proximal dendritic segments and the soma (from +75 μm to +120 μm) and caused a small Ca2+ increase at the stimulation site (0 μm), but had no effect in the distal dendritic segments (arrow).
Contribution of internal calcium stores to Ca2+ plateau duration
So far, our recordings have revealed that Ca2+ dynamics in dendritic segments away from the synaptic input site are in tight correlation with the time course of the local electrical signal (plateau potential), while at the input site local Ca2+ signals outlast the local plateau potentials by ∼5.8-fold (Fig. 4F). To determine whether the internal release of Ca2+ was responsible for this long-lasting Ca2+ transient, we injected the neurons with drugs which block the release of calcium from intracellular stores. Neither ruthenium red (1300 μm), nor ryanodine (40 μm) nor heparin (4 mg ml−1), when applied intracellularly, was able to shorten the duration of Ca2+ transients in dendrites exposed to 5 ms-long glutamate pulses (Fig. 5A). In experiments with ruthenium red, we detected a statistically significant (P = 0.0247, n = 4) increase in the Ca2+–Vm duration ratio compared to control (drug-free) neurons. We attributed this to the inhibitory actions of ruthenium red on mitochondrial Ca2+ uptake (Rigoni & Deana, 1986). Similar to ruthenium red, a local application of thapsigargin (Fig. 5B) caused a statistically significant (P = 0.0060, n = 5) increase in the Ca2+–Vm duration ratio (Fig. 5C), demonstrating that we could change the duration of the Ca2+ plateau. However, the changes involved increases but never a decrease of Ca2+ signal duration (n = 17).
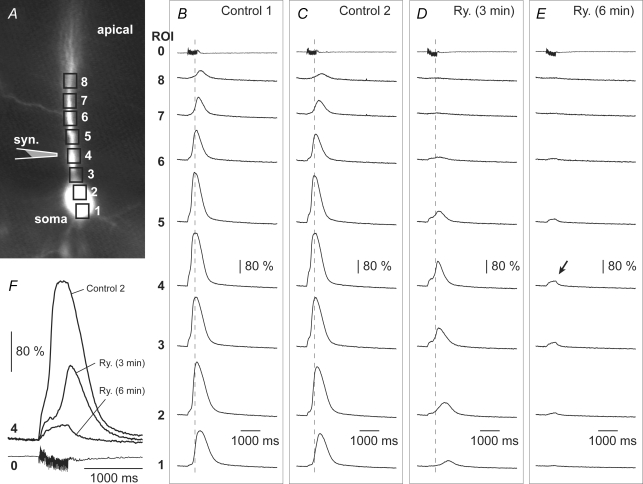
To test the potency of our batch of ryanodine and heparin, in the next series of experiments we adopted a synaptic stimulation protocol (Nakamura et al. 1999) known to induce calcium release from internal stores in the proximal part of the apical dendrite (Fig. 6). This high frequency (100 Hz), long duration (0.5 s) synaptic stimulation protocol invariably (n = 9/9) evoked a strong calcium signal at the stimulation site (Fig. 6, ROI 4). These Ca2+ transients propagated very slowly in two opposite directions: proximally towards the soma and distally towards pia (Nakamura et al. 1999; Larkum et al. 2003; Hagenston et al. 2007). Although the stimulation sites were less than 100 μm from the centre of the soma (Fig. 6A), the peak latencies of the somatic transients invariably (n = 9/9) exceeded 250 ms with respect to the peak of Ca2+ signal obtained at the stimulation site (Fig. 6B, dashed vertical line). This synaptic stimulation protocol, which regularly caused Ca2+ waves under the control conditions described above, failed in neurons injected with heparin (n = 4) (Fig. 5E, Supplemental Fig. 6). In the next series of experiments the effects of ryanodine were investigated in the same cell where Ca2+ waves were obtained in control trials (Fig. 6B and C). Bath application of ryanodine [5 μm] caused a complete elimination of the Ca2+ wave in 5 out of 5 neurons tested, leaving only the synaptic component of the Ca2+ signal (Fig. 6E, arrow).
Figure 6. Synaptically evoked release of calcium is blocked by bath application of ryanodine.
A, layer 5 pyramidal neuron filled with Fluo-5F and Alexa Fluor 594. Schematic drawing indicates the position of the extracellular stimulation pipette. B and C, in normal ACSF (Control) Ca2+ signals were simultaneously recorded from 8 regions of interest (ROI) indicated by boxes in A. Addition of ryanodine in the bath first caused a partial block (D) and later a complete block (E) of the internal Ca2+ release. Arrow marks the residual synaptic component of the dendritic Ca2+ signal. F, Ca2+ signals obtained at the stimulation site (ROI 4) in control and ryanodine conditions are superimposed with the simultaneous whole cell recording (ROI 0) to show the progression of ryanodine action.
Encouraged by these positive controls, we repeated experiments in which glutamate-evoked Ca2+ plateaus in basal dendrites were challenged by intracellular application of heparin. In this new data set (n = 5, Fig. 5D), heparin again failed to change the voltage–calcium duration ratio compared to that in heparin-free cells (Control, n = 12). Note that the 17 cells used in this analysis are different from those shown in Fig. 5A. We next challenged the glutamate-evoked Ca2+ plateaus in basal dendrites with bath applications of ryanodine (5 μm). In these experiments (n = 6) control and test measurements were performed on the same neuron using the same intensity and location of the glutamate puff (Fig. 5D, Ryanodine versus Control). Finally, we employed the same strategy to explore the role of metabotropic glutamate receptors in the generation of Ca2+ plateaus in basal dendrites. Like in the ryanodine experiments, here too measurements were performed on the same basal dendrite before and after bath application of the metabotropic glutamate receptor antagonist MCPG (250 μm) (Fig. 5D, MCPG versus Control, n = 4). Neither heparin, nor ryanodine nor MCPG was able to change the relative duration of the Ca2+ plateau (Ca2+/voltage ratio, P > 0.05), suggesting that internal Ca2+ release does not contribute significantly to the prolonged accumulation of Ca2+ in basal dendrites upon suprathreshold glutamatergic stimulation.
A similar conclusion can be reached by comparing the spatio-temporal dynamics of synaptically evoked internal Ca2+ release (Fig. 7A) with that of the glutamate-evoked Ca2+ plateau (Fig. 7B). Synaptically evoked Ca2+ waves sampled from adjacent pixels along a very short segment of the apical dendrite and the soma (total length less than 100 μm) display astonishing differences in both the onset and timing of the peak (Fig. 7A, ROIs 1–8; in the range 250–800 ms). Glutamate-evoked Ca2+ plateaus, on the other hand, show near-simultaneous onset (within 25 ms) along the entire basal dendrite (Fig. 7B). Furthermore glutamate-dependent Ca2+ plateaus invariably show the longest duration at the stimulation site (Fig. 7B, ROI 4). In contrast, the longest duration of internal Ca2+ release is observed in the soma, very distant from the stimulation site (Fig. 7A, ROI 1–2).
Taken together, the data obtained with antagonists of intracellular calcium release (Fig. 5) and multi-site measurements of neuronal Ca2+ transients (Figs 6 and 7) suggest that the long duration of a calcium transient at the glutamate stimulation site (calcium plateau) is not caused by release from internal calcium stores.
Post-plateau depolarization
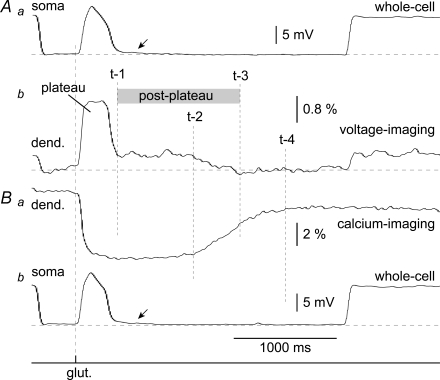
In 13 neurons stimulated with a glutamate pulse, we noticed that the collapse of the dendritic plateau potentials did not completely return to baseline. Instead, the post-plateau potential rested at a level slightly higher than the baseline (Fig. 8Ab, voltage-imaging, between lines t-1 and t-3). The relative amplitude of post-plateau depolarization was 13.2 ± 4.9% (mean ± s.d., n = 13) of the plateau amplitude, measured 250 ms after the collapse of plateau potential. In some neurons (n = 4) the post-plateau amplitude was less than 8% of the plateau amplitude (full range 6.2–27.3%, n = 13).
Figure 8. Glutamate-evoked plateau potential (plateau) is followed by a small dendritic depolarization.
Aa, somatic whole-cell record of glutamate-evoked potentials during voltage-imaging trials (average of 4 sweeps). Ab, voltage imaging from ROI 4 in Fig. 4A. Low-pass Gaussian filter = 20 Hz cutoff. Ba, top trace, calcium imaging from the same ROI. Bb, somatic whole-cell recording during calcium-imaging trials (average of 4). Arrows indicate persistent miniature depolarizations that follow the collapse of the plateau potential. Time points t-1 and t-2 explained in Fig. 4. Time points t-3 and t-4 mark the termination of dendritic post-plateau depolarization, and dendritic Ca2+ transient, respectively.
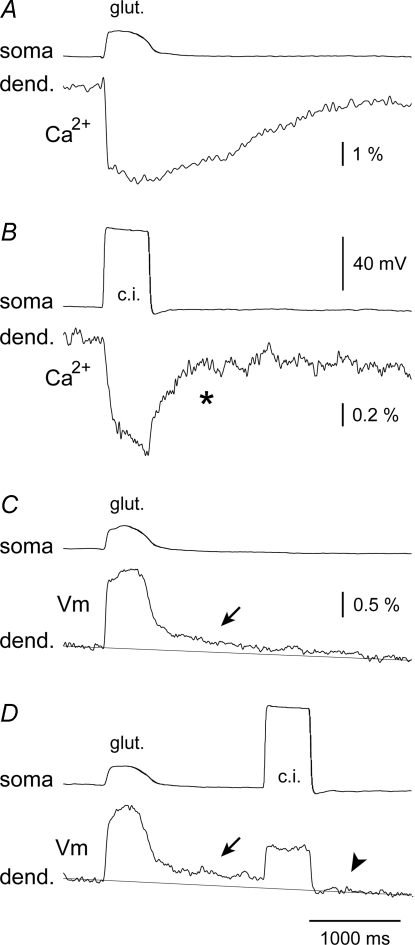
Interestingly, in three neurons with good signal-to-noise ratios, the start of the decay of the post-plateau potential coincided with the start of decay of the Ca2+ plateau in the same dendritic segment (Figs 8Ba, t-2). The mean durations of the glutamate-evoked plateau depolarizations (plateau half-width) and post-plateau depolarizations (t-1 to t-3 interval) were 237 ± 57 ms and 617 ± 355 ms (mean ± s.d., n = 13), respectively. In contrast to glutamate-evoked dendritic depolarizations, dendritic depolarizations evoked by current injection into the cell body (Fig. 9D, c.i., n = 4) failed to produce delayed depolarizations (arrowhead). Current-evoked dendritic Ca2+ transients also failed to maintain any calcium increases beyond the somatic depolarization envelope (Fig. 9B, asterisk). In the same dendritic segment, however, glutamatergic stimuli (Fig. 9C and D, glut.) regularly produced post-plateau depolarizations (arrows) and notable Ca2+ plateaus (Fig. 7A, dashed vertical line). These results indicate that current injection-evoked depolarizations cannot produce post-plateau potentials (Fig. 9D, arrowhead) or Ca2+ plateaus (Fig. 9B, asterisk, n = 4/4). Dendritic post-plateau potentials (Fig. 9C) and concomitant Ca2+ plateaus (Fig. 9A) were observed only during glutamatergic stimulations.
Figure 9. Post-plateau depolarizations in basal dendrites can be initiated with glutamatergic stimulations but not with a direct current depolarization.
A, simultaneous somatic whole-cell (soma) and dendritic calcium imaging (dend.) of a glutamate-evoked plateau potential in the basal branch, 95 μm from the soma. B, somatic current injection (c.i.) was used to trigger Ca2+ transient in the same dendritic segment. Asterisk marks the collapse of current-induced Ca2+ transient. C, same as in A except voltage imaging was used to assess dendritic function (average of 4). D, same as in C except somatic current injection was applied 1.8 s after the glutamate pulse. Arrowhead – dendritic membrane potential returned to base line. Arrows mark the time point at which plateau potential is over, but dendrite is still slightly depolarized (C and D), and calcium is still accumulating in the cytosol (A).
Synaptically evoked post-plateau depolarization
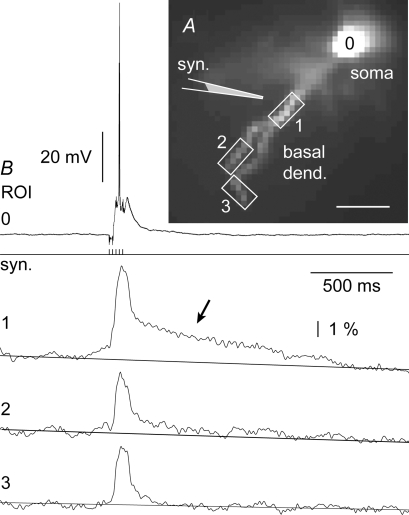
A legitimate question is whether the prolonged Ca2+ accumulation at the glutamate stimulation site (Figs 1–4) is just an artifact of glutamate iontophoresis. Two lines of evidence indicate that the dendritic Ca2+ plateau is not an artifact of glutamate iontophoresis. First, Ca2+ plateaus were observed (n = 5) upon synaptic stimulation (Fig. 2C). Second, in addition to Ca2+ imaging experiments we performed voltage-sensitive dye imaging of synaptically evoked dendritic plateau potentials. In 3 out of 5 neurons examined in this way, we found a depolarization foot protruding from the dendritic plateau potential (Fig. 10B, arrow). It is important to note that the post-plateau depolarization was restricted to the point of synaptic input (Fig. 10, ROI 1). In dendritic segments away from the strong excitatory stimulation, the post-plateau depolarization of membrane potential was notably smaller or completely absent (ROIs 2–3). These data suggest that both Ca2+ plateaus and post-plateau depolarizations take place in basal dendrites regardless of the source of released glutamate (synaptic stimulation or glutamate iontophoresis).
Figure 10. Small amplitude depolarization follows the synaptically evoked dendritic plateau.
potential A, layer 5 neuron is filled with voltage-sensitive dye JPW-1114. The drawing marks the position of an extracellular stimulation electrode (syn.). B, voltage-sensitive dye signals were sampled simultaneously from 3 regions of interest indicated by boxes in A and superimposed with whole-cell somatic recording (ROI 0). Note that post-plateau depolarization (arrow) is present only at the stimulation site (ROI 1).
Ionic basis of post-plateau potentials
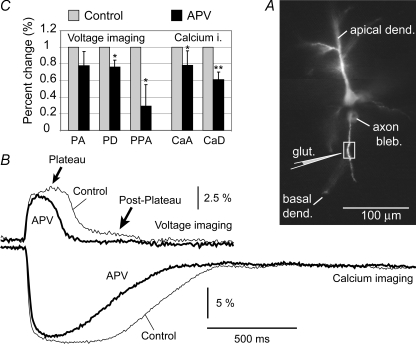
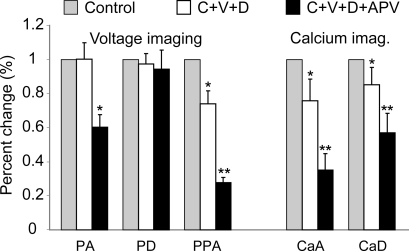
To investigate which membrane channels mediate the membrane potential change occurring after the collapse of the glutamate-evoked dendritic plateau potential (Fig. 8Ab, post-plateau), we performed voltage–calcium imaging under control conditions (Fig. 11B, grey) and after bath application of the NMDA receptor antagonist, APV (20 μm) (n = 6) (Fig. 11B, black). We analysed relative changes (APV versus Control) in five parameters: (1) amplitude of the plateau potential (PA), (2) duration (half-width) of the plateau potential (PD), (3) amplitude of post-plateau potential (PPA), (4) amplitude of the Ca2+ plateau (CaA), and (5) duration of the Ca2+ plateau (CaD). Statistical analysis using paired Student's t test showed that all parameters except PA were significantly (P < 0.05) smaller in APV compared to controls (Fig. 11C, asterisks). The duration of the Ca2+ plateau (CaD) exhibited a highly significant change, yielding a P-value smaller than 0.01 (double asterisk). Based on the magnitude of the relative change in PPA and a highly significant change in CaD (Fig. 11C), it appears that APV's action was strongest in the late phase of the response, which is dominated by PPA and CaD (Fig. 11B).
Figure 11. Post-plateau potentials are mediated by NMDAr.
A, composite microphotograph of a layer 5 pyramidal neuron filled with JPW-1114 and bis-fura-2. Schematic drawing indicates the position of glutamate-filled pipette. B, voltage and Ca2+ signals from the region of interest marked by box in A, were recorded before (thin) and after application of NMDAr antagonists APV in the bath (thick line). C, bar diagram displays relative changes (APV/Control) in 5 parameters: PA – plateau amplitude; PD – plateau duration (half-width); PPD – post-plateau amplitude measured 250 ms after the collapse of the plateau potential; CaA – peak amplitude of Ca2+ transient; CaD – duration (half-width) of the Ca2+ transient. Single asterisk marks statistical difference from Control (P < 0.05). Double asterisk marks P < 0.01.
Glutamatergic stimulation is known to activate voltage-gated Ca2+ channels in basal dendrites and these channels contribute substantial depolarizing currents to the dendrite and the soma (Oakley et al. 2001). In the next series of experiments we challenged dendritic electrical and Ca2+ transients with a cocktail of voltage-gated calcium channel (VGCC) blockers consisting of ω-conotoxin (25 nm), Verapamil (20 μm) and Diltiazem (20 μm). This mixture of VGCC blockers (Fig. 12, C+V+D) produced no change in PA or PD, and small reductions in the PPD, CaA and CaD, which were statistically significant (P < 0.05; n = 5). Note that with the confidence level set to 0.01, none of the five parameters were affected by VGCC blockers. When APV (20 μm) was added to the bath (in addition to the VGCC blockers; C+V+D+APV), three parameters (PPA, CaA and CaD) were significantly reduced compared to controls (Fig. 12, double asterisks, P < 0.01).
Figure 12. Effects of VGCC antagonists on dendritic voltage and Ca2+ signals.
Bar diagram displays relative changes (Drug/Control) in 5 parameters. PA, PD, PPD, CaA and CaD – same as in the previous figure. White bars: Cocktail of three drugs: C, ω-conotoxin (25 nm), V, verapamil (20 μm), and D, diltiazem (20 μm) were coapplied. Black bars: APV (20 μm) was added on top of three VGCC blockers (C+V+D+APV). Single asterisk marks statistical difference from Control (P < 0.05). Double asterisk P < 0.01.
The data presented in Figs 11 and 12 suggest that NMDA receptor channels are major contributors to the small dendritic potential (Fig. 8Ab, post-plateau), as well as to the dendritic Ca2+ influx (Fig. 8Ba) occurring after the collapse of the glutamate-evoked plateau potential at t-1.
Dendritic excitability during Ca2+ plateau
So far our measurements have shown that electrical and calcium signals collapse in the entire basal dendrite at the same time, except in the dendritic segment at the point of the glutamatergic input, where they persisted for an additional 1–2 s (Figs 1–5). To determine whether a long-lasting Ca2+ plateau was changing the physiological properties of the dendrite, we designed experiments with two glutamate-filled micropipettes (G-1 and G-2, Fig. 13A and B). To allow accurate amplitude measurements of suprathreshold glutamate-evoked potentials, APs were blocked by bath application of the sodium channel antagonist, TTX (1 μm). In one experimental configuration two identical glutamate pipettes were positioned on two different basal dendrites of the same neuron (Fig. 13A, and Supplemental Fig. S9A). The G-1 pulse was used to test the dendritic response (test pulse), while the purpose of the G-2 pulse (conditioning pulse) was employed to generate a Ca2+ plateau prior to the arrival of G-1. The G-1 stimulus was adjusted just above threshold to trigger a regenerative plateau potential (‘Control before’ amplitude 21.2 ± 8.9 mV, duration 147 ± 37 ms, n = 11). The G-2 stimulus, on the other hand, was set well above threshold to trigger a robust long-lasting plateau potential (amplitude 24.1 ± 7.1 mV, duration 327 ± 63 ms, n = 11). In subsequent sweeps, the time interval between G-2 and G1 was systematically reduced and the amplitude of the G-1 response was plotted versus the time interval (Fig. 13D, diamonds). In this experimental configuration (Different dend.), the conditioning pulse G-2 failed to alter the amplitude of the test pulse G-1 (n = 11/11). We did not detect a statistically significant difference between the amplitudes of control pulses (control before) and pulses that were preceded by a G-2 conditioning stimulus at a 0.5 s interval (P = 0.2402), 1.0 s interval (P = 0.3280), at 1.5 s interval (P = 0.3775, n = 11), etc.
In the next series of experiments, a G-2 pipette was positioned on the same basal dendrite, just opposite G-1 (Fig. 13B, Supplemental Fig. S9B). The average amplitude and duration of the control G-1 response (Control before) were 21.6 ± 9.6 mV and 137 ± 36 ms, respectively (n = 17). An average amplitude and duration of the G-2 conditioning pulse were 22.9 ± 9.8 mV and 316 ± 41 ms, respectively (n = 17). In this experimental configuration (Same dend.) the amplitude of the G-1 response was very sensitive to the time interval between G-2 and G-1 (Fig. 13D, circles). Interestingly, the time interval associated with the greatest impact of a G-2 event on the G-1 amplitude matched the duration of the inferred dendritic Ca2+ plateau (grey area). The duration of the inferred Ca2+ plateau was obtained by multiplying the mean duration of the G-2 plateau potential (316 ms) by the previously described factor, 5.8 (Fig. 4F). Within this time window (1–2 s) the amplitudes of the G-1 test potentials were invariably (n = 17/17) and drastically smaller (Fig. 13C, arrow) than in the absence of the conditioning pulse G-2 (Control before). Up to 4 s from the onset of Ca2+ plateau (Fig. 13D, time 0) the amplitude of the glutamate-evoked near-threshold spike (G-1) was still significantly smaller (P < 0.01) than in the absence of the conditioning pulse G-2 (Fig. 13D, asterisks), indicating that the period of reduced excitability extends beyond the duration of the actual Ca2+ signal.
In summary, these data demonstrate a notable reduction in the excitability of the input-receiving basilar dendritic segments in the first 1–2 s following the onset of glutamate-evoked plateau potential (Fig. 13D, time 0). This is to say that during the time course of the dendritic Ca2+ plateaus (Fig. 13D, grey area), the ability of the local dendritic segment to generate glutamate-evoked regenerative potentials is very notably reduced. Following the Ca2+ plateau (Fig. 13D, grey area) the excitability of the input receiving segment begins to recover with a time constant of 1.9 s.
Discussion
Although postsynaptic dendritic calcium transients have been extensively studied in thin dendrites of CNS neurons (Schiller et al. 2000; Wei et al. 2001; Holthoff et al. 2004), the dynamics of voltage transients at multiple sites surrounding the input site have not been explored simultaneously. One reason may be that basal and oblique dendrites are too small to tolerate glass electrodes beyond 140 μm from the cell body (Nevian et al. 2007). Also, single-site patch-clamp recordings are not ideally suited for studying the spatial aspect of dendritic signal integration.
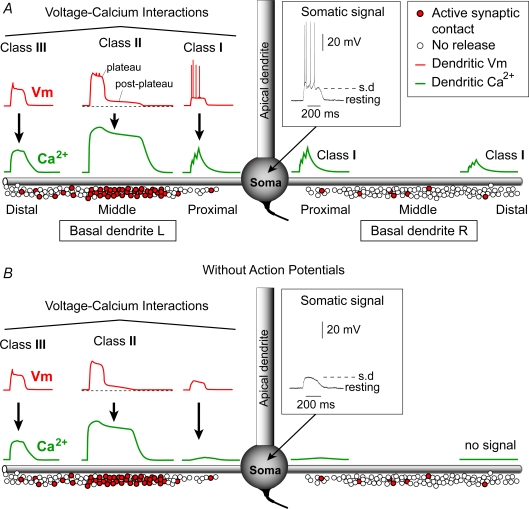
Our multisite voltage–calcium imaging data revealed three distinct dendritic zones of voltage–calcium interactions that occurred simultaneously in the basilar dendritic tree of a pyramidal neuron receiving a spatially restricted glutamatergic input (Fig. 14). The first zone is located between the glutamatergic input site and the soma (proximal dendritic region). When sustained depolarizations are accompanied by action potentials (Fig. 14A), the proximal Ca2+ signal (Class I) is in large part mediated by backpropagating action potentials (Figs 2 and 3, Supplemental Figs S2 and S3). AP-induced Ca2+ transients in basal dendrites have been reported previously (Yuste et al. 1994; Schiller et al. 1995). The second zone is located at the stimulation site (in this example in the mid dendritic region). Local Ca2+ signals at the glutamate input site are temporally dissociated from the local plateau potential (Fig. 14, Class II). The duration of the Ca2+ plateau exceeds the duration of the local dendritic spike by severalfold (Supplemental Fig. S5). Since local plateau potential and the somatic sustained depolarization (Fig. 14, Somatic signal, s.d.) have identical durations, it can be stated that calcium plateau persists after the collapse of the somatic sustained depolarization. The prolonged calcium influx is mediated by a small depolarization (Fig. 14A, post-plateau) that remains after the collapse of the dendritic plateau potential (Figs 8–10). The third characteristic zone is located within the distal tips of basal branches, distal to the synaptic input site. Glutamate-evoked calcium signals there (Class III) are in tight temporal unison with dendritic plateau potentials (Fig. 4A and B, arrows), and relatively independent from backpropagating APs (Fig. 4E, arrow).
Figure 14. Three distinct classes of voltage–calcium interactions occurring simultaneously in the basal dendrite.
A, schematic drawing depicts a cortical pyramidal cell with two basal dendrites (L and R). Excitatory synaptic axon terminals are represented by open circles. A synchronous activation of synaptic inputs (filled circles) clustered on one basal dendrite (in this example basal dendrite L) releases glutamate and produces a sustained somatic depolarization crowned by action potentials – inset). Synaptically evoked local membrane potential (Vm) and calcium transients (Ca2+) show a complex spatio-temporal pattern in the basilar dendritic tree. At the point of strong synaptic input (in our experimental model it is the middle dendritic region), local plateau potential and local calcium transient have very different durations (Class II Vm–Ca2+ interaction). Ca2+ transients here are better correlated with a small post-plateau depolarization, which immediately follows the dendritic plateau potential. Distally from the excitatory input site calcium signal is still strong but its duration precisely matches the duration of the plateau potential (Class III Vm–Ca2+ interaction). Proximally from the synaptic input site (towards the soma), and in non-target dendrites (Basal dendrite R), Ca2+ influx is predominantly mediated by backpropagating APs (Class I Vm–Ca2+ interaction). B, same as in A except somatic plateau depolarization was below the threshold for action potential initiation. Class II and Class III Vm–Ca2+ interactions are identical as in A. In the absence of somatic action potentials the proximal region of the target dendrite experiences negligible calcium signals.
Vm-Ca2+ temporal dissociation at the synaptic input site
While spike-induced dendritic calcium transients have been well characterized in the literature (Jaffe et al. 1992; Markram & Sakmann, 1994; Hausser et al. 2000), the apparent discrepancy in time course between Vm and Ca2+ signals at the excitatory input site have not received much attention. In the present study, we investigated whether an internal release of Ca2+ ions could explain the persistence of high intracellular Ca2+ levels after the collapse of the dendritic plateau potential (Fig. 4B, ROI 4). Neocortical layer 5 pyramidal neurons are known to exhibit a release of calcium from their internal calcium stores, and to generate dendritic calcium signals that outlast the underlying synaptic potentials by 1 s or more (Nakamura et al. 1999). This process produces a clear temporal dissociation between dendritic Ca2+ signalling (Ca2+ wave) and an electrical signal (postsynaptic potential) (Figs 6 and 7) However, there are some substantial differences between such Ca2+ waves (Nakamura et al. 1999; Larkum et al. 2003; Hagenston et al. 2007) and the glutamate-evoked Ca2+ plateaus described here. First, in pyramidal neurons a significant release from calcium stores occurs in response to a high intensity synaptic stimulation (50 pulses at 100 Hz). In the present experiments, neurons were stimulated with a single 5 ms-long glutamate pulse. Second, one consistent finding in both hippocampal and neocortical pyramidal cells is that the Ca2+ waves propagate readily within the thick apical dendrite but are not easily observed in the smaller oblique dendrites, basal dendrites (beyond 30 μm from the soma), or the apical tuft (Larkum et al. 2003). With glutamate puffs we regularly observed calcium plateaus in basal dendrites 90–150 μm away from the cell body. Third, the peak of the internally released calcium wave usually lags behind the onset of the postsynaptic potential by ∼1000 ms (Nakamura et al. 1999; Larkum et al. 2003) (Figs 6 and 7, dashed vertical lines). Upon glutamatergic stimulation the peak of the Ca2+ plateau coincided with the postsynaptic plateau potential (Figs 4 and 7B; Supplemental Figs S5 and S7). These differences, together with the experimental results obtained with modulators of internal calcium release (Fig. 5A), suggest that internal Ca2+ stores did not contribute significantly to glutamate-evoked calcium signals in basilar dendrites.
Small post-plateau dendritic depolarizations
In previous studies (Milojkovic et al. 2004, 2005), and for a long period of time during this project, we were under the impression that dendritic plateau potentials collapse down to the resting membrane potential. This concept imposed an unsurpassable obstacle for understanding the voltage–calcium temporal discrepancy at the glutamatergic input site (Fig. 4). All major calcium-passing channels (voltage-gated Ca2+ channels, NMDAr channels and some AMPAr channels) do come with a significant equilibrium potential and their opening has been shown to generate dendritic electrical transients (Hestrin et al. 1990; Spruston et al. 1995; Johnston et al. 1996). Therefore, it was difficult to conceive how calcium-passing membrane channels would remain in the open (conductive) state and pass calcium ions into the dendritic cytosol without any impact on local membrane potentials (Fig. 4, ROI 4). Since experiments with antagonists of release from internal calcium stores eliminated this route as a contributing factor (Fig. 5), we turned our attention back to the dendritic membrane potential. We used hyperpolarizing current or TTX to block APs and averaged four or more sweeps to improve dendritic optical signals. Using this approach, we detected a small-amplitude long-lasting ‘foot’ protruding from the glutamate-evoked dendritic plateau potential (Figs 8 and 9). The precise temporal relationship between this post-plateau depolarization and the Ca2+ plateau (Fig. 8), together with experiments which showed that only glutamatergic (but not current injection) stimulations could trigger it (Fig. 9), indicated that the small post-plateau potential was the sole driver of the delayed Ca2+ influx. Experiments with NMDAr antagonists (Fig. 11) and VGCC antagonists (Fig. 12) showed that the post-plateau depolarization is largely mediated by opening of NMDA receptor channels.
The change in intracellular free calcium (calcium signal) was disproportionally larger than the corresponding change in membrane potential (voltage signal), because of the (1) large surface-to-volume ratio of the dendrite and (2) near-zero resting concentration of Ca2+ ions in the dendritic cytosol. It is well established that a few NMDA receptor-channels (NMDAr) engaged in passing Ca2+ ions into miniature dendritic compartments (with ∼zero Ca2+ to begin with) can cause dramatic relative changes in local free Ca2+ (Carter & Sabatini, 2004; Nimchinsky et al. 2004; Sobczyk & Svoboda, 2007). At the same time, the postsynaptic potential (current) is dissipated across the surface and the longitudinal axis of the entire dendritic branch, and may be dissipated further into daughter branches and the cell body. At the peak of a unitary postsynaptic potential, only one NMDAr per dendritic spine is open, on average (Nimchinsky et al. 2004). A small number of opened NMDA receptor-channels does not provide enough conductance (current) to electrically charge the dendritic membrane adequately. Nevertheless, these miniature local dendritic depolarizations (Figs 8Ab and 9C, arrow) induce large relative changes in local Ca2+ concentrations (Figs 8Ba and 9A). In support of this view, recent experiments have shown that a block of the NMDAr causes a minimal change in both postsynaptic currents and postsynaptic potentials, while simultaneously having a dramatic effect on dendritic Ca2+ transients (Ngo-Anh et al. 2005).
Vm–Ca2+ association in distal tips of thin dendrites
Glutamate-evoked Ca2+ transients in thin terminal apical branches of cultured hippocampal pyramidal neurons normally appear throughout an entire distal branch within the time resolution of a single 100 ms image acquisition window (Wei et al. 2001). Using both 20 and 100 times faster acquisition rates (5 ms and 1 ms sampling interval) and dual-mode imaging (Vm and Ca2+), here we characterized the time course of the electrogenic event which drives Ca2+ transients in the distal tips of input receiving basal branches (Fig. 4A and B, ROIs 1 and 2). Distal electrogenic transients have nearly identical temporal characteristics with dendritic plateau potentials at the glutamate input site – a rapid onset, a plateau phase lasting several hundred milliseconds and an abrupt collapse at the end of the plateau phase. From the synaptic input site, plateau potentials propagate into the distal dendritic tip (Supplemental Figs S7 and S8), causing a robust calcium transient throughout the entire terminal branch (Figs 2–4). These data suggest that dendritic plateau potentials serve to functionally couple all synaptic contacts that are distal to the plateau initiation zone. The functional implications and potential outcomes of this coupling are discussed at the end of this section.
Sustained depolarizations without APs (silent UP states, Fig. 14B)
Action potentials are not necessary for the engagement of dendritic segments that are distal to the synaptic input site. For instance, in some neurons (n = 4) the excitatory input was suprathreshold in the dendrite (generation of the dendritic spike) but subthreshold in the soma (failure to trigger APs). In these neurons (Supplemental Fig. S3B), as well as in those cells where the initiation of somatic APs was blocked with hyperpolarizing current (Fig. 4A; n = 6) or by bath application of sodium channel blocker TTX (Supplemental Fig. S7; n = 7), distal dendritic segments invariably received strong calcium surges in strict temporal relation with local electrical transients (Class III Vm–Ca2+ interaction, Fig. 14B). These results show that basilar dendritic branches readily engage in local synaptic integration and generation of regenerative potentials in the absence of axonal output signals (APs). In agreement with this concept, recent in vivo recordings have revealed that ∼90% of cortical pyramidal neurons switch to an UP state without triggering a single action potential (Kerr et al. 2005; Volgushev et al. 2006).
The theory of individual dendritic branches serving as independent computational modules was first introduced in biophysical models (Segev & Rall, 1998). It has recently been proposed that synaptic contacts are spatially (and temporally) clustered on particular dendritic branches. Namely, in response to every-day life experience, synaptic afferents that carry similar informational content would tend to aggregate in a restricted part of the dendritic tree, presumably on the same dendritic branch (Poirazi & Mel, 2001). Clustering of synaptic inputs in space (and time) improves the chances for reaching the dendritic threshold for firing a regenerative (amplified) response and provides the opportunity for faster and more frequent cooperation among synaptic contacts involved in the same computational task. This intriguing concept, if true, may have profound implications for cortical information processing. Instead of thousands of synaptic inputs, the pyramidal cell needs only a ‘correct’ set of < 50 active synaptic contacts (Gasparini et al. 2004) to trigger a regenerative dendritic response (e.g. plateau potential), which then propagates towards the soma to change the somatic membrane potential from a DOWN to UP level (state). Furthermore, such a ‘correct’ set of excitatory synaptic contacts would bring only a small fraction of cortical cells into the activated state (Cossart et al. 2003), thus allowing for a large number of cortical configurations (dynamic states) that may arise in response to a large number of life experiences (memory). Regardless of whether this concept would (Cossart et al. 2003) or would not (MacLean et al. 2005) receive experimental confirmation in the future, the data presented here reveal the dendritic plateau potential as the biophysical mechanism responsible for tight Ca2+ coupling of all synaptic contacts along the entire length of an individual thin dendritic branch in response to a suprathreshold excitatory input at its middle part.
Glutamate-induced short-term postsynaptic meta-plasticity
Based on electrophysiological measurements, such as the postsynaptic potential paired-pulse ratio or the frequency of spontaneous synaptic events, numerous studies point to a presynaptic locus of short-term synaptic plasticity (Zucker & Regehr, 2002; Zilberter et al. 2005). Our experimental design, based on iontophoretic ejection of the neurotransmitter, effectively eliminated any influence that presynaptic mechanisms might exert on the neuronal response. Using this approach, we showed that during the time course of a glutamate-evoked Ca2+ plateau (approximately 1–2 s following the collapse of the plateau depolarization) the dendritic membrane has a reduced ability to trigger a regenerative plateau potential in response to novel glutamatergic stimuli. The on- and off-rates of the dendritic depression were relatively fast, less than 1 s and less than 2 s, respectively, and can therefore be classified as short-term plasticity. Postsynaptically mediated Ca2+-dependent short-term depression of membrane excitability has been previously described in pyramidal neurons (Legendre et al. 1993; Mennerick & Zorumski, 1996; Yasuda et al. 2003; Sobczyk & Svoboda, 2007) and seems to be an integral part of the cellular mechanisms that limit neuronal excitation in the CNS (Abbott et al. 1997; Turecek & Trussell, 2000; Castro-Alamancos & Oldford, 2002; Petersen, 2002; Boudreau & Ferster, 2005). From the perspective of cortical UP states, it should be mentioned that glutamate-evoked regenerative dendritic plateau depolarizations, here studied in vitro, are invariably followed by a period of relative refractoriness (Fig. 13D). Interestingly, this glutamate-induced period of depressed dendritic excitability (1–2 s) matches the time interval between spontaneous cortical slow oscillations (UP states) recorded in vivo (Steriade et al. 1993; Cowan & Wilson, 1994; Volgushev et al. 2006).
If plateau depolarizations relate to UP states, how does the decreased sensitivity to synaptic input relate to studies showing decreased amplitudes of whisker-evoked EPSPs during UP states (Petersen et al. 2003; Sachdev et al. 2004)? On the surface, there would appear to be a match (particularly since much whisker-evoked synaptic input to cortical pyramidal neurons in S1 is likely to arrive at the basal dendrites), but the prolonged decrease in sensitivity to basal synaptic input following plateau depolarizations would presumably also cause decreased responses during subsequent DOWN states in vivo. Two details must be taken into account when comparing the present data with previously published in vivo analysis of EPSP amplitudes during UP and DOWN states (Petersen et al. 2003; Sachdev et al. 2004). First, in the present study the effect of plateau depolarization on subthreshold EPSPs was not analysed. The test potential (G-1) was always set to reach the threshold for initiation of the plateau spike, and therefore the present study analysed only the initiation of regenerative glutamate-evoked potentials. Second, our result only applies to a narrow segment of dendritic membrane, the glutamate stimulation site. In this segment only, the ability of the dendritic membrane to generate subsequent regenerative plateau potentials is reduced (Fig. 13, same dendrite). Anywhere else on the dendritic tree, beyond the glutamate stimulation site, the regenerative glutamatergic events were unaffected by sustained (plateau) depolarizations (Fig. 13, different dendrite).
Functional implications
Our finding that three segments of the same basilar branch (middle, distal and proximal) experience three different patterns of voltage and Ca2+ changes during the same episode of suprathreshold glutamatergic stimulation of the middle segment (Fig. 14) suggests that synapse location may regulate Ca2+-dependent modulation of synaptic efficacy. By synapse location we do not mean to specify the distance from the cell body (a traditional view), but rather the distance from the point of suprathreshold excitatory input. Synaptic contacts at the point of suprathreshold glutamatergic excitation exhibit the strongest and longest NMDA-mediated Ca2+ transients (Ca2+ plateaus). Synaptic contacts distal to the plateau region exhibit smaller and shorter, but still substantial, Ca2+ transients mediated by the propagation of plateau potentials. The Ca2+ hypothesis states that the direction of long-term synaptic plasticity (potentiation or depression; LTP or LTD) correlates with the magnitude of the dendritic calcium transients. Accordingly, synaptic contacts inside the Ca2+ plateau are destined to undergo an increase (LTP), while those outside the plateau are destined to undergo a long-term decrease in synaptic strength (LTD). Whether the observed pattern of voltage and calcium changes provides conditions for simultaneous bidirectional plasticity in neocortical pyramidal cells remains to be addressed in future experiments.
Acknowledgments
We thank S. J. Potashner and A. R. Moore for comments on the manuscript. This work was supported by NIH grant MH63035.
Supplemental material
Online supplemental material for this paper can be accessed at:
http://jp.physoc.org/cgi/content/full/jphysiol.2007.142315/DC1 and http://www.blackwell-synergy.com/doi/suppl/10.1113/jphysiol.2007.142315
References
- Abbott LF, Varela JA, Sen K, Nelson SB. Synaptic depression and cortical gain control. Science. 1997;275:220–224. doi: 10.1126/science.275.5297.221. [DOI] [PubMed] [Google Scholar]
- Antic SD. Action potentials in basal and oblique dendrites of rat neocortical pyramidal neurons. J Physiol. 2003;550:35–50. doi: 10.1113/jphysiol.2002.033746. [DOI] [PMC free article] [PubMed] [Google Scholar]
- Augustine GJ, Santamaria F, Tanaka K. Local calcium signaling in neurons. Neuron. 2003;40:331–346. doi: 10.1016/s0896-6273(03)00639-1. [DOI] [PubMed] [Google Scholar]
- Ballesteros-Yanez I, Benavides-Piccione R, Elston GN, Yuste R, DeFelipe J. Density and morphology of dendritic spines in mouse neocortex. Neuroscience. 2006;138:403–409. doi: 10.1016/j.neuroscience.2005.11.038. [DOI] [PubMed] [Google Scholar]
- Boudreau CE, Ferster D. Short-term depression in thalamocortical synapses of cat primary visual cortex. J Neurosci. 2005;25:7179–7190. doi: 10.1523/JNEUROSCI.1445-05.2005. [DOI] [PMC free article] [PubMed] [Google Scholar]
- Branchereau P, Van Bockstaele EJ, Chan J, Pickel VM. Pyramidal neurons in rat prefrontal cortex show a complex synaptic response to single electrical stimulation of the locus coeruleus region: evidence for antidromic activation and GABAergic inhibition using in vivo intracellular recording and electron microscopy. Synapse. 1996;22:313–331. doi: 10.1002/(SICI)1098-2396(199604)22:4<313::AID-SYN3>3.0.CO;2-E. [DOI] [PubMed] [Google Scholar]
- Canepari M, Djurisic M, Zecevic D. Dendritic signals from the rat hippocampal CA1 pyramidal neurons during coincident pre- and post-synaptic activity: a combined voltage- and calcium-imaging study. J Physiol. 2007;580:463–484. doi: 10.1113/jphysiol.2006.125005. [DOI] [PMC free article] [PubMed] [Google Scholar]
- Carter AG, Sabatini BL. State-dependent calcium signaling in dendritic spines of striatal medium spiny neurons. Neuron. 2004;44:483–493. doi: 10.1016/j.neuron.2004.10.013. [DOI] [PubMed] [Google Scholar]
- Castro-Alamancos MA, Oldford E. Cortical sensory suppression during arousal is due to the activity-dependent depression of thalamocortical synapses. J Physiol. 2002;541:319–331. doi: 10.1113/jphysiol.2002.016857. [DOI] [PMC free article] [PubMed] [Google Scholar]
- Compte A, Brunel N, Goldman-Rakic PS, Wang XJ. Synaptic mechanisms and network dynamics underlying spatial working memory in a cortical network model. Cereb Cortex. 2000;10:910–923. doi: 10.1093/cercor/10.9.910. [DOI] [PubMed] [Google Scholar]
- Cossart R, Aronov D, Yuste R. Attractor dynamics of network UP states in the neocortex. Nature. 2003;423:283–288. doi: 10.1038/nature01614. [DOI] [PubMed] [Google Scholar]
- Cowan RL, Wilson CJ. Spontaneous firing patterns and axonal projections of single corticostriatal neurons in the rat medial agranular cortex. J Neurophysiol. 1994;71:17–32. doi: 10.1152/jn.1994.71.1.17. [DOI] [PubMed] [Google Scholar]
- Durstewitz D, Seamans JK, Sejnowski TJ. Neurocomputational models of working memory. Nat Neurosci. 2000;3(Suppl):1184–1191. doi: 10.1038/81460. [DOI] [PubMed] [Google Scholar]
- Emptage N, Bliss TV, Fine A. Single synaptic events evoke NMDA receptor-mediated release of calcium from internal stores in hippocampal dendritic spines. Neuron. 1999;22:115–124. doi: 10.1016/s0896-6273(00)80683-2. [DOI] [PubMed] [Google Scholar]
- Gasparini S, Migliore M, Magee JC. On the initiation and propagation of dendritic spikes in CA1 pyramidal neurons. J Neurosci. 2004;24:11046–11056. doi: 10.1523/JNEUROSCI.2520-04.2004. [DOI] [PMC free article] [PubMed] [Google Scholar]
- Gilbert CD, Wiesel TN. Morphology and intracortical projections of functionally characterised neurones in the cat visual cortex. Nature. 1979;280:120–125. doi: 10.1038/280120a0. [DOI] [PubMed] [Google Scholar]
- Goldman-Rakic PS. Cellular basis of working memory. Neuron. 1995;14:477–485. doi: 10.1016/0896-6273(95)90304-6. [DOI] [PubMed] [Google Scholar]
- Hagenston AM, Fitzpatrick JS, Yeckel MF. MGluR-mediated calcium waves that invade the soma regulate firing in layer V medial prefrontal cortical pyramidal neurons. Cereb Cortex. 2007 doi: 10.1093/cercor/bhm075. in press. [DOI] [PMC free article] [PubMed] [Google Scholar]
- Hausser M, Spruston N, Stuart GJ. Diversity and dynamics of dendritic signaling. Science. 2000;290:739–744. doi: 10.1126/science.290.5492.739. [DOI] [PubMed] [Google Scholar]
- Hestrin S, Nicoll RA, Perkel DJ, Sah P. Analysis of excitatory synaptic action in pyramidal cells using whole-cell recording from rat hippocampal slices. J Physiol. 1990;422:203–225. doi: 10.1113/jphysiol.1990.sp017980. [DOI] [PMC free article] [PubMed] [Google Scholar]
- Holthoff K, Kovalchuk Y, Yuste R, Konnerth A. Single-shock LTD by local dendritic spikes in pyramidal neurons of mouse visual cortex. J Physiol. 2004;560:27–36. doi: 10.1113/jphysiol.2004.072678. [DOI] [PMC free article] [PubMed] [Google Scholar]
- Jaffe DB, Johnston D, Lasser-Ross N, Lisman JE, Miyakawa H, Ross WN. The spread of Na+ spikes determines the pattern of dendritic Ca2+ entry into hippocampal neurons. Nature. 1992;357:244–246. doi: 10.1038/357244a0. [DOI] [PubMed] [Google Scholar]
- Johnston D, Magee JC, Colbert CM, Cristie BR. Active properties of neuronal dendrites. Annu Rev Neurosci. 1996;19:165–186. doi: 10.1146/annurev.ne.19.030196.001121. [DOI] [PubMed] [Google Scholar]
- Kaiser KM, Lubke J, Zilberter Y, Sakmann B. Postsynaptic calcium influx at single synaptic contacts between pyramidal neurons and bitufted interneurons in layer 2/3 of rat neocortex is enhanced by backpropagating action potentials. J Neurosci. 2004;24:1319–1329. doi: 10.1523/JNEUROSCI.2852-03.2004. [DOI] [PMC free article] [PubMed] [Google Scholar]
- Kerr JN, Greenberg D, Helmchen F. Imaging input and output of neocortical networks in vivo. Proc Natl Acad Sci U S A. 2005;102:14063–14068. doi: 10.1073/pnas.0506029102. [DOI] [PMC free article] [PubMed] [Google Scholar]
- Koester HJ, Sakmann B. Calcium dynamics in single spines during coincident pre- and postsynaptic activity depend on relative timing of back-propagating action potentials and subthreshold excitatory postsynaptic potentials. Proc Natl Acad Sci U S A. 1998;95:9596–9601. doi: 10.1073/pnas.95.16.9596. [DOI] [PMC free article] [PubMed] [Google Scholar]
- Larkman AU. Dendritic morphology of pyramidal neurones of the visual cortex of the rat. III. Spine distributions. J Comp Neurol. 1991;306:332–343. doi: 10.1002/cne.903060209. [DOI] [PubMed] [Google Scholar]
- Larkum ME, Watanabe S, Nakamura T, Lasser-Ross N, Ross WN. Synaptically activated Ca2+ waves in layer 2/3 and layer 5 rat neocortical pyramidal neurons. J Physiol. 2003;549:471–488. doi: 10.1113/jphysiol.2002.037614. [DOI] [PMC free article] [PubMed] [Google Scholar]
- Legendre P, Rosenmund C, Westbrook GL. Inactivation of NMDA channels in cultured hippocampal neurons by intracellular calcium. J Neurosci. 1993;13:674–684. doi: 10.1523/JNEUROSCI.13-02-00674.1993. [DOI] [PMC free article] [PubMed] [Google Scholar]
- Lewis BL, O'Donnell P. Ventral tegmental area afferents to the prefrontal cortex maintain membrane potential ‘up’ states in pyramidal neurons via D1 dopamine receptors. Cereb Cortex. 2000;10:1168–1175. doi: 10.1093/cercor/10.12.1168. [DOI] [PubMed] [Google Scholar]
- Linden DJ. The return of the spike: postsynaptic action potentials and the induction of LTP and LTD. Neuron. 1999;22:661–666. doi: 10.1016/s0896-6273(00)80726-6. [DOI] [PubMed] [Google Scholar]
- MacLean JN, Watson BO, Aaron GB, Yuste R. Internal dynamics determine the cortical response to thalamic stimulation. Neuron. 2005;48:811–823. doi: 10.1016/j.neuron.2005.09.035. [DOI] [PubMed] [Google Scholar]
- Mainen ZF, Malinow R, Svoboda K. Synaptic calcium transients in single spines indicate that NMDA receptors are not saturated. Nature. 1999;399:151–155. doi: 10.1038/20187. Comment in Nature399, 111–112. [DOI] [PubMed] [Google Scholar]
- Markram H, Sakmann B. Calcium transients in dendrites of neocortical neurons evoked by single subthreshold excitatory postsynaptic potentials via low-voltage-activated calcium channels. Proc Natl Acad Sci U S A. 1994;91:5207–5211. doi: 10.1073/pnas.91.11.5207. [DOI] [PMC free article] [PubMed] [Google Scholar]
- Mennerick S, Zorumski CF. Postsynaptic modulation of NMDA synaptic currents in rat hippocampal microcultures by paired-pulse stimulation. J Physiol. 1996;490:405–417. doi: 10.1113/jphysiol.1996.sp021154. [DOI] [PMC free article] [PubMed] [Google Scholar]
- Milojkovic BA, Radojicic MS, Antic SD. A strict correlation between dendritic and somatic plateau depolarizations in the rat prefrontal cortex pyramidal neurons. J Neurosci. 2005;25:3940–3951. doi: 10.1523/JNEUROSCI.5314-04.2005. [DOI] [PMC free article] [PubMed] [Google Scholar]
- Milojkovic BA, Radojicic MS, Goldman-Rakic PS, Antic SD. Burst generation in rat pyramidal neurones by regenerative potentials elicited in a restricted part of the basilar dendritic tree. J Physiol. 2004;558:193–211. doi: 10.1113/jphysiol.2004.061416. [DOI] [PMC free article] [PubMed] [Google Scholar]
- Nakamura T, Barbara JG, Nakamura K, Ross WN. Synergistic release of Ca2+ from IP3-sensitive stores evoked by synaptic activation of mGluRs paired with backpropagating action potentials. Neuron. 1999;24:727–737. doi: 10.1016/s0896-6273(00)81125-3. [DOI] [PubMed] [Google Scholar]
- Nevian T, Larkum ME, Polsky A, Schiller J. Properties of basal dendrites of layer 5 pyramidal neurons: a direct patch-clamp recording study. Nat Neurosci. 2007;10:206–214. doi: 10.1038/nn1826. [DOI] [PubMed] [Google Scholar]
- Ngo-Anh TJ, Bloodgood BL, Lin M, Sabatini BL, Maylie J, Adelman JP. SK channels and NMDA receptors form a Ca2+-mediated feedback loop in dendritic spines. Nat Neurosci. 2005;8:642–649. doi: 10.1038/nn1449. [DOI] [PubMed] [Google Scholar]
- Nimchinsky EA, Yasuda R, Oertner TG, Svoboda K. The number of glutamate receptors opened by synaptic stimulation in single hippocampal spines. J Neurosci. 2004;24:2054–2064. doi: 10.1523/JNEUROSCI.5066-03.2004. [DOI] [PMC free article] [PubMed] [Google Scholar]
- Oakley JC, Schwindt PC, Crill WE. Dendritic calcium spikes in layer 5 pyramidal neurons amplify and limit transmission of ligand-gated dendritic current to soma. J Neurophysiol. 2001;86:514–527. doi: 10.1152/jn.2001.86.1.514. [DOI] [PubMed] [Google Scholar]
- Petersen CC. Short-term dynamics of synaptic transmission within the excitatory neuronal network of rat layer 4 barrel cortex. J Neurophysiol. 2002;87:2904–2914. doi: 10.1152/jn.2002.87.6.2904. [DOI] [PubMed] [Google Scholar]
- Petersen CC, Hahn TT, Mehta M, Grinvald A, Sakmann B. Interaction of sensory responses with spontaneous depolarization in layer 2/3 barrel cortex. Proc Natl Acad Sci U S A. 2003;100:13638–13643. doi: 10.1073/pnas.2235811100. [DOI] [PMC free article] [PubMed] [Google Scholar]
- Poirazi P, Brannon T, Mel BW. Pyramidal neuron as two-layer neural network. Neuron. 2003;37:989–999. doi: 10.1016/s0896-6273(03)00149-1. [DOI] [PubMed] [Google Scholar]
- Poirazi P, Mel BW. Impact of active dendrites and structural plasticity on the memory capacity of neural tissue. Neuron. 2001;29:779–796. doi: 10.1016/s0896-6273(01)00252-5. [DOI] [PubMed] [Google Scholar]
- Polsky A, Mel BW, Schiller J. Computational subunits in thin dendrites of pyramidal cells. Nat Neurosci. 2004;7:621–627. doi: 10.1038/nn1253. [DOI] [PubMed] [Google Scholar]
- Regehr WG, Tank DW. Calcium concentration dynamics produced by synaptic activation of CA1 hippocampal pyramidal cells. J Neurosci. 1992;12:4202–4223. doi: 10.1523/JNEUROSCI.12-11-04202.1992. [DOI] [PMC free article] [PubMed] [Google Scholar]
- Rigoni F, Deana R. Ruthenium red inhibits the mitochondrial Ca2+ uptake in intact bovine spermatozoa and increases the cytosolic Ca2+ concentration. FEBS Lett. 1986;198:103–108. doi: 10.1016/0014-5793(86)81193-0. [DOI] [PubMed] [Google Scholar]
- Sachdev RN, Ebner FF, Wilson CJ. Effect of subthreshold up and down states on the whisker-evoked response in somatosensory cortex. J Neurophysiol. 2004;92:3511–3521. doi: 10.1152/jn.00347.2004. [DOI] [PubMed] [Google Scholar]
- Schiller J, Helmchen F, Sakmann B. Spatial profile of dendritic calcium transients evoked by action potentials in rat neocortical pyramidal neurones. J Physiol. 1995;487:583–600. doi: 10.1113/jphysiol.1995.sp020902. [DOI] [PMC free article] [PubMed] [Google Scholar]
- Schiller J, Major G, Koester HJ, Schiller Y. NMDA spikes in basal dendrites of cortical pyramidal neurons. Nature. 2000;404:285–289. doi: 10.1038/35005094. [DOI] [PubMed] [Google Scholar]
- Segev I, Rall W. Excitable dendrites and spines: earlier theoretical insights elucidate recent direct observations. Trends Neurosci. 1998;21:453–460. doi: 10.1016/s0166-2236(98)01327-7. [DOI] [PubMed] [Google Scholar]
- Sejnowski TJ, Destexhe A. Why do we sleep? Brain Res. 2000;886:208–223. doi: 10.1016/s0006-8993(00)03007-9. [DOI] [PubMed] [Google Scholar]
- Sinha SR, Saggau P. Simultaneous optical recording of membrane potential and intracellular calcium from brain slices. Methods. 1999;18:175. doi: 10.1006/meth.1999.0773. [DOI] [PubMed] [Google Scholar]
- Sjostrom PJ, Hausser M. A cooperative switch determines the sign of synaptic plasticity in distal dendrites of neocortical pyramidal neurons. Neuron. 2006;51:227–238. doi: 10.1016/j.neuron.2006.06.017. [DOI] [PubMed] [Google Scholar]
- Sobczyk A, Svoboda K. Activity-dependent plasticity of the nmda-receptor fractional Ca2+ current. Neuron. 2007;53:17–24. doi: 10.1016/j.neuron.2006.11.016. [DOI] [PubMed] [Google Scholar]
- Spruston N, Jonas P, Sakmann B. Dendritic glutamate receptor channels in rat hippocampal CA3 and CA1 pyramidal neurons. J Physiol. 1995;482:325–352. doi: 10.1113/jphysiol.1995.sp020521. [DOI] [PMC free article] [PubMed] [Google Scholar]
- Steriade M, Contreras D, Curro Dossi R, Nunez A. The slow (< 1 Hz) oscillation in reticular thalamic and thalamocortical neurons: scenario of sleep rhythm generation in interacting thalamic and neocortical networks. J Neurosci. 1993;13:3284–3299. doi: 10.1523/JNEUROSCI.13-08-03284.1993. [DOI] [PMC free article] [PubMed] [Google Scholar]
- Takechi H, Eilers J, Konnerth A. A new class of synaptic response involving calcium release in dendritic spines. Nature. 1998;396:757–760. doi: 10.1038/25547. [DOI] [PubMed] [Google Scholar]
- Timofeev I, Grenier F, Bazhenov M, Sejnowski TJ, Steriade M. Origin of slow cortical oscillations in deafferented cortical slabs. Cereb Cortex. 2000;10:1185–1199. doi: 10.1093/cercor/10.12.1185. [DOI] [PubMed] [Google Scholar]
- Turecek R, Trussell LO. Control of synaptic depression by glutamate transporters. J Neurosci. 2000;20:2054–2063. doi: 10.1523/JNEUROSCI.20-05-02054.2000. [DOI] [PMC free article] [PubMed] [Google Scholar]
- Volgushev M, Chauvette S, Mukovski M, Timofeev I. Precise long-range synchronization of activity and silence in neocortical neurons during slow-wave sleep. J Neurosci. 2006;26:5665–5672. doi: 10.1523/JNEUROSCI.0279-06.2006. [DOI] [PMC free article] [PubMed] [Google Scholar]
- Wei DS, Mei YA, Bagal A, Kao JP, Thompson SM, Tang CM. Compartmentalized and binary behavior of terminal dendrites in hippocampal pyramidal neurons. Science. 2001;293:2272–2275. doi: 10.1126/science.1061198. [DOI] [PubMed] [Google Scholar]
- Westenbroek RE, Hell JW, Warner C, Dubel SJ, Snutch TP, Catterall WA. Biochemical properties and subcellular distribution of an N-type calcium channel α1 subunit. Neuron. 1992;9:1099–1115. doi: 10.1016/0896-6273(92)90069-p. [DOI] [PubMed] [Google Scholar]
- Yasuda R, Sabatini BL, Svoboda K. Plasticity of calcium channels in dendritic spines. Nat Neurosci. 2003;6:948–955. doi: 10.1038/nn1112. [DOI] [PubMed] [Google Scholar]
- Yuste R, Gutnick MJ, Saar D, Delaney KR, Tank DW. Ca2+ accumulations in dendrites of neocortical pyramidal neurons: an apical band and evidence for two functional compartments. Neuron. 1994;13:23–43. doi: 10.1016/0896-6273(94)90457-x. [DOI] [PubMed] [Google Scholar]
- Zilberter Y, Harkany T, Holmgren CD. Dendritic release of retrograde messengers controls synaptic transmission in local neocortical networks. Neuroscientist. 2005;11:334–344. doi: 10.1177/1073858405275827. [DOI] [PubMed] [Google Scholar]
- Zucker RS, Regehr WG. Short-term synaptic plasticity. Annu Rev Physiol. 2002;64:355–405. doi: 10.1146/annurev.physiol.64.092501.114547. [DOI] [PubMed] [Google Scholar]
Associated Data
This section collects any data citations, data availability statements, or supplementary materials included in this article.


