

Abstract
The voltage-gated potassium channels KV7.2 and KV7.3 (genes KCNQ2 and KCNQ3) constitute a major component of the M-current controlling the firing rate in many neurons. Mutations within these two channel subunits cause benign familial neonatal convulsions (BFNC). Here we identified a novel BFNC-causing mutation (E119G) in the S1–S2 region of KV7.2. Electrophysiological investigations in Xenopus oocytes using two-microelectrode voltage clamping revealed that the steady-state activation curves for E119G alone and its coexpressions with KV7.2 and/or KV7.3 wild-type (WT) channels were significantly shifted in the depolarizing direction compared to KV7.2 or KV7.2/KV7.3. These shifts reduced the relative current amplitudes for mutant channels particularly in the subthreshold range of an action potential (about 45% reduction at −50 mV for E119G compared to KV7.2, and 33% for E119G/KV7.3 compared to KV7.2/KV7.3 channels). Activation kinetics were significantly slowed for mutant channels. Our results indicate that small changes in channel gating at subthreshold voltages are sufficient to cause neonatal seizures and demonstrate the importance of the M-current for this voltage range. This was confirmed by a computer model predicting an increased burst duration for the mutation. On a molecular level, these results reveal a critical role in voltage sensing of the negatively charged E119 in S1–S2 of KV7.2, a region that – according to molecular modelling – might interact with a positive charge in the S4 segment.
The KCNQ gene family encodes five voltage-gated K+ channels, recently classified as KV7.1–KV7.5 (Gutman et al. 2005). All KV7 subunits can assemble into functional homomeric potassium channels (Jentsch, 2000). KV7.2–KV7.5, and probably in particular heteromeric KV7.2/KV7.3 channels constitute a major component of the M-current, a slowly activating and deactivating K+ current which can be suppressed by the activation of muscarinic acetylcholine receptors (Brown & Adams, 1980; Wang et al. 1998). Since neuronal KV7/M-type K+ channels activate near the threshold of action potential firing without significant inactivation, they can regulate neuronal excitability by antagonizing repetitive firing of neurons during persistent depolarizing inputs in many neurons of the peripheral and central nervous system (Delmas & Brown, 2005).
Mutations in four of the five KCNQ genes lead to inherited diseases of heart muscle, the inner ear or the brain, depending on the different expression patterns of the respective channels (Lehmann-Horn & Jurkat-Rott, 1999; Jentsch, 2000). Mutations in KCNQ2 or KCNQ3 cause benign familial neonatal convulsions (BFNC) (Biervert et al. 1998; Charlier et al. 1998; Singh et al. 1998; Jentsch, 2000; Steinlein, 2004; Lerche et al. 2005), which is characterized by frequent unprovoked seizures typically beginning within the first days of life and resolving after weeks to months. Patients usually have a normal psychomotor development, but learning disabilities or delayed speech development have been observed in a few individuals (Ronen et al. 1993), and recently also unfavourable outcomes with mental retardation have been described (Borgatti et al. 2004; Steinlein et al. 2007).
Most of the BFNC mutations were identified in KCNQ2 (Fig. 1B) and a few in KCNQ3. They reside predominantly in the pore region or the C-terminus (Lerche et al. 2005). Functional analyses of many BFNC-causing mutations have demonstrated a large (generally > 90%) reduction of the maximum K+ current of homomeric mutant subunits without a dominant-negative effect as the main molecular dysfunction, suggesting a mechanism of haploinsufficiency to be responsible for the phenotype (Biervert et al. 1998; Charlier et al. 1998; Schroeder et al. 1998; Singh et al. 1998; Lerche et al. 1999, 2005; Steinlein, 2004). However, a few mutations with a dominant-negative effect have been described, two of them causing peripheral nerve hyperexcitability with or without BFNC (Dedek et al. 2001; Singh et al. 2003; Wuttke et al. 2007)
Figure 1. Pedigree, BFNC-causing mutations within the KV7.2 subunit and evolutionary conservation of E119.

A, pedigree with clinical and genetic status. +/m: individuals carrying the A→G356 (E119G) mutation. Unaffected individuals are displayed with open symbols, affected ones with filled symbols. B, schematic view of a KV7.2 subunit depicting all mutations that have been described so far as white symbols (Borgatti et al. 2004; Lerche et al. 2005). E119G is marked by a black symbol. C, E119 is located within the S1–S2 loop of KV7.2 and is conserved in the orthologous KV7.2 protein of human, mouse and rat. Analogous amino acids are marked in bold. GenBank accession numbers from top are: AY889405, AF490773, AF087453, AF071491, AY114213, AF105216, AF249278.
Here, molecular genetic analysis in a BFNC family revealed a novel KCNQ2 mutation, E119G, which resides in the S1–S2 extracellular loop of the channel, a protein region which has not been associated with mutations so far (Fig. 1B). Biophysical analysis provided evidence for an important function of E119 in voltage sensing, similar to negative charges in the S2 segment of Shaker K+ channels (Papazian et al. 1995). Furthermore, our results provide a human model pointing to the importance of this ion channel for the regulation of neuronal firing properties at subthreshold voltages.
Methods
Subjects
All patients and their unaffected relatives (or their legal representatives) gave written informed consent to participate in the study. All studies conformed to the standards set by the Declaration of Helsinki, and all procedures were approved by the Ethical Committee of the University of Ulm, Germany. All available family members were interviewed in person or by telephone by an experienced paediatrician (JP), and epilepsy histories were documented and corroborated by other family members, except for I-2.
In the three-generation Caucasian family (Fig. 1A), individual I-2 (51 years old) was reported to be seizure free on a medication with valproic acid since a generalized tonic-clonic seizure 4 years ago, except for one additional seizure when she reduced the medication. No further details of her epilepsy could be obtained. Individual II-2 (32 years old) presented with epileptic seizures with an onset on postnatal day 2 or 3. The seizure semiology was not well remembered by the patient's parents. Epileptic seizures of individual II-3 (26 years old) were recurring during several weeks with an onset on postnatal day 3 and presented with screaming, followed by generalized stiffness with slight cloni of all extremities, cyanosis and tonic upward movement of the eyes. Episodes were self-terminating within 2 min. For individual III-1 (9 years old), a first episode with cyanosis and self-limiting cloni involving all four extremities was reported on postnatal day 5. It was followed the next day by three more episodes with generalized cloni which were accentuated on the right-hand side. For individual III-2 (7 years old), seizures started on postnatal day 3 with brief cloni of the right upper extremity and cyanosis of her lips, followed by a second identical episode after 1.5 h. Furthermore, seven generalized motor seizures with cyanosis and cloni were described for postnatal days 4 and 5. Convulsions lasted between 0.5 and 3 min and ceased spontaneously. Patient III-3 (almost 6 years) presented with a brief clonus involving both upper extremities on postnatal day 3 and with episodes of apnoea and cyanosis accompanied by generalized motor seizures on postnatal day 4. All affected individuals, except I-2, were treated with phenobarbital from the day of the first seizure for a period of 1 week up to 3 months. None of them experienced further seizures after discontinuation of the medication, except individual II-3 who experienced several recurrent seizures after discontinuation at the age of 3 months requiring a further 3 months of treatment.
The psychomotor development of all affected individuals was normal. The adults (I-2, II-2, II-3) all finished normal school within regular time. I-2 has been working on the family farm, II-2 was trained as a hair dresser and is now caring for her children, and II-3 is working as a trained saleswoman in a butchery. III-1 and III-2 are going to regular primary school and had good reports. III-3 is entering regular primary school this year.
Mutation analysis
Blood samples were obtained from all six affected family members and DNA was extracted by standard methods. In a candidate gene approach the coding regions and exon–intron boundaries of KCNQ2 were PCR amplified using previously published PCR primers (Singh et al. 2003). Gel-purified products were sequenced on an ABI 3100 automated sequencer. Patient sequences and those of controls were compared to published sequences for KCNQ2 (GenBank, NM_172107).
Mutagenesis and RNA preparation
Site-directed mutagenesis was used to introduce the amino acid exchange E119G in the KCNQ cDNA cloned in the pTLN vector. The insertion of the mutation was verified by automated DNA sequencing. Plasmids were digested with the Mlu I restriction enzyme to linearize the DNA. Linearized plasmids were in vitro transcribed using the SP6 mMessage mMachine kit (Ambion Inc., Austin, TX, USA) resulting in capped cRNA. Purity was checked by gel electrophoresis. Concentration was verified by spectrophotometry.
Oocyte preparation and injection
All procedures met the National Institutes of Health guidelines for the care and use of laboratory animals and were approved by the Regierungspraesidium Tuebingen, Germany. Female Xenopus laevis frogs were anaesthetized with Tricaine (0.1%; Sigma, Deisenhofen, Germany) and placed on ice to maintain anaesthesia. Oocytes were obtained surgically and immediately treated for 2 h with collagenase (2 mg ml−1 of type CLS III, Biochrom KG, Berlin, Germany) in OR2-solution (mm: 82.5 NaCl, 2.5 KCl, 1MgCl2 and 5 Hepes, pH 7.6) in order to remove follicular structures. Defolliculated oocytes were stored at 16°C in frog Ringer solution (mm: 115 NaCl, 2.5 KCl, 1.8 CaCl2 and 10 Hepes, pH 7.4) supplemented with 50 μg ml−1 gentamycin (Biochrom KG). Diluted cRNA 10–20 ng was injected into each oocyte within 24 h after preparation. Electrophysiological recordings were performed 3 days after injection.
Electrophysiology and data evaluation
Potassium currents were recorded using standard two-microelectrode voltage clamping, a Turbo TEC01C amplifier (npi electronic GmbH, Tamm, Germany) and pCLAMP data acquisition (Axon instruments, Union City, CA, USA), as previously described (Lerche et al. 1999). Frog Ringer solution (see above) was used as the bathing solution for all recordings. Recording electrodes were filled with 3 m KCl and had a resistance of 0.3–1 MΩ. Currents were low-pass filtered at 0.3 kHz and sampled at 1 kHz. Oocytes were clamped to a membrane potential of −80 mV followed by depolarizing 10 mV steps up to +20 mV. Tail currents were recorded at −30 mV and their amplitudes analysed to obtain conductance–voltage plots. Data were analysed using pCLAMP 6 with Microsoft Excel, and Origin 6.1 (OriginLab Corp., Northampton, MA, USA) software. A Boltzmann equation was fitted to conductance–voltage relationships: I/Imax(V) = 1/(1 + exp[(V−V0.5)/k]), with I/Imax being the initial normalized tail current amplitude, V0.5 the voltage of half-maximal activation and k a slope factor. Time constants of activation and deactivation were obtained by fitting a first order exponential function to the rising phase of the current traces or to the tail current decay. For statistical evaluation two-tailed, unpaired Student's t test was applied (P < 0.05 was considered to be significant). All data are shown as means ± s.e.m.
One compartment model for neuronal firing
We implemented a computer model of a one compartment excitable cell according to Golomb et al. (2006). The model comprises the following active currents: voltage-gated sodium (INa) and calcium (ICa) current, delayed rectifying (IDR), A-type (IA), M-type (IM), calcium-dependent (IC) and afterhyperpolarizing potential (IAHP) potassium current. In contrast to the original model, our INa also has a slow inactivation gate (Spampanato et al. 2004). The M-current is described by a Hodgkin–Huxley type model, with KCNQ/M-channels having one closed and one open state. Then the M-current is given by the following equation:
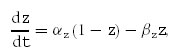
with gM= 1 μS cm−2 being the maximal M-current-mediated conductance and VK=−91 mV being the potassium equilibrium potential. V is the membrane potential and z the gating variable of M-channels; z is defined by the following differential equation:
 |
with
being the forward and backward rates, respectively.
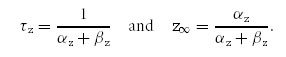
The time constant, τz, and the steady-state value, z∞, are given by:
 |
 represents the steady-state activation curve.
To obtain the parameters α^z, β^z, Vαz, Vβz, Kαz and Kβz, the functions τz and z∞ were simultaneously fitted to the normalized data points, describing (i) the τact–voltage and τdeact–voltage relationships and (ii) the conductance–voltage relationship, by minimizing the sum of χ2. We used the data derived from the coexpression experiments of KV7.2 and KV7.3. The results of the fit parameters are given in Table 2. All simulations were realized with Matlab V 7.3 (The MathWorks Inc., Natick, Massachusetts, USA).
Table 2.
Simulation parameters for the M-current
| Symbol | Unit | KV7.2/7.3 | E119G/KV7.2/KV7.3 |
|---|---|---|---|
| α^z | mV−1 s−1 | 0.239 | 0.247 |
| Vαz | mV | −40.6 | −25.9 |
| Kαz | mV | 7.8 | 10.2 |
| β^z | s−1 | 1.243 | 1.084 |
| Vβz | mV | −52.4 | −49.8 |
| Kβz | mV | 31.3 | 25.5 |
Results of curve fittings as described in Methods.
Generation of a KV7.2 transmembrane model
The putative position of E119G was estimated using molecular modelling. We generated a homology model of the S1–S6 domains of KV7.2 (NM_172107) based on the X-ray coordinates of the KV1.2 K+ channel crystal structure (PDB ID 2A79; Long et al. 2005). At first we generated a model for segments S4–S6 using classical homology modelling based on amino acid similarities between KV7.2 and KV1.2. Since the published structural coordinates of KV1.2 do not provide coordinates of side chains from transmembrane segments S1–S3 and the respective linkers, we generated a peptide chain encoding the amino acids 80–325 of KV7.2 de novo. We assigned an α-helical structure to putative transmembrane domains S1–S3. Using the residues glycine and proline as potential kinking points and the positions of the KV1.2 S1–S3 helices as a framework, we were able to position the putative KV7.2 transmembrane segments similarly to the α-helices of the KV1.2 structure. This was achieved by several manual adaptations each followed by energy optimization steps. Force fields used for energy minimizations were GROMOS96 (Deep View/Swiss PDB viewer) and AMBER (BALLVIEW1).
Results
Molecular genetic analysis
Sequence analysis of KCNQ2 of all affected patients revealed a heterozygous point mutation (A356G) predicting the amino acid substitution of glycine for glutamate at position 119. This mutation was excluded in 96 normal controls by direct sequencing. E119 is located within the S1–S2 extracellular loop of KV7.2 and is evolutionarily conserved in the orthologous mouse and rat KV7.2 channels (Fig. 1B and C).
Electrophysiology
KV7.2 and KV7.3 WT channels and the E119G mutation were heterologously expressed alone or in various combinations in Xenopus laevis oocytes and functionally characterized using a standard two-microelectrode voltage clamp method. Oocytes were depolarized from a holding potential of −80 mV in 10 mV steps up to +20 mV followed by a pulse to −30 mV to record tail currents (Fig. 2A). Steady-state activation curves were constructed by analysing tail current amplitudes. The conductance–voltage relationship was significantly shifted towards depolarized voltages for E119G compared to KV7.2 WT channels (Fig. 2B), resulting in a reduction of the normalized current amplitudes in the subthreshold range of an action potential between −50 and −30 mV. At −50 mV a highly significant reduction by 45% was observed (P < 0.0001, Table 1). The voltage dependence of the kinetics of activation was shifted by approximately +10 mV with a slower activation time course for the mutant channel for potentials between −40 mV and +30 mV (Fig. 2C), whereas the deactivation kinetics were not significantly changed (Fig. 2D).
Figure 2. Functional analysis of homomeric and heteromeric KV7.2 WT and mutant channels.

A, representative raw current traces for KV7.2 WT and E119G mutated channels. Currents were elicited from a holding potential of −80 mV by depolarizations ranging from −80 to +20 mV in 10 mV steps, followed by a pulse to −30 mV to obtain tail currents. B, conductance–voltage curves were constructed by plotting the normalized tail current amplitude recorded at −30 mV against the membrane potential. Lines represent standard Boltzmann functions fitted to the data points. Parameters were as follows: KV7.2 (n = 12): V0.5=−40.7 ± 0.9 mV, k =−8.4 ± 0.3 mV; E119G (n = 18): V0.5=−36.4 ± 0.6 mV, k =−8.2 ± 0.3 mV; E119G/KV7.2 (n = 5): V0.5=−33.9 ± 0.8 mV, k =−8.1 ± 0.2 mV (P < 0.001 for V0.5 for both conditions with mutant channels versus WT). Inset: representative current traces at −50 mV, normalized to the maximal current amplitude at +10 mV, illustrating the difference of current amplitudes. C, time constants of activation (τact) for KV7.2, E119G and the E119G/KV7.2 coexpression were obtained by fitting a first order exponential function to the rising part of each current trace. Values for τact were plotted against voltage, revealing an about 10 mV rightward shift of the voltage dependence of activation of E119G (n = 20) in comparison to KV7.2 (n = 21). Activation time constants were significantly different for potentials between −40 mV and 30 mV (−40 mV and 20 mV: P < 0.01; −30 mV to 10 mV: P < 0.001; 30 mV: P < 0.05). For the coexpression of E119G/KV7.2 channels (n = 5), the difference from WT KV7.2 channels reached statistical significance for potentials between −50 mV and 10 mV (−50 mV to −30 mV: P < 0.001; −20 mV and −10 mV: P < 0.01; 0 mV and 10 mV: P < 0.05). D, time constants of deactivation (τdeact) of KV7.2 (n = 9) and E119G (n = 11) were evaluated by fitting a first order exponential function to the tail current decay at different potentials after a 1.5 s lasting depolarizing pulse to +50. Values for τdeact were plotted against voltage and did not show a significant difference for potentials ranging between −140 mV and −100 mV. All data are shown as means ± s.e.m.
Table 1.
Comparison of normalized current amplitudes in the subthreshold range of an action potential
| Channel | Normalized current amplitude | ||
|---|---|---|---|
| −50 mV | −40 mV | −30 mV | |
| KV7.2 | 0.22 ± 0.02 | 0.52 ± 0.03 | 0.75 ± 0.02 |
| E119G | 0.12 ± 0.01 (****) | 0.39 ± 0.02(***) | 0.68 ± 0.02(*) |
| E119G/KV7.2 | 0.08 ± 0.01 (***) | 0.32 ± 0.02(***) | 0.62 ± 0.02(**) |
| KV7.2/KV7.3 | 0.21 ± 0.01 | 0.49 ± 0.02 | 0.72 ± 0.02 |
| E119G/KV7.3 | 0.14 ± 0.02 (**) | 0.38 ± 0.02(**) | 0.64 ± 0.02 (*) |
| E119G/KV7.2/KV7.3 | 0.17 ± 0.01 (*) | 0.43 ± 0.01(*) | 0.68 ± 0.02 (n.s) |
Normalized current amplitudes, derived from the activation curves as shown in Figs 2 and 3, of KV7.2 (n = 12), E119G (n = 18), KV7.2/KV7.3 (n = 12) and coexpressions of E119G/KV7.2 (1 : 1 ratio) (n = 5), E119G/KV7.3 (1 : 1 ratio) (n = 8) or E119G/KV7.2/KV7.3 (1 : 1 : 2 ratio) (n = 10) are compared at subthreshold voltages (−50, −40 and −30 mV). A significant reduction of relative current amplitudes was observed for the homomeric E119G channel and for heteromeric channels harbouring the E119G mutant in comparison to KV7.2 or KV7.2/KV7.3 WT channels, respectively. Data are shown as mean ± s.e.m.
P < 0.05
P < 0.01
P < 0.001
P < 0.0001.
To mimic the heterologous condition in a patient carrying one normal and one mutated allele, we also performed coexpressions of E119G with KV7.2 channels. The depolarizing shifts of both the steady-state activation curve and the kinetics of activation (for potentials between −50 mV and +10 mV) were verified to occur also for the coexpression compared to KV7.2 channels expressed alone, when the same total amount of cRNA was injected in a 1 : 1 ratio (Fig. 2B and C). Since heteromeric KV7.2/KV7.3 channels may represent a common correlate of the M-current within the mammalian brain, we additionally evaluated the functional consequences of the E119G mutation for heteromeric conditions with KV7.3 channels. Co-expressions with the same total amount of injected cRNA of E119G with KV7.3 in a 1 : 1, and E119G with KV7.2 and KV7.3 in a 1 : 1 : 2 ratio (to mimic the situation in an affected individual carrying 1 mutant KCNQ2, 1 WT KCNQ2 and 2 WT KCNQ3 alleles) were compared to a 1 : 1 coexpression of KV7.2 and KV7.3 WT channels. Compared to the data for the homomeric expressions, the results were generally similar but less pronounced. Conductance–voltage curves were still significantly shifted yielding a reduction of the relative current amplitudes at subthreshold voltages for both coexpressions compared to WT channels (Fig. 3A and Table 1). At −50 mV, the relative amplitudes were reduced by 33% (P < 0.01) and 19% (P < 0.05) for E119G/KV7.3 and E119/KV7.2/KV7.3 compared to KV7.2/KV7.3 channels, respectively. Also the activation time constants (τact) were significantly increased (Fig. 3B), whereas the deactivation kinetics were not significantly different, although there was a trend towards a slightly faster deactivation for the mutant channel (Fig. 3C).
Figure 3. Functional analysis of heteromeric KV7.2/KV7.3 WT and mutant channels.

A, conductance–voltage curves as described in Fig. 2B for coexpressions of KV7.2/KV7.3, E119G/KV7.3 and E119G/KV7.2/KV7.3 channels. cRNA was injected in either a 1 : 1 or a 1 : 1 : 2 ratio. Lines represent standard Boltzmann functions fitted to the data points. Parameters were as follows: KV7.2/KV7.3 (n = 12): V0.5=−39.4 ± 0.7 mV, k =−9.3 ± 0.5 mV; E119G/KV7.3 (n = 8): V0.5=−35.7 ± 0.7 mV (P < 0.01), k =−9.6 ± 0.9 mV; E119G/KV7.2/KV7.3 (n = 10): V0.5=−37.4 ± 0.5 mV (P < 0.05), k =−9.1 ± 0.5 mV. B, time constants of activation (τact) for KV7.2/KV7.3 (n = 12), E119G/KV7.3 (n = 9) and E119G/KV7.2/KV7.3 (n = 12) channels were obtained as described in the legend to Fig. 2. Activation kinetics were slowed for most of the potentials for E119G/KV7.3 (−10 mV to 10 mV: P < 0.05; 20 mV to 60 mV: P < 0.01) and for E119G/KV7.2/KV7.3 (−50 mV: P < 0.05; −30 mV to 10 mV: P < 0.01; 20 mV to 40 mV: P < 0.001; 50 mV and 60 mV: P < 0.0001) in comparison to KV7.2/KV7.3 channels. C, time constants of deactivation (τdeact) of KV7.2/KV7.3 (n = 5) and E119G/KV7.3 (n = 6) were evaluated as described in the legend to Fig. 2 and were not significantly different. All data are shown as means ± s.e.m.
To estimate if there could be additional changes in surface expression induced by the mutation, we evaluated absolute current amplitudes at the end of a 2 s depolarization to 0 mV, a potential at which a plateau in the conductance–voltage relationship was reached (compare Figs 2B and 3A). Up to three different batches of oocytes were injected with cRNAs coding for WT or mutant channels as monomers or in different combinations. To pool data from different experiments, amplitudes were normalized to the mean one of KV7.2 or KV7.2/KV7.3 that were injected and recorded in parallel with the mutation. Normalized relative amplitudes ranged between 0.7 and 1.8 for KV7.2 and between 0.1 and 1.7 for E119G revealing a broad overlap of data points (Fig. 4). The pooled data from three batches of oocytes revealed a slight but significant decrease for the amplitudes of E119G versus KV7.2 (P < 0.01). However, this potential mutational effect was not present in any of the coexpression experiments (Fig. 4). In contrast, the depolarizing shift in the voltage dependence of activation and the reduction of relative current amplitudes at subthreshold voltages were consistently found in all of the experiments.
Figure 4. Comparison of maximal current amplitudes.

Maximal current amplitudes were analysed after a depolarization lasting 2 s to 0 mV from a holding potential of −80 mV. To pool recordings from different experiments, amplitudes were normalized to the mean value of the amplitudes of KV7.2 or KV7.2/KV7.3 that were obtained after simultaneous injections and recordings in parallel to the other clones. Co-expressions of the mutation with KV7.2 or KV7.3 were obtained by injection of a constant total amount of RNA in a 1 : 1 or 1 : 1 : 2 ratio in Xenopus oocytes. Two to three different batches of oocytes were injected. Normalized amplitudes ranged between 0.4 and 1.8 for KV7.2 (n = 21) and between 0.1 and 1.7 for the E119G mutation (n = 20) revealing a broad overlap of data points. Pooled data from all batches exhibited a 34% decrease of the mean value of current amplitudes compared to the WT (P < 0.01). However, a reduction of the current amplitude could not be confirmed for either heteromeric E119G/KV7.2 (n = 5) compared to KV7.2, or E119G/KV7.3 (n = 9) and E119G/KV7.2/KV7.3 (n = 6) compared to KV7.2/KV7.3 channels (n = 12). Data are shown as single data points for each oocyte and as means ± s.e.m.
Discussion
Clinical data and pathogenicity of the E119G mutation
Here we identified a novel KCNQ2 mutation found in a three generation BFNC family with six affected members. The obtainable clinical information on individual I-2 was not sufficient to diagnose BFNC (no history of the neonatal period available), but she had two generalized tonic clonic seizures and carried the mutation so that she can be considered as affected. All other affected individuals presented with an age of onset and seizures typical for BFNC, and psychomotor development was normal in all six affected members, thus reflecting a mild phenotype in this family. The disease status completely cosegregated with the mutation indicating a full penetrance. Furthermore, the mutation affected a conserved residue (Fig. 1B and C) and was not found in a large number of normal controls, so that even without considering the functional data, there is substantial evidence to consider the mutation as disease-causing.
Our electrophysiological investigations showed rather subtle changes of channel gating when compared to other mutations in KCNQ2 causing BFNC. We found a slight depolarizing shift in steady-state activation and a minor slowing of the activation time course. However, both alterations were consistently found in various coexpression experiments to be statistically significant, so that they have to be considered as real changes due to the mutation. In contrast, there was no evidence for a consistent reduction in maximal current amplitudes, as reported for most of the other BFNC mutations (Biervert et al. 1998; Schroeder et al. 1998; Lerche et al. 1999; Dedek et al. 2001; Singh et al. 2003; Steinlein, 2004; Lerche et al. 2005).
Genotype–phenotype correlations in BFNC
As we observed a mild clinical phenotype combined with subtle electrophysiological changes, the question arises whether the increasingly observed unfavourable outcomes with mental retardation (Borgatti et al. 2004; Steinlein et al. 2007) are associated with a stronger loss of function of M-channels. Borgatti et al. (2004) described a mutation with a similar but more pronounced shift of the activation curve, and Steinlein et al. (2007) noted that mutations associated with mental retardation were mainly located in the functionally important S5–S6 region (a functional analysis was not performed in this study). On the other hand, mutations causing a > 90% reduction in KV7.2-mediated current amplitude (when this subunit is expressed alone) are also associated with a good outcome in most cases. Two mutations within the voltage sensor (R207W, R207Q), which induce a very strong slowing and depolarizing shifts of activation with a dominant-negative effect on WT channels, may be the most severe mutations described from an electrophysiological point of view. They are the only mutations causing peripheral nerve hyperexcitability, either with or without BFNC (Dedek et al. 2001; Wuttke et al. 2007). Two of five individuals (however, genetically identical twins) carrying the most severe R207W mutation have mild learning disabilities (Dedek et al. 2001). Thus, mutations with a more severe electrophysiological phenotype might have a tendency to be more often associated with mental retardation, but more solid data with long-term outcomes are necessary to confirm this hypothesis. Other, yet unkown genetic factors could also be responsible for a poor outcome.
Structure–function considerations suggesting a possible interaction of S1–S2 with S4
These molecular findings suggest the involvement of the S1–S2 region of the KV7.2 channel (probable location of the mutation according to a recent structural model of a mammalian KV channel (Long et al. 2005) and the sequence homologies shown in Fig. 1C) in voltage-dependent gating. More specifically, as alterations of the voltage dependence of activation or the time constants of activation are mostly attributed to a modulation of the voltage sensor (Dedek et al. 2001; Castaldo et al. 2002; Hackos et al. 2002; Yellen, 2002; Zhao et al. 2004), the question of a possible interaction between S1–S2 and the voltage sensor S4 arises. Negatively charged residues deep within S2 have been shown to interact with positively charged residues of S4 voltage sensors (Papazian et al. 1995; Zhang et al. 2007), but no such interactions have been proposed thus far for residues located in the adjacent extracellular S1–S2 region. The presence of another BFNC-causing mutation in KV7.2, S122L, which is located just three residues apart from E119 and which shows very similar biophysical changes of voltage-dependent activation to E119G (Hunter et al. 2006), may indicate that both S122 and E119 face in the same direction of an α helix and interact with S4.
To further estimate the position of residues E119 and S122 relative to the S4 segment, we generated a three-dimensional model based on sequence homology for segments S4–S6 and assuming a structural similarity of segments S1–S3 of KV7.2 with the published coordinates of KV1.2 (Fig. 5, Long et al. 2005). Whereas the model can be expected to be relatively robust in the S4–S6 region due to the high sequence homology, it is based on a series of assumptions in the S1–S3 region. The assumptions for model generation of S1–S3 are (i) the putative transmembrane domains are α-helices, (ii) the transmembrane domains have a similar position as the transmembrane α-helices in the solved KV1.2 structure, and (iii) the positioning is further determined by the physico-chemical nature of the linkers and helices (most importantly by the linker length, as defined by the amino acids between two α-helices, and by prolines and glycines providing flexibility and kinks to the structure). These assumptions represent known limitations of the generated model. Based on this model we find the positions of residues E119 and S122 in the outer end of S1 in close proximity to S4 and S5. Particularly, both residues are predicted to be positioned closely to the positively charged arginine R201 of the S4 voltage sensor suggesting either electrostatic interactions or the formation of hydrogen bonds between the respective residues E119/S122 and R201.
Figure 5. Structural model of the KV7.2 channel.

KV7.2 channels were generated based on the coordinates of KV1.2 (PDB ID 2A79; Long et al. 2005). The transmembrane segments S1–S4 of one subunit are coloured (S1 (yellow), S2 (orange), S3 (red), S4 (pink) and the pore domain of the adjacent subunit (S5 (green), selectivity filter/pore helix (light blue), S6 (blue)). A, overview of 4 subunits. B and C, magnifications show the putative positions of the residues E119 and S122 in the outer S1 segment and their possible electrostatic interaction or formation of hydrogen bonds with R201 in S4 in top view and side view. Residues E119, S122 and R201 are shown in stick representation (CPK colour code) and putative electrostatic interactions or h-bonds are depicted as green dashed lines. The sequence of KV7.2 is given underneath using the same colours as in the structural model for transmembrane segments. Residues E119, S122 and R201 are printed in bold and underlined. Residues in S1–S4 used to provide flexibility to the model are underlayed in grey.
These data are consistent with the experimental findings of this and our previous study (Hunter et al. 2006) showing that both mutations E119G and S122L induce similar changes in the voltage dependence of activation. However, due to the hypothetical nature of our model such specific interactions remain speculative and have to be interpreted with caution.
Implications of subtle subthreshold changes in M-channel gating
It has been previously suggested that the M-current is involved in the fine regulation of the neuronal membrane potential and that it has a strong impact on spike-frequency adaptation of action potentials at subthreshold voltages, at which not many other channels open (Delmas & Brown, 2005). In this regard, KCNQ/M-channels have been shown to modulate spike afterdepolarization in hippocampal pyramidal neurons (Yue & Yaari, 2004). In contrast to other BFNC-causing mutations which reduce the resulting potassium current over the whole voltage range (Biervert et al. 1998; Schroeder et al. 1998; Lerche et al. 1999, 2005; Dedek et al. 2001; Singh et al. 2003; Steinlein, 2004), the biophysical changes of E119G and S122L (Hunter et al. 2006) are most evident or even restricted to the subthreshold range of an action potential between −60 and −30 mV. Therefore, our data generated from a human disease model strongly support the hypothesis that M-channels act predominantly at subthreshold voltages. The reduction of relative current amplitudes and the slowing of activation lead to a partial loss of function, which can well explain an increase in neuronal firing and the occurrence of epileptic seizures.
To test this hypothesis, we implemented a one compartment cell model to simulate neuronal firing in the presence of M-currents mediated by WT and mutant KV7.2 and KV7.3 channels (see Methods; Spampanato et al. 2004; Golomb et al. 2006). Under the assumption of an equal expression of WT and mutant channels, we obtained the numeric values of the fit parameters given in Table 2. Figure 6A and B depicts simulated bursts of action potentials for a constant current injection of 1 μA cm−2. The simulation predicts that M-currents mediated by KV7 channels act as an early break on repetitive firing and lead to a fast decline of discharge frequency. These effects were less pronounced for the combination of E119G/KV7.2/KV7.3 in comparison to KV7.2/KV7.3 WT channels. Comparing the duration of bursts, elicited by increasing current injection revealed much longer bursts for simulated cells containing mutant channels (Fig. 6C). Taken together, these simulations strengthen the hypothesis that even a slight loss of M-current function in the subthreshold range can increase neuronal excitability triggering epileptic seizures in BFNC.
Figure 6. Firing properties in a one compartment neuronal model cell.

A and B, model cells are continuously stimulated by the current Istim from time t = 0 ms. The M-current, IM, is represented by KV7.2/KV7.3 (A) or E119G/KV7.2/KV7.3 (B) channels (parameters in Table 2). The duration of the evoked action potential burst is relatively prolonged in cells in which IM is mediated by E119G/KV7.2/KV7.3 channels. Istim= 1 μA cm−2. C, burst duration as a function of Istim. The increase in burst duration with increasing Istim is steeper in cells that are simulated using the mutant channel. There is a threshold above which the M-current is insufficient to terminate the burst. This threshold is lower in simulations with parameters for mutant channels (continuous line KV7.2/KV7.3, dotted line E119G/KV7.2/KV7.3).
Acknowledgments
We thank all family members who participated in this study and Prof Thomas Jentsch for providing the KCNQ2 and KCNQ3 cDNAs. This study was supported by grants from the Bundesministerium für Bildung und Forschung (BMBF/NGFN2: 01GS0478), the Thyssen-Stiftung, the state Baden-Württemberg (Landesforschungsschwerpunkt 1423/74), the Deutsche Forschungsgemeinschaft (DFG: Le1030/9-1) and the European Union (Epicure: LSH 037315) (to H.L.). T.V.W. was supported in part by a fellowship from the University of Ulm. H.L. is a Heisenberg fellow of the DFG.
References
- Biervert C, Schroeder BC, Kubisch C, Berkovic SF, Propping P, Jentsch TJ, Steinlein OK. A potassium channel mutation in neonatal human epilepsy. Science. 1998;279:403–406. doi: 10.1126/science.279.5349.403. [DOI] [PubMed] [Google Scholar]
- Borgatti R, Zucca C, Cavallini A, Ferrario M, Panzeri C, Castaldo P, Soldovieri MV, Baschirotto C, Bresolin N, Dalla Bernardina B, Taglialatela M, Bassi MT. A novel mutation in KCNQ2 associated with BFNC, drug resistant epilepsy, and mental retardation. Neurology. 2004;63:57–65. doi: 10.1212/01.wnl.0000132979.08394.6d. [DOI] [PubMed] [Google Scholar]
- Brown DA, Adams PR. Muscarinic suppression of a novel voltage-sensitive K+ current in a vertebrate neurone. Nature. 1980;283:673–676. doi: 10.1038/283673a0. [DOI] [PubMed] [Google Scholar]
- Castaldo P, Del Giudice EM, Coppola G, Pascotto A, Annunziato L, Taglialatela M. Benign familial neonatal convulsions caused by altered gating of KCNQ2/KCNQ3 potassium channels. J Neurosci. 2002;22:RC199. doi: 10.1523/JNEUROSCI.22-02-j0003.2002. [DOI] [PMC free article] [PubMed] [Google Scholar]
- Charlier C, Singh NA, Ryan SG, Lewis TB, Reus BE, Leach RJ, Leppert M. A pore mutation in a novel KQT-like potassium channel gene in an idiopathic epilepsy family. Nat Genet. 1998;18:53–55. doi: 10.1038/ng0198-53. [DOI] [PubMed] [Google Scholar]
- Dedek K, Kunath B, Kananura C, Reuner U, Jentsch TJ, Steinlein OK. Myokymia and neonatal epilepsy caused by a mutation in the voltage sensor of the KCNQ2 K+ channel. Proc Natl Acad Sci U S A. 2001;98:12272–12277. doi: 10.1073/pnas.211431298. [DOI] [PMC free article] [PubMed] [Google Scholar]
- Delmas P, Brown DA. Pathways modulating neural KCNQ/M (Kv7) potassium channels. Nat Rev Neurosci. 2005;6:850–862. doi: 10.1038/nrn1785. [DOI] [PubMed] [Google Scholar]
- Golomb D, Yue C, Yaari Y. Contribution of persistend Na+ current to somatic bursting in CA1 pyramidal cells: Combined experimental and modeling study. J Neurophysiol. 2006;96:1912–1926. doi: 10.1152/jn.00205.2006. [DOI] [PubMed] [Google Scholar]
- Gutman GA, Chandy KG, Grissmer S, Lazdunski M, McKinnon D, Pardo LA, Robertson GA, Rudy B, Sanguinetti MC, Stuhmer W, Wang X. International Union of Pharmacology. LIII. Nomenclature and molecular relationships of voltage-gated potassium channels. Pharmacol Rev. 2005;57:473–508. doi: 10.1124/pr.57.4.10. [DOI] [PubMed] [Google Scholar]
- Hackos DH, Chang TH, Swartz KJ. Scanning the intracellular S6 activation gate in the shaker K+ channel. J Gen Physiol. 2002;119:521–532. doi: 10.1085/jgp.20028569. [DOI] [PMC free article] [PubMed] [Google Scholar]
- Hunter J, Maljevic S, Shankar A, Siegel A, Weissman B, Holt P, Olson L, Lerche H, Escayg A. Subthreshold changes of voltage-dependent activation of the KV7.2 channel in neonatal epilepsy. Neurobiol Dis. 2006;24:194–201. doi: 10.1016/j.nbd.2006.06.011. [DOI] [PubMed] [Google Scholar]
- Jentsch TJ. Neuronal KCNQ potassium channels: physiology and role in disease. Nat Rev Neurosci. 2000;1:21–30. doi: 10.1038/35036198. [DOI] [PubMed] [Google Scholar]
- Lehmann-Horn F, Jurkat-Rott K. Voltage-gated ion channels and hereditary disease. Physiol Rev. 1999;79:1317–1372. doi: 10.1152/physrev.1999.79.4.1317. [DOI] [PubMed] [Google Scholar]
- Lerche H, Biervert C, Alekov AK, Schleithoff L, Lindner M, Klinger W, Bretschneider F, Mitrovic N, Jurkat-Rott K, Bode H, Lehmann-Horn F, Steinlein OK. A reduced K+ current due to a novel mutation in KCNQ2 causes neonatal convulsions. Ann Neurol. 1999;46:305–312. doi: 10.1002/1531-8249(199909)46:3<305::aid-ana5>3.0.co;2-5. [DOI] [PubMed] [Google Scholar]
- Lerche H, Weber YG, Jurkat-Rott K, Lehmann-Horn F. Ion channel defects in idiopathic epilepsies. Curr Pharm Des. 2005;11:2737–2752. doi: 10.2174/1381612054546815. [DOI] [PubMed] [Google Scholar]
- Long SB, Campbell EB, Mackinnon R. Crystal structure of a mammalian voltage-dependent Shaker family K+ channel. Science. 2005;309:897–903. doi: 10.1126/science.1116269. [DOI] [PubMed] [Google Scholar]
- Papazian DM, Shao XM, Seoh SA, Mock AF, Huang Y, Wainstock DH. Electrostatic interactions of S4 voltage sensor in Shaker K+ channel. Neuron. 1995;14:1293–1301. doi: 10.1016/0896-6273(95)90276-7. [DOI] [PubMed] [Google Scholar]
- Ronen GM, Rosales TO, Connolly M, Anderson VE, Leppert M. Seizure characteristics in chromosome 20 benign familial neonatal convulsions. Neurology. 1993;43:1355–1360. doi: 10.1212/wnl.43.7.1355. [DOI] [PubMed] [Google Scholar]
- Schroeder BC, Kubisch C, Stein V, Jentsch TJ. Moderate loss of function of cyclic-AMP-modulated KCNQ2/KCNQ3 K+ channels causes epilepsy. Nature. 1998;396:687–690. doi: 10.1038/25367. [DOI] [PubMed] [Google Scholar]
- Singh NA, Charlier C, Stauffer D, DuPont BR, Leach RJ, Melis R, Ronen GM, Bjerre I, Quattlebaum T, Murphy JV, McHarg ML, Gagnon D, Rosales TO, Peiffer A, Anderson VE, Leppert M. A novel potassium channel gene, KCNQ2, is mutated in an inherited epilepsy of newborns. Nat Genet. 1998;18:25–29. doi: 10.1038/ng0198-25. [DOI] [PubMed] [Google Scholar]
- Singh NA, Westenskow P, Charlier C, Pappas C, Leslie J, Dillon J, Anderson VE, Sanguinetti MC, Leppert MF. KCNQ2 and KCNQ3 potassium channel genes in benign familial neonatal convulsions: expansion of the functional and mutation spectrum. Brain. 2003;126:2726–2737. doi: 10.1093/brain/awg286. [DOI] [PubMed] [Google Scholar]
- Spampanato J, Aradi I, Soltesz I, Goldin AL. Increased neuronal firing in computer simulations of sodium channel mutations that cause generalized epilepsy with febrile seizures plus. J Neurophysiol. 2004;91:2040–2050. doi: 10.1152/jn.00982.2003. [DOI] [PubMed] [Google Scholar]
- Steinlein OK. Genetic mechanisms that underlie epilepsy. Nat Rev Neurosci. 2004;5:400–408. doi: 10.1038/nrn1388. [DOI] [PubMed] [Google Scholar]
- Steinlein OK, Conrad C, Weidner B. Benign neonatal convulsions: always benign? Epilepsy Res. 2007;73:245–249. doi: 10.1016/j.eplepsyres.2006.10.010. [DOI] [PubMed] [Google Scholar]
- Wang HS, Pan Z, Shi W, Brown BS, Wymore RS, Cohen IS, Dixon JE, McKinnon D. KCNQ2 and KCNQ3 potassium channel subunits: molecular correlates of the M-channel. Science. 1998;282:1890–1893. doi: 10.1126/science.282.5395.1890. [DOI] [PubMed] [Google Scholar]
- Wuttke TV, Jurkat-Rott K, Paulus W, Garncarek M, Lehmann-Horn F, Lerche H. Peripheral nerve hyperexcitability due to dominant-negative KCNQ2 mutations. Neurology. 2007;69:2045–2053. doi: 10.1212/01.wnl.0000275523.95103.36. [DOI] [PubMed] [Google Scholar]
- Yellen G. The voltage-gated potassium channels and their relatives. Nature. 2002;419:35–42. doi: 10.1038/nature00978. [DOI] [PubMed] [Google Scholar]
- Yue C, Yaari Y. KCNQ/M channels control spike afterdepolarization and burst generation in hippocampal neurons. J Neurosci. 2004;24:4614–4624. doi: 10.1523/JNEUROSCI.0765-04.2004. [DOI] [PMC free article] [PubMed] [Google Scholar]
- Zhang L, Sato Y, Hessa T, Von Heijne G, Lee JK, Kodama I, Sakaguchi M, Uozumi N. Contribution of hydrophobic and electrostatic interactions to the membrane integration of the Shaker K+ channel voltage sensor domain. Proc Natl Acad Sci U S A. 2007;104:8263–8268. doi: 10.1073/pnas.0611007104. [DOI] [PMC free article] [PubMed] [Google Scholar]
- Zhao Y, Yarov-Yarovoy V, Scheuer T, Catterall WA. A gating hinge in Na+ channels; a molecular switch for electrical signaling. Neuron. 2004;41:859–865. doi: 10.1016/s0896-6273(04)00116-3. [DOI] [PubMed] [Google Scholar]