Abstract
Detailed information about the ligand-binding site of nicotinic acetylcholine receptors has emerged from structural and mutagenesis experiments. However, these approaches provide only static images of ligand–receptor interactions. Kinetic measurements of changes in protein function are needed to develop a more dynamic picture. Previously, we measured association and dissociation rate constants for competitive inhibition of current through embryonic muscle acetylcholine receptor channels at 25°C. Little is known about competitive antagonism at physiological temperatures. Here, we performed measurements at 37°C and used thermodynamics to estimate the energetics of antagonism. We used rapid solution exchange protocols to determine equilibrium and kinetics of inhibition of acetylcholine-activated currents in outside-out patches by (+)-tubocurarine, pancuronium and cisatracurium. Kinetic rates as high as 600 s−1 were resolved by this technique. Binding was primarily enthalpy driven. The 12°C increase in temperature decreased equilibrium antagonist binding by 1.7- to 1.9-fold. In contrast, association and dissociation rate constants increased 1.9- to 6.0-fold. Activation energies for dissociation were 90 ± 6, 106 ± 8 and 116 ± 10 kJ mol−1 for cisatracurium, (+)-tubocurarine and pancuronium, respectively. The corresponding apparent activation energies for association were 38 ± 6, 85 ± 6 and 107 ± 13 kJ mol−1. The higher activation energy for association of (+)-tubocurarine and pancuronium compared with cisatracurium is notable. This may arise from either a more superficial binding site for the large antagonist cisatracurium compared to the other ligands, or from a change in receptor conformation upon binding of (+)-tubocurarine and pancuronium but not cisatracurium. Differences in ligand desolvation and ligand conformation are not likely to be important.
The muscle-type nAChR (nicotinic acetylcholine receptor) belongs to the superfamily of ‘Cys-loop’ ligand-gated ion channel receptors that includes neuronal nAChR, 5-HT3, GABAA, GABAC and glycine receptors (Sine & Engel, 2006). It is the best-characterized receptor in terms of biochemical, electrophysiological, pharmacological and structural properties. Two subtypes of nAChR are found in muscle cells: embryonic or extrajunctional (α2βγδ heteropentamer) and adult or junctional (α2βγδ heteropentamer).
Chemical labelling and site-directed mutagenesis studies have shown that the binding sites for agonists (usually represented by ACh, carbamylcholine or nicotine) and competitive antagonists (usually represented by metocurine or (+)-tubocurarine) are located at the extracellular α–γ (extrajunctional) or α–ε (junctional) and α–δ subunit interfaces. The sites are lined by three separate loops of amino acids on the α subunit and four distinct loops on the γ (ε) and δ subunits (Czajkowski & Karlin, 1995; Chiara & Cohen, 1997; Sine et al. 1998). X-ray crystallography of the water-soluble acetylcholine-binding protein (AChBP) from Lymnaea stagnalis at 2.8 resolution (Brejc et al. 2001) and electron microscopy of the Torpedo nAChR at 4 Å resolution (Unwin, 2005) provided a 3-dimensional view of the ligand-binding sites. The binding loops identified through mutagenesis are segments from β-sheets that converge at the binding site. Using lysine scanning mutagenesis (Sine et al. 2002) showed that the ε-subunit of muscle nAChR has nearly the same β-sheet structure as AChBP and created a homology model for the extracellular region of ε.
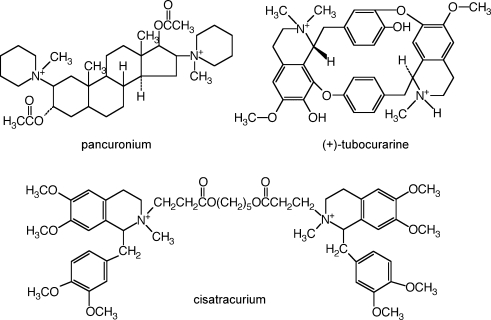
Because structural studies can provide only static images, kinetic studies are necessary for understanding the dynamic molecular process of ligand binding to nAChR. There is extensive research on the kinetics of agonist binding to the receptor and the conformational changes that occur when the channel opens (Bouzat et al. 2004; Auerbach, 2005; Gao et al. 2005; Xiu et al. 2005). Much less is known about the binding of antagonists. Measurements of the kinetics of competitive antagonism at 25°C of mouse muscle-type nAChR revealed several interesting features that could not have been inferred from equilibrium binding measurements. Competitive antagonists, molecules that are about 4- to 6-fold larger than ACh (Fig. 1), have association rates comparable to or greater than that of ACh (Demazumder & Dilger, 2001; Wenningmann & Dilger, 2001). This suggests that the rate-limiting step for antagonist binding differs from that of agonist binding. The association of cisatracurium, a relatively large competitive antagonist, is 2-fold faster for embryonic than for adult receptors, indicating that residues within the binding site affect the association as well as the equilibrium affinity of antagonists (Demazumder & Dilger, 2001). The association rates of competitive antagonists at 25°C, ranging from 0.73 to 16 × 108m−1 s−1 (Demazumder & Dilger, 2001; Wenningmann & Dilger, 2001; Dilger et al. 2007), are antagonist specific rather than simply diffusion limited, implying the presence of distinct energy barriers and wells along the pathway to the binding site. One interpretation of these data is that each competitive antagonist might have a distinct binding site within the agonist-binding domain, all of which sterically hinder the access of ACh. In addition, the binding of some competitive antagonists might induce a conformational change in the nAChR. Conformational changes upon the binding of the competitive antagonists α-conotoxin ImI (Hansen et al. 2005) and α-cobratoxin (Bourne et al. 2005) to AChBP have been inferred from crystallographic studies.
Figure 1.
The chemical structure of the nAChR competitive antagonists used in this study The molecular weights (excluding the counter ion used to form the salt) are 573 (pancuronium), 612 ((+)-tubocurarine) and 929 (cisatracurium). The molecular weight of ACh (not shown) is 147.
Little is known about ligand interaction with nAChR at physiological temperatures (Arias, 2001). There are no in vitro reports on the energetics of competitive antagonism for any ligand-gated ion channel. At elevated temperatures, outside-out patch clamp recordings are technically difficult (Zanello et al. 1996) and the kinetics of some antagonists approach the time resolution limits of rapid perfusion. Here, we improve upon our previous methods (Demazumder & Dilger, 2001) and investigate the kinetics of competitive antagonism at 37°C, resolving rates as high as 600 s−1. We use the differences between these results and those at 25°C to estimate the thermodynamics of antagonist association and dissociation. We used equilibrium and kinetic onset and recovery protocols to measure the binding affinity and association and dissociation rate constants, respectively, for (+)-tubocurarine, pancuronium, and cisatracurium. Free energy, apparent enthalpy and entropy of binding were obtained from van/t Hoff plots and apparent activation energies and apparent enthalpy changes were obtained from Arrhenius plots. We interpret these results in light of the recent structural and biochemical studies of nAChR and AChBP and discuss the dynamic molecular nature of antagonist–receptor interactions.
Methods
General methods
Clonal BC3H1 cells expressing mouse embryonic (α2βγδ) nAChR (Schubert et al. 1974) were cultured as previously described (Sine & Steinbach, 1984). Cells were used for experiments after 5–10 days of exposure to low serum when the receptor expression is maximal. At the time of electrophysiological experiment, the culture medium was replaced with extracellular solution (ECS) containing 150 mm NaCl, 5.6 mm KCl, 1.8 mm CaCl2, 1.0 mm MgCl2, 10 mm Hepes. Patch electrodes with resistances of 3–5 MΩ were filled with an intracellular solution containing: 140 mm KCl, 5 mm EGTA, 5 mm MgCl2 and 10 mm Hepes. A 3-tube perfusion system that uses solenoid-driven pinch valves was employed (Demazumder & Dilger, 2001). This system allowed rapid (0.1–0.2 ms) solution exchange across an outside-out patch (Liu & Dilger, 1991) and a minimum solution exposure time of 0.5 ms (Demazumder & Dilger, 2001).
Experiments were performed in the laboratory at 25°C or in an environmental room maintained at 37°C. The data at 37°C were obtained within 2 years of the previously published data at 25°C. Currents were measured at −50 mV. We found it difficult to make patch clamp recordings at elevated temperatures, as noted by others (Zanello et al. 1996). However, several modifications improved our success rate. We degassed solutions (before any ligand was added to the solution) to avoid the formation of air bubbles in the perfusion tubing. Electrodes with thicker walls (0.32 mm versus 0.14 mm thickness of unpulled borosilicate glass capillary tubes) increased the efficacy of patch excision and stability. Stability was considerably improved by using electrodes with narrower tip diameters and higher resistances (6–10 MΩ at 37°C versus 3–5 MΩ at 25°C), although this reduced the surface area of the excised patches and yielded smaller currents. Nevertheless, both of these adjustments probably helped to increase the area of the patch in contact with the electrode tip relative to the area in contact with perfusate, thereby stabilizing the patch. These methods produced stable patches lasting about 30 min, sufficient to apply the required perfusion protocols. Some of our early experiments at 37°C were performed with thin walled, low resistance electrodes and the results, aside from the total recording time before the patch broke, were not distinguishable from the other results (all are included in the analysis). The remainder of the experimental setup was identical for experiments at 25 and 37°C. Data analysis was performed as previously described (Demazumder & Dilger, 2001; Wenningmann & Dilger, 2001). All values are expressed as mean ± standard deviation (s.d.).
Equilibrium measurements
The control and antagonist equilibrium protocols are shown in Table 1. Each protocol was repeated at least 10 times at each drug concentration in each patch, and ensemble currents were calculated. Control protocols were performed before and after each antagonist protocol. Data were accepted only when recovery was 95%.
Table 1.
Solution application protocols used in the experiments
| Protocol | Step 1 | Step 2 | Step 3 |
|---|---|---|---|
| Control | ECS 5 s | ACh 250 ms | — |
| Antagonist | ECS + Antag 5 s | ACh + Antag 250 ms | — |
| Onset kinetics | ECS 5 s | ECS + Antag 0–5000 ms | ACh + Antag 250 ms |
| Recovery kinetics | ECS + Antag 5 s | ECS 0–5000 ms | ACh 250 ms |
The perfusion solutions contain extracellular solution (ECS) alone or with 300 μm ACh and/or various concentrations of antagonist (Antag).
The ratio of peak current in the rapid onset phase in the presence of the antagonist to that in ACh alone (Iantag/I0) reflects the number of channels that were not inhibited by antagonist during the 5 s exposure to ECS + antagonist, assuming that there was no dissociation of antagonist during the onset phase (Demazumder & Dilger, 2001). Inhibition was described by a one-site model (Scheme I) and a two-site model (Scheme II).
Scheme I.

Scheme II.
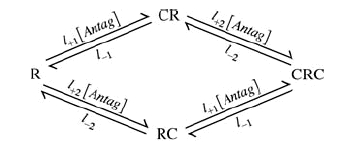
l+1 and l−1 are the association and dissociation rates for one site (L1=l+1/l−1) and l+2 and l−2 are the association and dissociation rates for the other site (L2=l+2/l−2). Note that only those receptors with no antagonist molecules bound, R, can be opened by ACh. In the schemes, C represents an antagonist, RC is the state with antagonist bound to the high affinity site, CR is the state with antagonist bound to the low affinity site and CRC is the state with antagonist bound to both sites. IAntag/I0 calculated as described above was plotted as a function of antagonist concentration. Non-linear least squares regression by GraphPad Prism 4.0c (GraphPad Software, Inc., San Diego, CA, USA) was used to fit the data to Scheme I:
| (1) |
and Scheme II using:
| (2) |
An F test was used to compare the two models. The two-site model was accepted if P < 0.05 (this would indicate that the 95% confidence limits of L1 and L2 did not overlap). Comparison between two data sets was performed by fitting either eqn (1) or eqn (2) to the relative current data for each patch, and testing the mean L1 values for statistical significance using an unpaired two-tailed t test.
Kinetic measurements
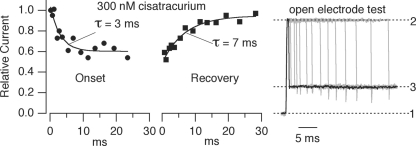
The onset and recovery kinetic protocols are also given in Table 1. The protocols used 15–20 different time intervals. Each protocol was repeated at least 2 times at each concentration of antagonist for each patch. A control protocol was performed before and after each onset and recovery protocol, and data were accepted only when the recovery was ≥ 95%. At the end of each experiment, the patch was blown off the electrode, and the different solution exposure time intervals were ascertained by applying the onset and recovery protocols to an open electrode using solutions with different NaCl concentrations (see Fig. 4 right panel). Relative current was plotted as a function of antagonist exposure or washout time for onset and recovery protocols, respectively, and the data were fitted to a single exponential decay function. Rapid application of ACh at the end of the exposure/washout time is used to probe R, the number of receptors not occupied by antagonist. In terms of Scheme I, the time constants for onset and recovery are given by:
| (3) |
The analogous equations for Scheme II cannot be solved analytically but can be calculated numerically using Q matrices (Colquhoun & Hawkes, 1995) (see Appendix).
Figure 4.
The kinetics of inhibition by 300 nm cisatracurium at 37°C Onset and recovery curves were generated from experiments on a single patch. The relative current (Iantag/I0) decreased as the patch was exposed to cisatracurium for longer times (onset time constant, 3 ms) and increased after cisatracurium was removed from the patch (recovery time constant, 7 ms). The open electrode test (right panel) shows how exposure times were verified at the end of each experiment. The patch was blown off the electrode and the open electrode was exposed to different NaCl concentrations (solution 1, normal ECS; solution 2, 50% ECS; solution 3, 85% ECS) using the same exposure time protocol. The current recorded at 0 mV reflects the time course of the solution change. The shortest exposure time to solution 2 was 1 ms (black trace).
Thermodynamic analysis
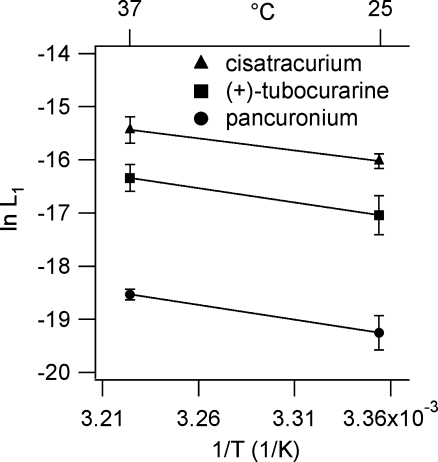
Gibbs free energy was calculated from equilibrium measurements via ΔG°=RTln(L1). Linear regression of a van/t Hoff plot of ln(L1) versus 1/T yielded a slope of ΔH°/R (ΔH°= change in apparent enthalpy) and ordinate-intercept of −ΔS°/R (ΔS°= change in entropy); the L1 values plotted were the mean values obtained from each patch. Because one cannot determine the absolute entropy drive for ligand-binding from the van/t Hoff plot (Dickinson et al. 1995), we comment only on the relative entropy drive. The apparent activation energy (Ea‡) of the transition state for association or dissociation of antagonist was determined by linear regression of an Arrhenius plot of the ln(1/τ) versus 1/T in which the slope is Ea‡/R. From this we calculated the apparent enthalpy, ΔH‡=Ea‡−RT and Q10= (rateT1/rateT2)10/(T2 − T1).
The Gibb/s free energy of the transition state is given by ΔG‡=−RTln(rate) +RTln(kT/h) =ΔH‡−TΔS‡ where k is the Boltzmann constant and h is Planck/s constant. For both van/t Hoff and Arrhenius plots, the mean value obtained from each patch was used for the linear regression analysis.
Results
Equilibrium measurements
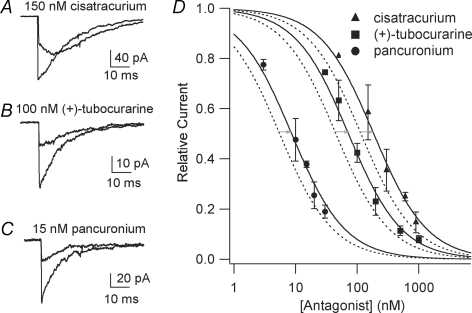
Representative traces from control and antagonist protocols for cisatracurium (+)-tubocurarine and pancuronium at 37°C are shown in Fig. 2A–C. In the controls, exposure to 300 μm ACh produced a rapid inward current (onset 0.1–0.2 ms) that decays due to desensitization in the continued presence of ACh. The decays are well described by a single exponential function with time constants of 12–17 ms. A qualitative estimate of the speed of antagonist dissociation can be deduced from the shape of the currents in the presence of antagonist (Demazumder & Dilger, 2001; Wenningmann & Dilger, 2001). For 15 nm pancuronium (Fig. 2C) and 100 nm (+)-tubocurarine (Fig. 2B), the peak current elicited by ACh is reduced, and the current decays somewhat slower than in the controls. This is characteristic of a competitive antagonist that dissociates slowly with respect to desensitization (Wenningmann & Dilger, 2001). For 150 nm cisatracurium (Fig. 2A), however, the initial rapid onset phase is followed by a biphasic current. The current increases as the antagonist dissociates on a 10–20 ms time scale, and ACh activates newly unoccupied receptors; then, the receptors desensitize causing current decay (Demazumder & Dilger, 2001). For all antagonists, the current after the initial, rapid onset phase reveals the fraction of channels not inhibited by antagonist.
Figure 2.
Inhibition of nAChR currents by competitive antagonists at 37°C Currents are activated by rapid perfusion of 300 μm ACh to outside-out patches from BC3H1 cells containing embryonic muscle nAChR. A–C, examples of currents obtained with control and antagonist protocols (Table 1). D, concentration–response curves at 25°C, dashed lines (Demazumder & Dilger, 2001; Wenningmann & Dilger, 2001), and 37°C, continuous lines and symbols. The grey arrows indicate the shift in the curves with increasing temperature at the L1 values. Numerical results are given in Table 2.
The relative current for all antagonists at 37°C is plotted as a function of antagonist concentration in Fig. 2D. The original data (before averaging for each concentration) were fitted to eqns (1) and (2). In all cases, the fits converged but the F test indicated that Scheme II did not provide a statistically better fit to the data than Scheme I ((+)-tubocurarine: P = 0.20, F = 1.73 for 28 data points; pancuronium: P = 0.098, F = 3.08 for 16 data points; cisatracurium: P = 0.52, F = 0.45 for 12 data points). The results are listed in Table 2. The concentration–response relationship at 25°C for (+)-tubocurarine, pancuronium (Wenningmann & Dilger, 2001) and cisatracurium (Demazumder & Dilger, 2001) are included for comparison (for these data also, Scheme II did not provide a statistically better fit to the data than Scheme I). For all three antagonists, the L1 values were 1.7- to 1.9-fold larger at 37°C than at 25°C.
Table 2.
Results and thermodynamic analysis of equilibrium measurements
| 25°C | 37°C | |||||||
|---|---|---|---|---|---|---|---|---|
| Antagonist | n | L1 (nm) | n | L1 (nm) | L1 ratio | ΔH° (kJ mol−1) | ΔS° (J mol−1 K−1) | ΔG°25°C (kJ mol−1) |
| (+)-Tubocurarine | 11 | 45 ± 2 | 31 | 72 ± 3 | 1.9 ± 0.1 | −45 ± 6 | −9 ± 21 | −42 ± 0.9 |
| Pancuronium | 6 | 5.5 ± 0.5 | 18 | 8.6 ± 0.6 | 1.7 ± 0.2 | −46 ± 6 | 6 ± 18 | −48 ± 0.8 |
| Cisatracurium | 23 | 115 ± 4 | 14 | 185 ± 16 | 1.7 ± 0.2 | −38 ± 4 | 8 ± 13 | −40 ± 0.3 |
L1 values were obtained by fitting the concentration–response curves (Fig. 2D) to eqn (1). Thermodynamic parameters were obtained by fitting the van/t Hoff plots (Fig. 3) to ln(L1) =ΔH°/RT+ΔS°/R, and free energy was calculated using ΔG°=RT ln(L1). n, number of experiments; L1, antagonist concentration that inhibits 50% of the receptors (eqn (1); Fig. 2D); L1 ratio is L1(37°C)/L1(25°C); ΔH°, apparent enthalpy change at standard state; ΔS°, entropy change at standard state; ΔG°25°C, free energy change at 25°C. Data for (+)-tubocurarine, pancuronium and cisatracurium at 25°C were previously published (Demazumder & Dilger, 2001; Wenningmann & Dilger, 2001). The L1 values for all antagonists were significantly different at 25°C from those at 37°C (P < 0.0001). The ΔS° values were not significantly different among the antagonists.
The L1 values were used for van/t Hoff plots (Fig. 3); the best-fit parameters are listed in Table 2. ΔG° values were significantly different among antagonists reflecting the differences in L1. ΔS° Was close to zero for all three antagonists. Thus, antagonist binding is primarily enthalpy driven, as we observed for agonists (Demazumder, 2002).
Figure 3.
A van/t Hoff analysis of equilibrium current inhibition by competitive antagonists L1 values were determined from experiments at 25°C (Demazumder & Dilger, 2001; Wenningmann & Dilger, 2001) and 37°C. Each point represents the mean and s.d. The number of patches studied at 25 and 37°C, respectively, were: cisatracurium (23, 14 patches), (+)-tubocurarine (11, 31 patches), pancuronium (6, 18 patches). The continuous lines are linear regression of ln(Kd) versus 1/T data. Numerical results are presented in Table 2.
Kinetic measurements
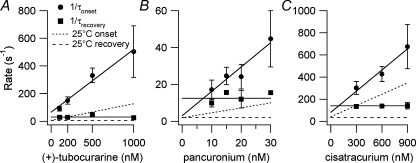
Results from onset and recovery protocols at 37°C using 300 nm cisatracurium are shown in Fig. 4. The time courses of both the onset and recovery of current inhibition were well described by single exponential functions as was seen in experiments at 25°C (Demazumder & Dilger, 2001). Because the equilibrium inhibition data were better fitted by a one-site model, the kinetic data were also interpreted in terms of this model. (See Discussion and Appendix for considerations of the consequences of a two-site model.) The rate constants for inhibition by competitive antagonists at 37°C were calculated from plots of τ−1versus antagonist concentrations from onset and recovery protocols using eqn (3) (Fig. 5). The results are given in Tables 3 (association) and 4 (dissociation). For the onset protocol, the slope represents the association rate (l+1). Although l−1 can be estimated from the ordinate-intercept in the onset protocol, the recovery protocol provides a more precise (smaller s.d.) determination of l−1 (average of all points). The binding affinities calculated from l−1/l+1 (cisatracurium, 220 ± 70 nm; (+)-tubocurarine, 69 ± 22 nm; pancuronium, 9.0 ± 3.6 nm) were not significantly different from those obtained from equilibrium measurements (Table 2).
Figure 5.
The concentration dependence of the kinetics of inhibition by competitive antagonists at 37°C The mean and s.d. for onset and recovery rates for (+)-tubocurarine (A), pancuronium (B) and cisatracurium (C) are plotted. The continuous lines were determined by linear regression (onset) or arithmetic mean (recovery). Dashed lines indicate the data at 25°C (Wenningmann & Dilger, 2001). Note how temperature has a stronger effect on the slope of the onset rate for (+)-tubocurarine and pancuronium than for cisatracurium. Numerical results are given in Tables 3 and 4.
Table 3.
Thermodynamics of antagonist association
| 25°C | 37°C | |||||||||
|---|---|---|---|---|---|---|---|---|---|---|
| Antagonist | n | l+1 (108m−1 s−1) | n | l+1 (108m−1 s−1) | Q10 | Ea‡ (kJ mol−1) | ΔH‡ (kJ mol−1) | ΔS‡ (kJ mol−1 K−1) | ΔG‡25°C (kJ mol−1) | ΔG‡37°C (kJ mol−1) |
| (+)-Tubocurarine | 11 | 1.2 ± 0.2 | 11 | 4.5 ± 0.8 | 3.0 ± 0.2 | 85 ± 6 | 83 ± 6 | 0.32 ± 0.3 | −13 ± 0.4 | −17 ± 0.5 |
| Pancuronium | 14 | 2.7 ± 0.9 | 9 | 14 ± 4 | 4.0 ± 0.8 | 107 ± 13 | 105 ± 13 | 0.40 ± 0.3 | −15 ± 0.8 | −20 ± 0.8 |
| Cisatracurium | 12 | 3.4 ± 0.3 | 8 | 6.4 ± 2 | 1.6 ± 0.1 | 38 ± 6 | 36 ± 6 | 0.17 ± 0.1 | −16 ± 0.2 | −18 ± 0.8 |
n, number of experiments, l+1, association rate constant; Q10, fold change in rate for 10°C increase in temperature; Ea‡, apparent activation energy of transition state; ΔH‡, apparent enthalpy change of transition state; ΔS‡, entropy change of transition state; ΔG‡, free energy change of transition state. Data for (+)-tubocurarine, pancuronium and cisatracurium at 25°C were previously published (Demazumder & Dilger, 2001; Wenningmann & Dilger, 2001). l+1 values were significantly different among the antagonists at both temperatures (P < 0.01). Q10, Ea‡, ΔH‡ and ΔG‡ were significantly different among the antagonists (P < 0.001).
Table 4.
Thermodynamics of antagonist dissociation
| 25°C | 37°C | |||||||||
|---|---|---|---|---|---|---|---|---|---|---|
| Antagonist | n | l−1 (s−1) | n | l−1 (s−1) | Q10 | Ea‡ (kJ mol−1) | ΔH‡ (kJ mol−1) | ΔS‡ (kJ mol−1 K−1) | ΔG‡25°C (kJ mol−1) | ΔG‡37°C (kJ mol−1) |
| (+)-Tubocurarine | 8 | 6 ± 1 | 7 | 31 ± 8 | 4.0 ± 0.4 | 106 ± 8 | 104 ± 8 | 0.25 ± 0.3 | 29 ± 0.6 | 26 ± 0.6 |
| Pancuronium | 12 | 2 ± 1 | 6 | 13 ± 4 | 4.5 ± 0.6 | 116 ± 10 | 113 ± 10 | 0.27 ± 0.4 | 31 ± 0.7 | 28 ± 0.8 |
| Cisatracurium | 15 | 34 ± 6 | 5 | 139 ± 16 | 3.2 ± 0.2 | 90 ± 6 | 88 ± 6 | 0.21 ± 0.3 | 24 ± 0.5 | 22 ± 0.3 |
n, number of experiments; l−1, dissociation rate constant; other symbols as in Table 3. Data for (+)-tubocurarine, pancuronium and cisatracurium at 25°C were previously published (Demazumder & Dilger, 2001; Wenningmann & Dilger, 2001). l−1 values were significantly different among the antagonists at both temperatures (P < 0.0001). Q10, Ea‡ and ΔH‡ were the same for (+)-tubocurarine and pancuronium, but these values were significantly different from those for cisatracurium (P < 0.01); ΔG‡ values at 25°C were significantly different from those at 37°C for all antagonists (P < 0.0001).
In contrast to the less than 2-fold change in the L1 of antagonists as the temperature is raised from 25 to 37°C, the association and dissociation rates increased 1.9- to 6-fold. Pancuronium underwent the largest change (5.2-fold) in association rate: (2.7–14) × 108m−1s−1. The association rate of (+)-tubocurarine was less sensitive to temperature (3.8-fold increase) than that of pancuronium. The association rate of cisatracurium, however, increased only 1.9-fold. At 25°C, the rank order of association rates was cisatracurium > pancuronium > (+)-tubocurarine, whereas at 37°C, it was pancuronium > cisatracurium > (+)-tubocurarine. Pancuronium also underwent the largest change in dissociation rate (6-fold) followed by (+)-tubocurarine (5.3-fold) and cisatracurium (4.1-fold). The rank order of antagonist dissociation rate, cisatracurium > pancuronium > (+)-tubocurarine was the same at both temperatures. The high dissociation rate of cisatracurium corresponds to a 7 ms residence time at the receptor.
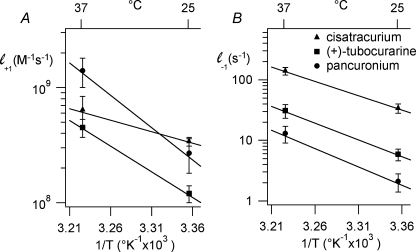
The values of l+1 and l−1 were used to generate Arrhenius plots (Fig. 6); the best-fit parameters are listed in Tables 3 and 4. Ea‡ and ΔH‡ for the association rate constant were significantly different among antagonists (P < 0.001; Student–Newman–Keuls multiple comparisons test). Ea‡ and ΔH‡ for the dissociation rate constant were the same for (+)-tubocurarine and pancuronium, but these values were significantly different from those for cisatracurium (P < 0.01). Ea‡, Q10 and ΔH‡ for the association rate of (+)-tubocurarine and pancuronium were greater than expected for a diffusion-limited process (Gutfreund, 1995) (Q10= 1.6; Ea‡= 35 kJ mol−1), whereas these values were close to diffusion limited for cisatracurium. Ea‡ and ΔH‡ for the dissociation rates of (+)-tubocurarine, pancuronium and cisatracurium were large and significantly different from each other. For each antagonist, ΔG‡ was significantly different at 25°C and 37°C (P < 0.001); the ΔG‡ values were significantly different among the antagonists at both temperatures (P < 0.05).
Figure 6.
Arrhenius analyses of the kinetics of competitive inhibition Arrhenius plots of association (A) and dissociation (B) rates for cisatracurium, (+)-tubocurarine and pancuronium. The continuous lines are the results of linear regression. Numerical results are given in Tables 3 and 4.
Discussion
Little is known about the temperature dependence of ligand interaction with nAChR (Arias, 2001). Human and animal studies suggest that competitive antagonism of the muscle-type nAChR is selectively and variably sensitive to temperature (Savarese et al. 2000). In cats, there is a 2-fold decrease in potency for pancuronium from 29°C to 38°C (Miller et al. 1978), in contrast to an increase in potency for (+)-tubocurarine for the same temperatures (Ham et al. 1978). There are no differences in the pharmacokinetics and pharmacodynamics of (+)-tubocurarine between 31.8°C and 35.8°C in humans (Savarese et al. 2000). In vivo studies are difficult to interpret. The relationship between antagonist binding and muscle relaxation depends on the release of ACh, the density of AChRs, the conductance properties of the muscle membrane, the threshold for action potential generation and excitation–contraction coupling. Temperature affects all of these processes. No in vitro studies measuring the energetics of competitive antagonism of ligand-gated ion channels have been reported. Patch clamp recordings are especially difficult as temperature limits of the gigaseal are approached at physiological temperature (Zanello et al. 1996). Here, we improve upon our rapid perfusion electrophysiological assay to investigate these issues.
Because activation of channels by 300 μm ACh is very fast (< 0.2 ms), the initial peak current reflects the number of uninhibited receptors provided that antagonist dissociation is < 5000 s−1. L1 values measured with this method give excellent agreement with L1 values measured from binding experiments (Fletcher & Steinbach, 1996; Demazumder, 2002). The fits of the equilibrium inhibition curves of Fig. 2 were not significantly improved by using a two-site model. BTX-binding studies on embryonic AChRs revealed that the ratios of low and high affinity binding constants at room temperature were 12-, 16- and 4.4 for pancuronium, (+)-tubocurarine and atracurium (not cisatracurium), respectively. For a 10-fold affinity ratio, differences in the degree of inhibition predicted by the models become apparent only for IAntag/I0 < 0.2. We do not have sufficient data to clearly discount a two-site model for pancuronium.
The sensitivity of inhibition by antagonists to site-specific mutations has been investigated in adult mouse (Dilger et al. 2007), but not embryonic mouse AChRs. Cisatracurium is sensitive to mutations in both the ε- and δ- subunits of adult mouse AChR. Cisatracurium distinguishes between these sites by about a factor of 8 (Demazumder & Dilger, 2001; an F test comparison for the two models gives P < 0.001). However, cisatracurium is much more discriminating between the γ- and δ-subunits of embryonic mouse AChR such that the two-site model is not statistically better than the one-site model (Demazumder & Dilger, 2001; an F test comparison for the two models gives P = 0.25). All of these results are for 25°C. Consider the possibility that at 37°C cisatracurium is not as discriminating for the embryonic AChR sites as at 25°C. The Q matrix calculations show that this would lead to an overestimate of the association rate for cisatracurium at 37°C. Thus, there would be a smaller difference between the association rates at the two temperatures than shown in Table 3 so that the Q10 would be < 1.6. We conclude that there is no evidence that cisatracurium is binding significantly to its low affinity site in embryonic mouse AChR.
The binding affinity of (+)-tubocurarine, pancuronium and cisatracurium decreased by 1.7- to 1.9-fold (Table 2) as temperature was increased from 25 to 37°C. These results differ from measurements made for (+)-tubocurarine on rat hemidiaphragm (Banerjee & Ganguly, 1996) where a 10-fold increase in binding affinity between 22 and 30°C was observed. However, the muscle contraction assay used in that study is an indirect indicator of antagonist binding. Our results indicate that the binding of competitive antagonists is enthalpy driven (−45 kJ mol−1 < ΔH° < −38 kJ mol−1), as has been reported for antagonists of the glycine (Ruiz-Gomez et al. 1989), GABAA (Maksay, 1994) and 5-HT3A (Borea et al. 1996) receptors. The magnitude of the apparent enthalpy change was similar for all three antagonists. The relative entropy drive for competitive antagonist binding was essentially zero.
Using onset and recovery protocols, we determined the association and dissociation rate constants for the antagonists at 37°C based on the assumption of a one-site binding model. The three-tube perfusion system could be used to determine rates as fast as 600 s−1. There was excellent agreement between the antagonist affinities determined from these kinetic experiments (l−1/l+1) and those obtained independently from equilibrium experiments. We compared these rates to those previously reported for the three antagonists at 25°C (Demazumder & Dilger, 2001; Wenningmann & Dilger, 2001). In contrast to the L1 values, the association and dissociation rates of these antagonists are differentially sensitive to temperature.
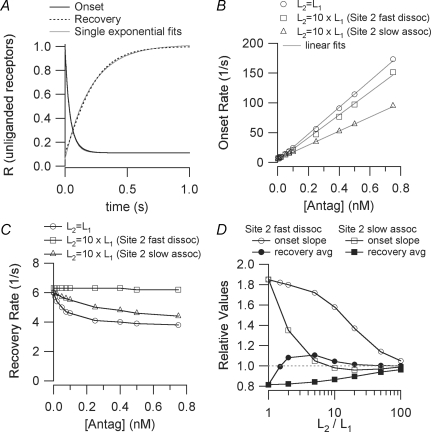
To estimate the effect of a two-site inhibition model on association and dissociation kinetics, we considered that the ratio of the two affinities varied from 1- to 100-fold and that the origin of the affinity difference was due to either a difference in association or dissociation rate (Appendix). If the two affinities were 10-fold different, as was reported for pancuronium on embryonic mouse AChRs at room temperature (Fletcher & Steinbach, 1996), the slope of the 1/τonsetversus[Antag] curve might overestimate the association rate of the high affinity site by as much as 1.6-fold (Fig. 8). The average value of 1/τrecovery might underestimate the dissociation rate of the high affinity site by as much as 1.1-fold only. We can use this information to estimate the degree to which the presence of two binding sites might affect the large temperature dependence of the association and dissociation constants as determined using a one-site model. An extreme case would be that the ratio of affinities is > 100 at 25°C but equal to 1 at 37°C. In this case, the ratio of l+1(37°C)/l+1(25°C) would be 1.8-fold less than calculated from the one-site model (Fig. 8). This ratio would be 2.9 in the case of pancuronium but this is still considerably greater than what would be expected from diffusion alone. For (+)-tubocurarine, however, the ratio would be 1.7 which is not inconsistent with diffusion. Under the same assumptions, the ratio of dissociation rates would be changed by only 20%. In this case, the temperature dependence would still exceed that of a diffusion-limited reaction for all of the antagonists studied.
Figure 8.
Results from Q matrix calculations of onset and recovery in the two-site model (Scheme II) For all calculations, l+1= 1.2 × 10⁸m−1 s−1, l−1= 6 s−1. A, the time course of onset and recovery (the number of unliganded receptors) when the two sites have the same affinity (L1=L2= 50 nm) and [Antag]= 100 nm. The curves are well approximated by single exponential functions for t > 10 ms. Onset: Q matrix R = 0.111 + 0.444 exp(−t/27.8) + 0.444 exp(−t/55.6) exponential fit R = 0.112 + 0.863 exp(−t/41.6) Recovery: Q matrix R = 1 + 0.444 exp(−t/83.3) −1.333 exp(−t/166.7) exponential fit R = 1.01 − 0.956 exp(−t/210.1) B, the concentration dependence of the onset rate when l+2=l+1 and l−2=l−1 (affinity ratio = 1), l+2=l+1 and l−2= 10 ×l−1 (affinity ratio = 10, site 2 fast dissociation) and, l+2=l+1/10 and l−2=l−1 (affinity ratio = 10, site 2 slow association). The data points are well fit by linear functions. C, the concentration dependence of the recovery rate for the same parameters as in B. D, results for various values of the affinity ratio. The slopes of the onset rate versus[Antag] curves are presented normalized to l+1 (the expected value for the one-site model). The average of the high and low concentration limits of the recovery rate versus[Antag] curves are presented normalized to l−1 (the expected value for the one-site model).
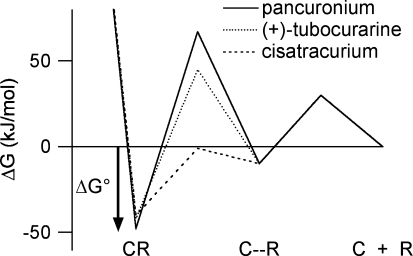
The Smoluchowski equation, kcoll= 4πDa, provides a maximum limit of 109–1010m−1s−1 for the collision rate of molecules in aqueous solutions (D is the relative diffusion constant and a is the sum of the radii of the two molecules). The finite size of a binding site on a protein means that most encounters with a ligand occur too far from the binding site to result in binding. Thus, the association rates of ligands and proteins will be considerably smaller than the Smoluchowski limit unless other factors decrease the size of the energy barrier to binding. It is convenient to consider binding as a two-step process (Camacho et al. 1999). In the first step, the ligand approaches within about 10 Å of the binding area to form an encounter complex (Fig. 7, C–R). The approach is facilitated by long-range electrostatic attraction and is accompanied by partial desolvation of the ligand and receptor. Because water molecules around solutes are ordered, desolvation makes a favourable entropic contribution to the free energy of binding. Desolvation of non-polar surfaces results in little or no change in enthalpy. Polar surfaces, however, may form hydrogen bonds with solvating water molecules and the breaking of these bonds requires more free energy than can be provided by the gain in entropy. Restricted movement of the ligand in the encounter complex produces an unfavourable entropic component in the free energy. In the second step, the ligand approaches the binding site guided by short range forces such as van der Waals interactions. Here, the barrier to association rises as the ligand probes the site with different orientations, not all of which are conducive to binding. If a conformational change in the protein and/or ligand is needed to achieve the final binding, this will also increase the energy barrier to binding.
Figure 7.
A free energy diagram describing the binding of competitive antagonists to the nAChR in an induced-fit model The energy well on the right corresponds to a weakly bound antagonist–receptor encounter complex (C–R). It is reached by overcoming a diffusional barrier that is assumed to be the same for all antagonists (30 kJ mol−1). Similarly, the activation energy for dissociation away from this state is assumed to be antagonist independent (40 kJ mol−1). The barrier between the encounter complex and the equilibrium bound state reflects a conformational change (induced fit) in the receptor protein and depends on the antagonist. The activation energies for this barrier are calculated as the difference between the measured activation energies (Tables 3 and 4) and the energies assumed for the diffusional barrier (Shoup & Szabo, 1982).
The relatively high association rates (108–109m−1 s−1) of nAChR competitive antagonists must arise, in part, from the short-range electrostatic attraction between the quaternary and tertiary ammonium cations on competitive antagonists and the π electrons of aromatic residues (Dougherty, 1996) in the binding site. This may be offset somewhat by the necessity of removing hydrogen-bonded water from the ammonium moieties. Our observation that ΔS‡≈ 0 (entropy of association), suggests that any entropy gain due to desolvating non-polar regions of antagonists is negated by a similar loss in entropy due to restricted ligand movement. Simulations of the docking of (+)-tubocurarine to AChBP (Gao et al. 2003) and nAChR (Wang et al. 2003), suggest that this ligand is completely inserted into the binding pocket and is, presumably, fully desolvated.
Why is the activation energy for association of cisatracurium so much lower than that of (+)-tubocurarine? Desolvation of the large non-polar surface area of cisatracurium may not be important because cisatracurium also shows no change in entropy during association. One possibility is that cisatracurium does not penetrate as deeply into the binding pocket as does (+)-tubocurarine. Thus, cisatracurium would have a simpler route from its encounter complex site to its docking site and would be less impaired by thermal fluctuations of the receptor. In this scenario, although the antagonists have different docking sites, they form bonds of nearly equal strength; the equilibrium binding free energy of cisatracurium is only 2.5 kJ mol−1 less negative than that of (+)-tubocurarine. This has been seen with metocurine and (+)-tubocurarine: they exhibit differences in sensitivities to mutations and assume different orientations within the binding site yet their affinities differ only 1.4-fold (Wang et al. 2003). Also, the affinities of antagonists that bind primarily to the α–ε interface of adult mouse nAChR do not differ greatly from those of antagonists that bind primarily to the α–δ interface (Dilger et al. 2007).
Alternatively, the nAChR might undergo a conformational change upon binding of (+)-tubocurarine and pancuronium, but not cisatracurium. There are other suggestions that the binding of competitive antagonists to the nAChR may induce conformational changes. High concentrations of some competitive antagonists (e.g. (+)-tubocurarine, atracurium and cisatracurium) but not others (e.g. pancuronium) act as weak partial agonists on embryonic mouse muscle nAChR (Steinbach & Chen, 1995; Fletcher & Steinbach, 1996; Demazumder & Dilger, 2001). This effect seems unrelated to our observations; although cisatracurium is a partial agonist, it did not exhibit a high activation energy for association, and pancuronium, which has no partial agonist activity, had a high activation energy for association. In AChBP, tryptophan fluorescence measurements indicate a conformational change upon binding of α-neurotoxins (Hansen et al. 2002). Comparison of the crystal structures of AChBP with different ligands bound suggests that some antagonists alter the position of the C-loop whereas others do not (Bourne et al. 2005; Hansen et al. 2005). However, complexes of (+)-tubocurarine, pancuronium or cisatracurium with AChBP have not been examined. Antagonist-induced conformational changes have been proposed in other ligand-gated channels. The binding of the competitive GABAA receptor antagonists bicuculline and gabazine (Ueno et al. 1997; Boileau et al. 2002) induce conformational changes. In the glutamate receptor, binding of competitive antagonists to the ligand-binding core is accompanied by an induced fit in which the clamshell structure contracts (Armstrong & Gouaux, 2000).
The temperature sensitivities of the dissociation rate constants of antagonists ranged from Q10 of 3.2–4.4. It is difficult to interpret Q10 values for ligand dissociation in terms of conformational changes because dissociation involves an energetic (bond-breaking) as well as a diffusional (escape probability) component (Shoup & Szabo, 1982).
Our conclusions about the thermodynamics of antagonist binding must be tempered by the fact that only two temperatures were considered. However, we would not expect data at intermediate temperatures to reveal non-linear van/t Hoff and/or Arrhenius plots because evidence suggests that the nAChR does not undergo phase transitions between 25 and 37°C (Dilger et al. 1991; Banerjee & Ganguly, 1996; Zanello et al. 1996). Even if the plots were non-linear, the data would still indicate that antagonist binding is primarily enthalpy driven and that the activation energies for association of some antagonists are larger than those for diffusion-limited processes.
Although electrophysiological measurements at elevated temperatures may be technically difficult, they are necessary for realistic modelling of physiological processes. Our results demonstrate that the combination of kinetic and thermodynamic measurements on the nAChR reveals dynamic and energetic information that cannot be deduced from equilibrium measurements. The temperature dependence of equilibrium inhibition alone obscures the dramatic changes in the underlying rate constants and the fundamental differences among the antagonists.
Acknowledgments
This work was supported by National Institutes of Health grant NS 045095 and by the Departments of Anaesthesiology and Physiology & Biophysics, Stony Brook University. We thank Drs Clive M. Baumgarten, K. S. Murthy, Mario J. Rebecchi and Hugo Arias for their critical reading of previous versions of this manuscript and helpful suggestions.
Appendix
We investigated the kinetics of inhibition for a two-binding-site model (Scheme II) using Q matrix methods (Colquhoun & Hawkes, 1995). The calculations assumed that the high affinity antagonist binding site was characterized by l+1= 1.2 × 10⁸m−1 s−1, l−1= 6 s−1 (L1= 50 nm) but the results can be generalized easily (Fig. 8D). The second site was characterized by having either a faster dissociation rate (l−2 > l−1) or a slower association rate (l+2 < l+1). Figure 8A shows the time course of the number of unliganded receptors (R) during an onset and a recovery protocol for the case where both binding sites have the same affinity (L2=L1, l−2=l−1, l+2=l+1) at an antagonist concentration of 100 nm. These time courses, as well as all of the other examples we examined, are well fitted by a single exponential function. Figure 8B displays the concentration dependence of the onset rates for three scenarios: L2=L1, L2= 10 ×L1 (l−2= 10 ×l−1) and L2= 10 ×L1 (l+2=l+1/10). In all three cases (as well as for the other cases we examined), the data points are well fitted by a linear function. The case where the L2 has a low affinity due to slow association results in a slope that is close to the l+1, the expected value for a one-site model. The other two scenarios result in steeper slopes. The analogous calculations for recovery time constants are shown in Fig. 8C. Unlike the one-site model, many scenarios in the two site-model show a concentration dependence to the recovery of unliganded receptors after removal of antagonist. At high antagonist concentrations, recovery is slowed, especially for cases where the low affinity site has a slow dissociation rate. In Fig. 8D, we summarize our Q matrix calculations for ∼300 scenarios. The slopes of the onset rate versus concentration curves (e.g. Fig. 8B) are normalized to l+1 and the average values of the recovery rates (low and high concentration limits) are normalized to l−1. Thus, this figure can be used to interpret any data, independent of the individual rate constants. It shows that the presence of a second antagonist binding site tends to increase the slope of the onset rate versus concentration curve by up to a factor of 1.8. As the affinity of the second site is decreased, the slope remains high when the dissociation rate of the second site is slow, but it quickly approaches the one-site model prediction when the association rate of the second site is fast. The magnitude of the effect of a second site on the recovery time course is much smaller, never exceeding 20%. In contrast to what is seen for onset, the approach to a single-site model occurs at lower L2/L1 ratios for cases where the dissociation rate of the second site is fast.
References
- Arias H. Thermodynamics of nicotinic acetylcholine receptor–ligand interactions. In: Raffa R, editor. Drug-Receptor Thermodynamics: Introduction and Applications. USA: John Wiley & Sons; 2001. pp. 293–357. [Google Scholar]
- Armstrong N, Gouaux E. Mechanisms for activation and antagonism of an AMPA-sensitive glutamate receptor: crystal structures of the GluR2 ligand binding core. Neuron. 2000;28:165–181. doi: 10.1016/s0896-6273(00)00094-5. [DOI] [PubMed] [Google Scholar]
- Auerbach A. Gating of acetylcholine receptor channels: Brownian motion across a broad transition state. Proc Natl Acad Sci U S A. 2005;102:1408–1412. doi: 10.1073/pnas.0406787102. [DOI] [PMC free article] [PubMed] [Google Scholar]
- Banerjee B, Ganguly D. Thermodynamics of the interaction of d-tubocurarine with nicotinic receptors of mammalian skeletal muscle in vitro. Eur J Pharmacol. 1996;310:13–17. doi: 10.1016/0014-2999(96)00360-3. [DOI] [PubMed] [Google Scholar]
- Boileau A, Newell J, Czajkowski C. GABAA receptor β2 Tyr97 and Leu99 line the GABA-binding site. Insights into mechanisms of agonist and antagonist actions. J Biol Chem. 2002;277:2931–2937. doi: 10.1074/jbc.M109334200. [DOI] [PubMed] [Google Scholar]
- Borea PA, Dalpiaz A, Gessi S, Gilli G. Thermodynamics of 5-HT3 receptor binding discriminates agonistic from antagonistic behaviour. Eur J Pharmacol. 1996;298:329–334. doi: 10.1016/0014-2999(95)00813-6. [DOI] [PubMed] [Google Scholar]
- Bourne Y, Talley TT, Hansen SB, Taylor P, Marchot P. Crystal structure of a Cbtx-AChBP complex reveals essential interactions between snake α-neurotoxins and nicotinic receptors. EMBO J. 2005;24:1512–1522. doi: 10.1038/sj.emboj.7600620. [DOI] [PMC free article] [PubMed] [Google Scholar]
- Bouzat C, Gumilar F, Spitzmaul G, Wang HL, Rayes D, Hansen SB, Taylor P, Sine SM. Coupling of agonist binding to channel gating in an ACh-binding protein linked to an ion channel. Nature. 2004;430:896–900. doi: 10.1038/nature02753. [DOI] [PubMed] [Google Scholar]
- Brejc K, van Dijk WJ, Klaassen RV, Schuurmans M, van Der Oost J, Smit AB, Sixma TK. Crystal structure of an ACh-binding protein reveals the ligand-binding domain of nicotinic receptors. Nature. 2001;411:269–276. doi: 10.1038/35077011. [DOI] [PubMed] [Google Scholar]
- Camacho CJ, Weng Z, Vajda S, DeLisi C. Free energy landscapes of encounter complexes in protein–protein association. Biophys J. 1999;76:1166–1178. doi: 10.1016/S0006-3495(99)77281-4. [DOI] [PMC free article] [PubMed] [Google Scholar]
- Chiara DC, Cohen JB. Identification of amino acids contributing to high and low affinity d-tubocurarine sites in the Torpedo nicotinic acetylcholine receptor. J Biol Chem. 1997;272:32940–32950. doi: 10.1074/jbc.272.52.32940. [DOI] [PubMed] [Google Scholar]
- Colquhoun D, Hawkes A. A Q-matrix cookbook: How to write only one program to calculate the single-channel and macroscopic predictions for any kinetic mechanism. In: Sakmann B, Neher E, editors. Single Channel Recording. 2. New York: Plenum Press; 1995. pp. 589–633. [Google Scholar]
- Czajkowski C, Karlin A. Structure of the nicotinic receptor acetylcholine-binding site. Identification of acidic residues in the δ subunit within 0.9 nm of the α subunit-binding site disulfide. J Biol Chem. 1995;270:3160–3164. doi: 10.1074/jbc.270.7.3160. [DOI] [PubMed] [Google Scholar]
- Demazumder D. New York: State University of New York at Stony Brook; 2002. The kinetics of competitive antagonism of nicotinic acetylcholine receptors. PhD Thesis. [Google Scholar]
- Demazumder D, Dilger JP. The kinetics of competitive antagonism by cisatracurium of embryonic and adult nicotinic acetylcholine receptors. Mol Pharmacol. 2001;60:797–807. [PubMed] [Google Scholar]
- Dickinson R, Lieb W, Franks N. The effects of temperature on the interactions between volatile general anaesthetics and a neuronal nicotinic acetylcholine receptor. Br J Pharmacol. 1995;116:2949–2956. doi: 10.1111/j.1476-5381.1995.tb15949.x. [DOI] [PMC free article] [PubMed] [Google Scholar]
- Dilger JP, Brett R, Poppers D, Liu Y. The temperature dependence of some kinetic and conductance properties of acetylcholine receptor channels. Biochim Biophys Acta. 1991;1063:253–258. doi: 10.1016/0005-2736(91)90379-m. [DOI] [PubMed] [Google Scholar]
- Dilger JP, Vidal AM, Liu M, Mettewie C, Suzuki T, Pham A, Demazumder D. Roles of amino acids and subunits in determining the inhibition of nicotinic acetylcholine receptors by competitive antagonists. Anesthesiology. 2007;106:1186–1195. doi: 10.1097/01.anes.0000267602.94516.7f. [DOI] [PMC free article] [PubMed] [Google Scholar]
- Dougherty DA. Cation–pi interactions in chemistry and biology: a new view of benzene, Phe, Tyr, and Trp. Science. 1996;271:163–168. doi: 10.1126/science.271.5246.163. [DOI] [PubMed] [Google Scholar]
- Fletcher GH, Steinbach JH. Ability of nondepolarizing neuromuscular blocking drugs to act as partial agonists at fetal and adult mouse muscle nicotinic receptors. Mol Pharmacol. 1996;49:938–947. [PubMed] [Google Scholar]
- Gao F, Bern N, Little A, Wang HL, Hansen SB, Talley TT, Taylor P, Sine SM. Curariform antagonists bind in different orientations to acetylcholine-binding protein. J Biol Chem. 2003;278:23020–23026. doi: 10.1074/jbc.M301151200. [DOI] [PMC free article] [PubMed] [Google Scholar]
- Gao F, Bren N, Burghardt TP, Hansen S, Henchman RH, Taylor P, McCammon JA, Sine SM. Agonist-mediated conformational changes in acetylcholine-binding protein revealed by simulation and intrinsic tryptophan fluorescence. J Biol Chem. 2005;280:8443–8451. doi: 10.1074/jbc.M412389200. [DOI] [PubMed] [Google Scholar]
- Gutfreund H. Kinetics for the Life Sciences: Receptors, Transmitters and Catalysts. Cambridge: Cambridge University Press; 1995. [Google Scholar]
- Ham J, Miller RD, Benet LZ, Matteo RS, Roderick LL. Pharmacokinetics and pharmacodynamics of d-tubocurarine during hypothermia in the cat. Anesthesiology. 1978;49:324–329. doi: 10.1097/00000542-197811000-00005. [DOI] [PubMed] [Google Scholar]
- Hansen SB, Radic Z, Talley TT, Molles BE, Deerinck T, Tsigelny I, Taylor P. Tryptophan fluorescence reveals conformational changes in the acetylcholine binding protein. J Biol Chem. 2002;277:41299–41302. doi: 10.1074/jbc.C200462200. [DOI] [PMC free article] [PubMed] [Google Scholar]
- Hansen SB, Sulzenbacher G, Huxford T, Marchot P, Taylor P, Bourne Y. Structures of Aplysia AChBP complexes with nicotinic agonists and antagonists reveal distinctive binding interfaces and conformations. EMBO J. 2005;24:3635–3646. doi: 10.1038/sj.emboj.7600828. [DOI] [PMC free article] [PubMed] [Google Scholar]
- Liu Y, Dilger JP. Opening rate of acetylcholine receptor channels. Biophys J. 1991;60:424–432. doi: 10.1016/S0006-3495(91)82068-9. [DOI] [PMC free article] [PubMed] [Google Scholar]
- Maksay G. Thermodynamics of γ-aminobutyric acid type A receptor binding differentiate agonists from antagonists. Mol Pharmacol. 1994;46:386–390. [PubMed] [Google Scholar]
- Miller RD, Agoston S, van der Pol F, Booij LH, Crul JF, Ham J. Hypothermia and the pharmacokinetics and pharmacodynamics of pancuronium in the cat. J Pharmacol Exp Ther. 1978;207:532–538. [PubMed] [Google Scholar]
- Ruiz-Gomez A, Garcia-Calvo M, Vazquez J, Marvizon JC, Valdivieso F, Mayor F., Jr Thermodynamics of agonist and antagonist interaction with the strychnine-sensitive glycine receptor. J Neurochem. 1989;52:1775–1780. doi: 10.1111/j.1471-4159.1989.tb07256.x. [DOI] [PubMed] [Google Scholar]
- Savarese J, Cladwell J, Lien C, Miller R. Pharmacology of muscle relaxants and their antagonists. In: Miller R, editor. Anesthesia. 5. Philadelphia: Churchill Livingstone; 2000. pp. 412–490. [Google Scholar]
- Schubert D, Harris A, Devine C, Heinemann S. Characterization of a unique muscle cell line. J Cell Biol. 1974;61:398–413. doi: 10.1083/jcb.61.2.398. [DOI] [PMC free article] [PubMed] [Google Scholar]
- Shoup D, Szabo A. Role of diffusion in ligand binding to macromolecules and cell-bound receptors. Biophys J. 1982;40:33–39. doi: 10.1016/S0006-3495(82)84455-X. [DOI] [PMC free article] [PubMed] [Google Scholar]
- Sine SM, Bren N, Quiram PA. Molecular dissection of subunit interfaces in the nicotinic acetylcholine receptor. J Physiol Paris. 1998;92:101–105. doi: 10.1016/S0928-4257(98)80145-9. [DOI] [PubMed] [Google Scholar]
- Sine SM, Engel AG. Recent advances in Cys-loop receptor structure and function. Nature. 2006;440:448–455. doi: 10.1038/nature04708. [DOI] [PubMed] [Google Scholar]
- Sine S, Steinbach J. Activation of a nicotinic acetylcholine receptor. Biophys J. 1984;45:175–185. doi: 10.1016/S0006-3495(84)84146-6. [DOI] [PMC free article] [PubMed] [Google Scholar]
- Sine S, Wang H-L, Bren N. Lysine scanning mutagenesis delineates structural model of the nicotinic receptor ligand binding domain. J Biol Chem. 2002;277:29210–29223. doi: 10.1074/jbc.M203396200. [DOI] [PubMed] [Google Scholar]
- Steinbach J, Chen Q. Antagonist and partial agonist actions of d-tubocurarine at mammalian muscle acetylcholine receptors. J Neurosci. 1995;15:230–240. doi: 10.1523/JNEUROSCI.15-01-00230.1995. [DOI] [PMC free article] [PubMed] [Google Scholar]
- Ueno S, Bracamontes J, Zorumski C, Weiss DS, Steinbach JH. Bicuculline and gabazine are allosteric inhibitors of channel opening of the GABAA receptor. J Neurosci. 1997;17:625–634. doi: 10.1523/JNEUROSCI.17-02-00625.1997. [DOI] [PMC free article] [PubMed] [Google Scholar]
- Unwin N. Refined structure of the nicotinic acetylcholine receptor at 4 Å resolution. J Mol Biol. 2005;346:967–989. doi: 10.1016/j.jmb.2004.12.031. [DOI] [PubMed] [Google Scholar]
- Wang HL, Gao F, Bren N, Sine SM. Curariform antagonists bind in different orientations to the nicotinic receptor ligand binding domain. J Biol Chem. 2003;278:32284–32291. doi: 10.1074/jbc.M304366200. [DOI] [PubMed] [Google Scholar]
- Wenningmann I, Dilger JP. The kinetics of inhibition of nicotinic acetylcholine receptors by (+)-tubocurarine and pancuronium. Mol Pharmacol. 2001;60:790–796. [PubMed] [Google Scholar]
- Xiu X, Hanek AP, Wang J, Lester HA, Dougherty DA. A unified view of the role of electrostatic interactions in modulating the gating of Cys loop receptors. J Biol Chem. 2005;280:41655–41666. doi: 10.1074/jbc.M508635200. [DOI] [PubMed] [Google Scholar]
- Zanello LP, Aztiria E, Antollini S, Barrantes FJ. Nicotinic acetylcholine receptor channels are influenced by the physical state of their membrane environment. Biophys J. 1996;70:2155–2164. doi: 10.1016/S0006-3495(96)79781-3. [DOI] [PMC free article] [PubMed] [Google Scholar]


