

Abstract
The speed and reliability of neuronal reactions are important factors for proper functioning of the nervous system. To understand how organisms use protein molecules to carry out very fast biological actions, we quantified single-molecule reaction time and its variability in synaptic transmission. From the synaptic delay of crayfish neuromuscular synapses the time for a few Ca2+ ions to bind with their sensors in evoked neurotransmitter release was estimated. In standard crayfish saline at room temperature, the average Ca2+ binding time was 0.12 ms for the first evoked quanta. At elevated extracellular Ca2+ concentrations this binding time reached a limit due to saturation of Ca2+ influx. Analysis of the synaptic delay variance at various Ca2+ concentrations revealed that the variability of the Ca2+-sensor binding time is the major source of the temporal variability of synaptic transmission, and that the Ca2+-independent molecular reactions after Ca2+ influx were less stochastic. The results provide insights into how organisms maximize reaction speed and reliability.
High-speed biological functions such as neurotransmitter exocytosis depend on fast dynamics of molecular interactions. To understand how these interactions affect the speed and reliability of synaptic transmission, we studied the reaction time of Ca2+-dependent and Ca2+-independent molecular reactions in the process of synaptic transmission, and to what extent the uncertainty of neurotransmitter release is due to Ca2+-sensor binding and due to other protein reactions
Proteins required for evoked neurotransmitter release include at least synaptotagmin and SNARE proteins (SNARE: SNAP receptors) (Schiavo et al. 1992; Blasi et al. 1993; Littleton et al. 1993). Synaptotagmin acts as the major Ca2+ sensor in Ca2+ triggering of synaptic vesicle fusion (reviewed by Chapman, 2002), and the SNARE complex brings closer the membranes to be fused (Sollner et al. 1993; Lin & Scheller, 1997). In addition, several other proteins such as Unc proteins and complexin were also found to be necessary for neurotransmitter release (Sollner, 2003). Although the chemical features of these proteins have been well studied, due to their complex arrangement at the neurotransmitter release site, the in vivo reaction probabilities of the proteins are poorly understood.
In the first step of synaptic transmission, whether a primed synaptic vesicle can be released depends on the interaction of only a few Ca2+ ions with their sensors. The probability of Ca2+-sensor reaction is particularly important for neuronal functions because the high Ca2+ concentration at the release site lasts for only a few milliseconds. This reaction probability may well set the speed limit of interneuronal communications and even the signal processing capacity of neural networks. Since it has not been possible to measure the early change in the free Ca2+ concentration at the release site ([Ca2+]RS) following an action potential, Ca2+-sensor binding rate was estimated by simulating synaptic responses induced with prolonged elevation in [Ca2+]RS (Bollmann et al. 2000; Schneggenburger & Neher, 2000; Millar et al. 2005). We realized that although it is impossible to measure the reaction time of a few molecules in most biological and chemical reaction systems, synaptic transmission is an event where the total reaction time of a few molecules in the process can be accurately determined owing to the magnification of the reaction by thousands of neurotransmitter molecules released from one synaptic vesicle. This feature of synaptic transmission allowed us to quantify the reaction time of a few molecules in physiological synaptic transmission.
Traditionally, synaptic transmission is studied from the magnitude of synaptic response. The measured total response amplitude is a nonlinear sum of quantal response amplitude, and the quantal amplitude is proportional to the product of the probabilities of all molecular reactions in synaptic transmission. Estimations of individual reaction probabilities from the total synaptic response amplitude often carry huge errors. Synaptic delay, on the contrary, is the linear sum of the Ca2+-dependent and Ca2+-independent reaction times; and linear summation allows more accurate estimation of individual reaction times and their variances. By analysing the variability of Ca2+-dependent and Ca2+-independent reaction times in synaptic transmission, we found that the uncertainty of synaptic transmission is mostly due to the Ca2+-dependent molecular reactions. This indicates that most of the Ca2+-independent reactions in synaptic transmission such as lipid bilayer fusion and other possible protein interactions including SNARE protein binding occur with a relatively high probability.
Methods
Neuromuscular preparation
Crayfish (Procambarus clarkii) of two inches were purchased from Atchafalaya Biological Supply Co. (Raceland, LA, USA), housed in fresh water at room temperature for up to 3 months and fed a diet of fish food pellets. For each experiment, one of the first pair of walking legs was quickly detached from a crayfish, partially by autotomy. Care was taken to ensure that animal discomfort was kept to a minimum. The neuromuscular preparations of leg muscle extensor were dissected from the meropodite segment in crayfish salines with different Ca2+ concentrations as required for electrophysiological recordings. See Hoyle & Wiersma (1958) for anatomy of the walking leg. The frozen animal tissue was destroyed by a qualified biological hazards control company.
The normal crayfish saline contained (mm): 205 NaCl, 5.4 KCl, 13.5 CaCl2, 2.7 MgCl2, 10 Hepes (N-[2-hydroxyethyl]piperazine-N′-[2-ethanesulphonic acid]) and 10 glucose, pH 7.39–7.41. When salines with different Ca2+ concentrations were used, equinormal NaCl was added or reduced to maintain the salines/ osmolarity, and Mg2+ concentration was kept constant. For salines containing Sr2+, glucose concentration was adjusted to achieve equal osmolarity for the salines.
Electrophysiology
To induce synaptic activities, the crayfish leg nerve was stimulated through a platinum wire placed close to the proximal end of the nerve. Single square pulses of 0.3 or 0.5 ms were applied at 0.1 Hz. Both the axon action potentials and muscle fibre excitatory postsynaptic potentials (EPSPs) were recorded with intracellular sharp microelectrodes filled with 3 m KCl (resistance: ∼3 MΩ) as described before (Hua & Charlton, 1999).
Single nerve terminal spikes and postsynaptic responses were recorded extracellularly with a method described by Millar et al. (2002). To locate the phasic nerve terminals, the preparation was incubated with 2 μm 4-(4-(diethylamino)styryl)-N-methylpyridinium iodide (4-Di-2-Asp; Molecular Probes, Eugene, OR, USA) in a saline for 4 min in order to visualize nerve terminals under a fluorescence microscope (modified from Olympus BX40). Micropipette electrodes (filled with a saline, resistance: ∼1.0 MΩ) were placed under a 40× water immersion objective (W.D. 3.3 mm) on single phasic terminals at an angle of about 30 deg for extracellular focal recording. The tip of the micropipettes had been ground at 30 deg using a micropipette beveller (BV-10, Sutter Instrument Co., Novato, CA, USA) to obtain an opening of 5–15 μm across, and the opening was heat polished to reduce possible damage to the preparation.
Standard preamplifiers (model 1600 of A-M Systems, Carlsborg, WA, USA) were used for both intracellular and extracellular recordings. To increase the time resolution, the low-pass filter of the amplifiers was set at 50 kHz. Tomahocq computer software (Thomas A. Goldhorpe, University of Toronto, Canada), combined with an analog/digital interface (LM-12, Dagan, Minneapolis, MN, USA), was used for data acquisition. The interface allowed a sampling rate of 100 kHz.
All the experiments were conducted at room temperature (23–25°C). To avoid incomplete change of Ca2+ concentration at the nerve terminals due to pipette seal, each preparation was kept only at one Ca2+ concentration for extracellular recordings.
Data analysis
The minimum synaptic delay was measured as the time period from the negative peak of the presynaptic spikes to the start time of the excitatory postsynaptic currents (EPSCs). Since individual nerve spikes were often too small to be measured accurately, 10 traces were averaged for the measurement of spike peaks. This average was allowed because the variation of the nerve terminal spike timing was very small compared to the synaptic delay variation. The start time of individual EPSCs and EPSP maximum derivative were determined using routines written in MATLAB (The Mathworks, Natick, MA, USA). The recordings after the stimulus were first smoothed with a median filter (temporal resolution: 0.1 ms). For recordings of EPSCs, a section of the data that was continuously below two standard deviations (∼0.1 mV) of the baseline fluctuation was extracted. The time corresponding to the beginning of the extracted data section was defined as the EPSC starting time.
Curve fitting was conducted using the nonlinear regression function of SigmaStat 3.0 (Systat Software Inc., San Jose, CA, USA). For curve fitting using the maximum derivative of EPSPs, 30 EPSPs were recorded from each muscle fibre, and the mean of the maximum derivative of all the EPSPs at the same condition was used for curve fitting.
Results
Estimating Ca2+ concentration at the release site
To estimate the reaction time of Ca2+ with its sensor in synaptic transmission, we need to know the concentration of free Ca2+ ions at the release site, [Ca2+]RS. Since it is impossible to directly measure the submembrane Ca2+ concentration for a few milliseconds immediately after an action potential, we estimated [Ca2+]RS as a function of the extracellular Ca2+ concentration ([Ca2+]o):
| (1) |
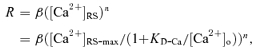
where [Ca2+]RS-max is the maximum [Ca2+]RS which is reached when [Ca2+]o is infinite and calcium influx is fully saturated, and KD-Ca is the [Ca2+]o at which [Ca2+]RS is half-maximal. This equation is based on the equilibrium binding reaction between Ca2+ ions and Ca2+ channels. The KD-Ca for Ca2+ influx has been estimated for several types of neurons (Akaike et al. 1978; Carbone & Lux, 1987). Assuming that neurotransmitter release is triggered by the binding of n Ca2+ ions with their sensors, synaptic responses at low Ca2+ influx are proportional to ([Ca2+]RS)n. The synaptic response, R, at a given [Ca2+]o can be expressed as:
 |
(2) |
where β is a constant; β([Ca2+]RS-max)n is the maximum synaptic response (Rmax) which is achieved when [Ca2+]o is infinite. A similar version of eqn (2) was introduced by Dudel (1981). This equation provides a means to estimate the value of KD-Ca from the synaptic responses at various [Ca2+]o. Later we used KD-Ca to estimate Ca2+-sensor binding time (see the next section of Results).
We first tested the synaptic responses of the extensor muscle fibres at various [Ca2+]o. Each muscle fibre of the extensor is innervated by two excitatory axons: the phasic and tonic axons (both shown in Fig. 1A). At low-frequency stimulation, the neurotransmitter release probability of the phasic terminals is much higher than that of the tonic terminals (Msghina et al. 1998); therefore the EPSPs induced at 0.1 Hz were caused by glutamate released from the phasic terminals (see Hua et al. 2007 for further verifications). To minimize the error in KD-Ca estimation due to nonlinear summation of the postsynaptic responses and the saturation of Ca2+ sensor and neurotransmitter receptors, the maximum derivative of the EPSPs was measured instead of EPSP amplitude to quantify the synaptic responses. At [Ca2+]o ranging from 1.7 mm to 20.3 mm, the EPSP maximum derivative increased with increasing [Ca2+]o (Fig. 1D). Intracellular recordings showed no significant effect of changes in [Ca2+]o on action potentials of the phasic axon. Examples of the phasic axon action potentials and muscle fibre EPSPs at 1.7 mm and 20.3 mm[Ca2+]o were shown in Fig. 1B and C, respectively (5 experiments for [Ca2+]o of 1.7, 6.8 (not shown) and 20.3 mm each). After recording synaptic responses at eight [Ca2+]o values, the value of KD-Ca was estimated by fitting eqn (2) to the mean EPSP maximum derivative at each [Ca2+]o. Figure 1D shows the mean synaptic responses and the best-fit curve with a KD-Ca of 5.8 mm (s.e.m. of estimation: 2.4 mm, with 2.7 mm Mg2+). This value is within the range of Ca2+ dissociation constants for neuronal Ca2+ channels (2–10 mm at various [Mg2+]: Carbone & Lux, 1987; Akaike et al. 1989; Aibara et al. 1992; Church & Stanley, 1996; Schneggenburger et al. 1999; Foster et al. 2002).
Figure 1. Intracellular recordings of the activities of crayfish motor axons and muscle fibres.

A, fluorescence image of the phasic and tonic nerve terminals on an extensor muscle fibre (the image is shown in colour in the online version of this paper). B, action potentials of the phasic axon and EPSPs at 1.7 and 13.5 mm[Ca2+]o. C, action potentials of the phasic axon and EPSPs at 20.3 mm and 13.5 mm[Ca2+]o. Recordings in B and C were from different preparations. Recordings at 13.5 mm[Ca2+]o were taken from the same axon and muscle fibre after the recordings at 1.7 mm or 20.3 mm[Ca2+]o. D, the synaptic responses at various [Ca2+]o. The mean maximum derivative of EPSPs (max derivative) was normalized to that in normal crayfish saline. For calibration the recordings in normal saline were also taken after each preparation was thoroughly washed in normal crayfish saline. Data were from five preparations for each [Ca2+]o. Error bars show the s.d. The line is the best fit of eqn (2) to the mean maximum derivative.
Equation (2) requires that the Ca2+ sensors and postsynaptic neurotransmitter receptors are not saturated at the maximum derivative of EPSPs. These saturations have been observed at some mammalian neuronal synapses (Foster et al. 2002). The synaptic response curve in Fig. 1D shows that the synaptic responses saturated at a higher level of [Ca2+]o. This saturation has three possible components: the saturations of Ca2+ influx, Ca2+ sensor and postsynaptic neurotransmitter receptors. In addition, saturation of intracellular Ca2+ buffer may add an opposite effect on the synaptic response. If the Ca2+ sensors or postsynaptic neurotransmitter receptors were saturated when the synapses generated their maximum derivative of EPSPs, the estimated KD-Ca value would not reflect the half-maximal [Ca2+]RS correctly. We explored the significance of the saturation of Ca2+ sensors and neurotransmitter receptors by reducing Ca2+ influx. Several divalent cations are known to compete with Ca2+ for interaction with Ca2+ channels (reviewed by Hagiwara & Byerly, 1981). Among these ions, Sr2+ causes little synaptic response in our preparation. Therefore we used Sr2+ to reduce Ca2+ influx induced by single action potentials. The [Ca2+]RS in the presence of Ca2+ and Sr2+ can be calculated as:
 |
(3) |
where KD-Sr is the dissociation constant of Sr2+ for Ca2+ channels. From eqns (2) and (3), the synaptic response in the presence of Sr2+, denoted as RSr, is expressed as:
| (4) |
where Rmax is the maximum synaptic response. If the saturation of the synaptic response shown in Fig. 1D was solely due to the saturation of Ca2+ influx, reducing Ca2+ influx by adding Sr2+ should not change the value of estimatedKD-Ca. But if the saturation of the synaptic response was largely due to the saturation of Ca2+ sensors or postsynaptic receptors, reducing Ca2+ influx by adding Sr2+ would reduce the saturation of the sensors or receptors, thus leading to a larger KD-Ca as estimated with eqn (4). We then tested KD-Ca in the presence of Sr2+.
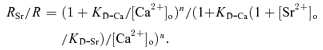
Replacing Ca2+ with 10 mm Sr2+ blocked synaptic responses (example shown in Fig. 2A). In four experiments, the EPSP amplitude with 10 mm Sr2+ and without Ca2+ was 0.39 ± 0.07 mV, which is very close to the amplitude in Ca2+-free saline without Sr2+ (0.38 ± 0.11 mV, mean ±s.d.). This observation confirmed that Sr2+ barely causes any synaptic response following low-frequency nerve stimulation. We next examined the effect of Sr2+ on Ca2+-dependent synaptic transmission by measuring synaptic responses with and without [Sr2+]o. This test was repeated at different [Ca2+]o, for each of which the ratio of [Sr2+]o/[Ca2+]o was fixed at 3/13.5. The synaptic responses measured as EPSP maximum derivative were inhibited most (by 26%) at 20.3 mm[Ca2+]o. The inhibition of synaptic responses by Sr2+ is shown in Fig. 2B and plotted in Fig. 2C. From eqns (2) and (4), this inhibition can be predicted as:
 |
(5) |
Equations (4) and (5) share parameters of KD-Ca, KD-Sr and n. By multiple-function curve fitting of the two equations to the mean synaptic responses plotted in Fig. 2C and D (with KD-Ca, KD-Sr and n shared for the two equations), KD-Ca was estimated to be 6.0 mm (s.e.m. of estimation: 3.2 mm). This value is very close to the KD-Ca estimated without Sr2+ (5.8 mm), indicating little saturation of Ca2+ sensor and/or postsynaptic receptors at the maximum derivative of EPSPs; therefore the KD-Ca reflects the feature of Ca2+ influx.
Figure 2. Synaptic responses in the presence of Sr2+.

A, synaptic responses in saline of 10 mm Ca2+ and saline of 10 mm Sr2+. The recordings were from the same muscle fibre. B, Sr2+ inhibits synaptic transmission. The recordings were from the same muscle fibre. In A and B, the axon was stimulated at 0.1 Hz and each trace is an average of 5 recordings. C, inhibition of synaptic response by Sr2+ at various [Ca2+]o. The ratio of the EPSP maximum derivative in the presence of Sr2+ (RSr) to that in salines without Sr2+ (R) was plotted to [Ca2+]o. The line is the best fit of eqn (5). D, synaptic responses at various [Ca2+]o and [Sr2+]o. The EPSP maximum derivatives were normalized to that in saline of 13.5 mm Ca2+ (without Sr2+). The line is the best fit of eqn (4). In C and D, concentrations of [Sr2+]o are 3/13.5 times [Ca2+]o for each saline; data are means of 5–7 experiments for each [Ca2+]o and errors are s.d.
Determining mean time for Ca2+-sensor binding
With the estimated KD-Ca value, we next estimated the Ca2+-dependent molecular reaction time in synaptic transmission from the minimum synaptic delays at various [Ca2+]o. Synaptic activities were recorded extracellularly by placing pipette electrodes on single phasic nerve terminals. Following each stimulus, a presynaptic current and an excitatory postsynaptic current (EPSC) were detected as voltage signals (shown in Figs 3A and 4A). When the axon was stimulated at 0.1 Hz, the minimum synaptic delay, which was the delay of the first quantum, was stable for the period of experiments as long as [Ca2+]o was not changed. In normal crayfish saline, the minimum synaptic delay of 15 single terminals from 10 preparations was 0.61 ± 0.13 ms (mean ±s.d.), which was comparable to the synaptic delays for other types of synapses (Katz & Miledi, 1965; Llinás et al. 1981; Sabatini & Regehr, 1996; Waldeck et al. 2000).
Figure 3. The synaptic delay is Ca2+ dependent.

A, the nerve terminal spikes and postsynaptic responses at [Ca2+]o of 13.5 mm and 3.4 mm as labelled. The arrows point to the negative peak of the nerve terminal spikes and the onset of the postsynaptic responses. The large noise of the recordings was due to 50 kHz low-pass filter used for recording. B, mean synaptic delays at various [Ca2+]o. Data were collected from 10–15 single nerve terminals for each [Ca2+]o. Errors are s.e.m. The curve is the best fit of eqn (9) to the mean synaptic delays.
Figure 4. The temporal distribution of the first quantum delay.

A, EPSCs induced with 7 stimuli at 0.1 Hz from the same location on a muscle fibre. The stimuli were applied at 0.1 ms and recordings were taken at 1.0 ms. B, distribution of the first quantum starting time. All the 44 EPSCs induced with 50 stimuli (at 0.1 Hz) were included. Examples of EPSCs were shown in A. C, the compound EPSC of 44 EPSCs in B. The arrow points to the nerve terminal spike. The time scale is the same for B and C for comparison.
Synaptic responses were then induced in eight salines differing in [Ca2+]o, and synaptic delays were measured. The presynaptic signal and EPSCs at two Ca2+ concentrations are shown in Fig. 3A. The minimum synaptic delay at eight [Ca2+]o values (plotted in Fig. 3B) revealed that the synaptic delay was [Ca2+]o dependent, with longer delay at lower Ca2+ concentrations, and that the delay approached a steady level at high [Ca2+]o. These features allowed us to analyse Ca2+-dependent and Ca2+-independent components of the minimum synaptic delay.
The synaptic delay is the total time for the following events in series: Ca2+ channel opening, Ca2+ influx and Ca2+-sensor binding, the possible SNARE protein interaction and other molecular reactions not well-defined yet, lipid membrane fusion, neurotransmitter release and diffusion, and postsynaptic response generation. The synaptic delay and its variance were mainly attributed to presynaptic events, since neurotransmitter diffusion across the synaptic cleft and postsynaptic events take little time (Katz & Miledi, 1965). Among the presynaptic events, the rates of Ca2+ influx and Ca2+-sensor binding are [Ca2+]o dependent. Since [Ca2+]o is much higher than [Ca2+]RS, the Ca2+-channel interaction takes much less time than Ca2+-sensor interaction; therefore the Ca2+-dependent portion of the synaptic delay is approximately the Ca2+ sensor binding time. For a first-order reaction with respect to Ca2+ binding site, the probability of the time length from Ca2+ influx to Ca2+-sensor binding is exponentially distributed with the mean time length, t, and this time length is the inverse of the product of the binding rate constant and Ca2+ concentration (Colquhoun, 1971b). Thus the mean time required for the binding of Ca2+ to Ca2+ sensor is expressed by the equation:
| (6) |
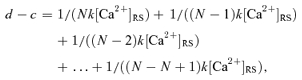
where k is the binding rate constant. If the quantal release requires multiple Ca2+-sensor binding reactions that do not overlap in time and if no unbinding occurs before the subsequent event in vesicle fusion, the total Ca2+-sensor binding time can be calculated as:
 |
(7) |
where d denotes the minimum synaptic delay, c is the time for all the Ca2+-independent reactions in synaptic transmission, and N is the number of the binding sites required for one vesicle fusion. The unbinding rate of the Ca2+ sensor was not included in eqn (7) because the unbinding rate for the putative Ca2+ sensor in neurotransmitter release was estimated to be low (Bollmann et al. 2000) relative to our estimated Ca2+-sensor binding time, and only the vesicles that experienced no Ca2+ unbinding have a high probability to be released first after each nerve terminal spike. The minimum synaptic delay we measured was the delay of these vesicles.
Combining eqns (1) and (7) we have the equation for synaptic delay:
| (8) |
where γ≡ 1/N+ 1/(N− 1) + 1/(N− 2) +…+ 1/(N−N+ 1).
Let e1=c+γ/(k[Ca2+]RS-max), and e2=γKD-Ca/(k[Ca2+]RS-max), eqn (8) can be simplified into:
| (9) |
Equation (9) was then fitted to the mean minimum synaptic delay at each [Ca2+]o (Fig. 3B); the best fits of e1 and e2 are 0.58 ms (s.e.m. 0.01 ms) and 0.47 ms mm (s.e.m. 0.03 ms mm), respectively. From e1, e2 and KD-Ca= 5.8 mm, the Ca2+-independent portion of the minimum synaptic delay, c, was calculated to be 0.50 ms (c =e1−e2/KD-Ca). The estimate of c carries errors of e1, e2 and KD-Ca. From these errors, we estimated the s.e.m. of c to be less than 0.03 ms.
From eqn (9), e1 is the minimum synaptic delay when Ca2+ current is saturated at infinite [Ca2+]o, and is the lower limit of the synaptic delay at a particular temperature. The value of e2 is a constant for [Ca2+]o-dependent change in synaptic delay. With these two parameters, the minimum synaptic delay can be calculated if one knows [Ca2+]o (d = 0.58 ms + 0.47 ms mM/[Ca2+]o). From eqns (8) and (9), the ratio of e2 over KD-Ca (=γ/(k[Ca2+]RS-max)) denotes another constant (0.08 ms, s.e.m.: 0.03 ms), which is the Ca2+-sensor binding time at [Ca2+]RS-max (see eqn (6) for the binding time). Thus the synaptic delay can also be calculated as 0.50 ms + 0.08 ms × (1 +KD-Ca/[Ca2+]o).
Once we know the Ca2+-independet reaction time, how long it takes for a single Ca2+ ion to bind to a binding site can be calculated if we know how many Ca2+ ions are required for one quantum and whether they bind with the sensors simultaneously or in series. Since Dodge & Rahamimoff (1967) proposed that ∼4 Ca2+ ions were required for each quantum, experimental findings suggested that 1–5 Ca2+ ions are required to release 1 vesicle of neurotransmitter (Llinás et al. 1976; Charlton et al. 1982; Zucker & Stockbridge, 1983; Bollmann et al. 2000; Schneggenburger & Neher, 2000). In normal crayfish saline, if only 1 Ca2+ is required for a quantum, the binding time calculated from eqn (8) is 0.12 ms. If, on the other hand, 5 Ca2+ ions are required to bind with their identical sensors in sequence, the individual Ca2+-sensor binding time is 0.05 ms. If each binding increases the subsequent binding affinity, or the binding times overlap, each binding should take 0.05–0.12 ms.
Using minimum synaptic delay measurements, we also examined the delay distribution of the first quantal event after nerve spikes. At all the Ca2+ concentrations tested, single action potentials often caused multiple quanta from single phasic nerve terminals, but most of the quanta were relatively synchronized (see Fig. 4A). The delay distribution of EPSCs induced with 50 stimuli at 0.1 Hz (6 failures; [Ca2+]o: 16.9 mm; examples shown in Fig. 4A) is shown in Fig. 4B, and these EPSCs were summed to construct a compound EPSC (Fig. 4C) illustrating an EPSC of a muscle fibre with 50 phasic terminals. The distribution of the minimum synaptic delay showed that the single terminal EPSCs started during the period from the onset to the negative peak of the compound EPSC. This distribution was common at various [Ca2+]o. This means that the first quanta we analysed occurred up to the negative peak of the compound EPSC. These first quanta should result from the exocytosis of the vesicles that are relatively homogeneous in their priming status and their access to Ca2+ source. In our estimation of the Ca2+-independent component of synaptic delay, we assumed that [Ca2+]RS is constant during Ca2+ channel opening and is very low before channel opening and after channel closing. This assumption is based on findings of simulation studies that in the vicinity of Ca2+ channels, [Ca2+]RS reaches a steady level in a few microseconds after channel opening and reduces quickly when the channel closes (Simon & Llinás, 1985; Shahrezaei & Delaney, 2004). Consistent with this notion, the frequency of the first quanta increased promptly after a short period following the nerve spike and most of the first quanta occurred during a period of 400 μs in Fig. 4.
Determining synaptic delay variance
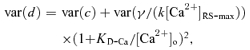
The synaptic delay of the phasic synapses had a considerable variance. This can be seen from Fig. 5A, which shows EPSCs induced with five consecutive stimuli of 0.1 Hz in normal crayfish saline. The variance was even larger at lower [Ca2+]o. Studies on frog neuromuscular synapses suggested that the variance of synaptic delay reflects a presynaptic probabilistic process (Barrett & Stevens, 1972). We wanted to know to what extent the variance was associated with Ca2+-sensor binding. Since the minimum synaptic delay was caused by two types of non-overlapping processes: the Ca2+-dependent and Ca2+-independent reactions, the variance of the minimum synaptic delay should be the sum of the variances of the two processes. From eqn (8) the variance of the minimum synaptic delay (see Colquhoun, 1971a) is:
 |
(10) |
in which var(c) and var(γ/(k[Ca2+]RS-max)) × (1 +KD-Ca/[Ca2+]o)2 are the variances of [Ca2+]o-independent and [Ca2+]o-dependent portions of the synaptic delay, respectively. In eqn (10), KD-Ca is a constant and [Ca2+]o does not change for a particular saline. Because Ca2+-sensor binding carries considerable uncertainty, k is the major source of the variance. Whether γ changes from trial to trial is not known. Therefore γ is treated as a possible source of variance. The variance of the minimum synaptic delay (var(d)) was calculated for each [Ca2+]o and plotted in Fig. 5B. By fitting eqn (10) to the means of the variances, the variance of the Ca2+-independent portion of the synaptic delay was estimated to be 0.011 ms2 (s.e.m. of estimation: 0.002 ms2). Figure 5B shows the curve fitting to the experimental data.
Figure 5. The variance of the synaptic delay.

A, five recordings from a phasic nerve terminal and the postsynaptic fibre in normal saline were superimposed and aligned at the stimulation artifact. The synaptic delay has a large variance (with one failure). The nerve spikes prior to the synaptic responses showed little variance. B, the variance of the synaptic delay is Ca2+ dependent. The variance of the minimum synaptic delay from 10–14 muscle fibres at each Ca2+ concentration is plotted. The curve is the best fit of eqn (10) to the variance.
The variance of the Ca2+-sensor binding time now can be calculated form eqn (10). In normal crayfish saline, the calculated total variance of minimum synaptic delay was 0.021 ms2, meaning that 0.010 ms2, or 48% of the delay variance, was from Ca2+-sensor binding. At 1.7 mm[Ca2+]o, the variance of the Ca2+ sensor binding time was 89% of the total delay variance. The large variance of Ca2+-sensor binding time is consistent with the probabilistic feature of Ca2+ binding with its sensor. If the Ca2+-sensor binding is close to a diffusion-controlled reaction as in vitro (Millet et al. 2002), a major source of this variance should be the random walk of Ca2+ ions.
Discussion
Although it has been shown that synaptic delay is Ca2+-influx dependent for mammalian neuronal synapses (Sabatini & Regehr, 1996; Bollmann et al. 2000; Schneggenburger & Neher, 2000), the synaptic delays of some neuromuscular junctions of both mammals and crustaceans are known to be Ca2+ independent (Datyner & Gage, 1980; Parnas et al. 1989; Dudel et al. 1991). In this study, we found that the delay is Ca2+ dependent at crayfish phasic neuromuscular junctions. This discrepancy may be attributed to the difference in the synapses and the range of [Ca2+]o tested. The crayfish phasic neuromuscular synapses have a very high release probability which allowed us to measure the synaptic delay over a wide range of [Ca2+]o.
In this study, we estimated Ca2+-sensor binding time from the synaptic delay of the first quanta in synaptic transmission. The synaptic vesicles that gave rise to these first quanta should be relatively uniform in their molecular arrangement for fusion. The analysis and conclusions of this study should apply only to these vesicles, which are probably already docked (or very close) to Ca2+ channels at the moment of Ca2+ channel opening. This docking is made possible by syntaxin, a protein integrated to the nerve terminal membrane. Syntaxin interacts with both Ca2+ channels (Bezprozvanny et al. 1995) and the vesicle associated membrane protein (VAMP, synaptobrevin). Due to this docking, the minimum distance between a vesicle and a Ca2+ channel has been estimated to be less than 20 nm (Shahrezaei & Delaney, 2004). Equation (8) cannot be used for vesicles with various distances from Ca2+ channels: the reaction time of Ca2+-sensor binding for these vesicles highly depends on the distances between the vesicles and Ca2+ channels, and the synaptic delay for these vesicles would more likely be affected by Ca2+ unbinding rate.
The challenge in estimating molecular reaction times and variances is to reduce unknown factors in the process so that the estimates are relatively accurate. We strived to reduce the number of free parameters in curve fitting. In the equation for Ca2+-sensor binding time we have only two unknown parameters (see eqn (9)). This equation provided a unique set of estimates with reasonable estimation errors. Other factors related to estimation error are discussed as follows. Synaptic vesicle fusion is believed to be caused by multiple Ca2+ bindings, but it is not known whether all the binding sites bind with Ca2+ with the same probability. Our method does not assume a fixed binding probability for all the binding sites, and the cooperativity of Ca2+-sensor binding does not affect the accuracy of the estimations of the total Ca2+-binding time. With our approach, the value of KD-Ca for [Ca2+]o–[Ca2+]RS conversion was estimated from synaptic responses, and therefore the Ca2+ influx that was not related to neurotransmitter release was not included. The major error source for our estimation resides in the estimation of KD-Ca value. With three free parameters in eqn (2), the estimation of KD-Ca has a relatively large error. Another possible source of estimation error is the assumption that [Ca2+]RS is constant during Ca2+-sensor reaction. If more than one Ca2+ channel contributes to the fusion of the same vesicle, [Ca2+]RS cannot be a constant value for Ca2+ sensor binding. However, this assumption affects [Ca2+]RS estimations at all Ca2+ concentrations to a similar extent, and therefore would not affect the main conclusions of this study. Lastly, the assumption that no unbinding occurs for the first quanta may affect the accuracy of the estimation.
The length and variance of the Ca2+-independent reaction time in synaptic transmission reflect the overall reaction probability of several proteins and lipid molecules involved in synaptic transmission. A simulation model by Schneggenburger & Neher (2000) provided a lower limit estimate of the rate constant for the Ca2+-independent events in vesicle fusion (6000 s−1, mammalian neurons). With our method, these events take 0.50 ± 0.03 ms in normal saline. While this 0.5 ms accounts for 81% of the total synaptic delay for the first quanta in normal crayfish saline, the variance of these reactions is only 52% of the total delay variance. The low variability of the Ca2+-independent reaction time is important for reliability of synaptic transmission. Indeed, neurons cannot afford a large number of stochastic processes in synaptic transmission. The release machinery and the structure of lipid bilayer are believed to be very similar between crustaceans and mammals. For both, the Ca2+-independent portion of the synaptic delay is composed of the time for Ca2+ channels to open, the time for Ca2+ and molecular machinery to cause vesicle fusion with the nerve terminal membrane, the subsequent neurotransmitter release and the brief time for generation of the postsynaptic response. Among these events, Ca2+ channel opening is known to be a probabilistic process; the variability of the timing of channel opening should contribute substantially to the synaptic delay variance. This leaves very little variance for other protein reactions including SNARE complex formation. Therefore, the stochastic feature of the vesicular release cannot be explained with SNARE protein interactions. Furthermore, the best way to achieve a low variability of reaction time is to keep the proteins that interact following Ca2+-sensor binding very close but separated from each other before Ca2+ influx. This idea has been expressed in a model of partial SNARE complex (Hua & Charlton, 1999) combined with a negative switch in vesicle fusion (Hua et al. 2007). The model allows very short synaptic delay and low variability of Ca2+-independent protein reactions in synaptic transmission.
Acknowledgments
We thank Dr Peter Balsam for his constructive comments for this study. This work was supported by a Barnard start-up fund for S.-Y.H.
References
- Aibara K, Ebihara S, Akaike N. Voltage-dependent ionic currents in dissociated paratracheal ganglion cells of the rat. J Physiol. 1992;457:591–610. doi: 10.1113/jphysiol.1992.sp019396. [DOI] [PMC free article] [PubMed] [Google Scholar]
- Akaike N, Kostyuk PG, Osipchuk YV. Dihydropyridine-sensitive low-threshold calcium channels in isolated rat hypothalamic neurones. J Physiol. 1989;412:181–195. doi: 10.1113/jphysiol.1989.sp017610. [DOI] [PMC free article] [PubMed] [Google Scholar]
- Akaike N, Lee KS, Brown AM. The calcium current of Helix neuron. J Gen Physiol. 1978;71:509–531. doi: 10.1085/jgp.71.5.509. [DOI] [PMC free article] [PubMed] [Google Scholar]
- Barrett EF, Stevens CF. The kinetics of transmitter release at the frog neuromuscular junction. J Physiol. 1972;227:691–708. doi: 10.1113/jphysiol.1972.sp010054. [DOI] [PMC free article] [PubMed] [Google Scholar]
- Bezprozvanny I, Scheller RH, Tsien RW. Functional impact of syntaxin on gating of N-type and Q-type calcium channels. Nature. 1995;378:623–626. doi: 10.1038/378623a0. [DOI] [PubMed] [Google Scholar]
- Blasi J, Chapman ER, Yamasaki S, Binz T, Niemann H, Jahn R. Botulinum neurotoxin C1 blocks neurotransmitter release by means of cleaving HPC-1/syntaxin. EMBO J. 1993;12:4821–4828. doi: 10.1002/j.1460-2075.1993.tb06171.x. [DOI] [PMC free article] [PubMed] [Google Scholar]
- Bollmann JH, Sakmann B, Borst JG. Calcium sensitivity of glutamate release in a calyx-type terminal. Science. 2000;289:953–957. doi: 10.1126/science.289.5481.953. [DOI] [PubMed] [Google Scholar]
- Carbone E, Lux HD. Kinetics and selectivity of a low-voltage-activated calcium current in chick and rat sensory neurones. J Physiol. 1987;386:547–570. doi: 10.1113/jphysiol.1987.sp016551. [DOI] [PMC free article] [PubMed] [Google Scholar]
- Chapman ER. Synaptotagmin: a Ca2+-sensor that triggers exocytosis? Nat Rev Mol Cell Biol. 2002;3:498–508. doi: 10.1038/nrm855. [DOI] [PubMed] [Google Scholar]
- Charlton MP, Smith SJ, Zucker RS. Role of presynaptic calcium ions and channels in synaptic facilitation and depression at the squid giant synapse. J Physiol. 1982;323:173–193. doi: 10.1113/jphysiol.1982.sp014067. [DOI] [PMC free article] [PubMed] [Google Scholar]
- Church PJ, Stanley EF. Single L-type calcium channel conductance with physiological levels of calcium in chick ciliary ganglion neurons. J Physiol. 1996;496:59–68. doi: 10.1113/jphysiol.1996.sp021665. [DOI] [PMC free article] [PubMed] [Google Scholar]
- Colquhoun D. Fundamental operations and definitions. In: Colquhoun D, editor. Lecture on Biostatistics. Oxford: Clarendon Press; 1971a. pp. 9–42. [Google Scholar]
- Colquhoun D. Stochastic (or random) processes. In: Colquhoun D, editor. Lecture on Biostatistics. Oxford: Clarendon Press; 1971b. pp. 374–395. [Google Scholar]
- Datyner NB, Gage PW. Phasic secretion of acetylcholine at a mammalian neuromuscular junction. J Physiol. 1980;303:299–314. doi: 10.1113/jphysiol.1980.sp013286. [DOI] [PMC free article] [PubMed] [Google Scholar]
- Dodge FA, Jr, Rahamimoff R. Co-operative action of calcium ions in transmitter release at the neuromuscular junction. J Physiol. 1967;193:419–432. doi: 10.1113/jphysiol.1967.sp008367. [DOI] [PMC free article] [PubMed] [Google Scholar]
- Dudel J. The effect of reduced calcium on quantal unit current and release at the crayfish neuromuscular junction. Pflugers Arch. 1981;391:35–40. doi: 10.1007/BF00580691. [DOI] [PubMed] [Google Scholar]
- Dudel J, Parnas H, Parnas I. Evoked phasic release in frog nerve terminals obtained after block of Ca2+ entry by Cd2+ Pflugers Arch. 1991;419:197–204. doi: 10.1007/BF00373007. [DOI] [PubMed] [Google Scholar]
- Foster KA, Kreitzer AC, Regehr WG. Interaction of postsynaptic receptor saturation with presynaptic mechanisms produces a reliable synapse. Neuron. 2002;36:1115–1126. doi: 10.1016/s0896-6273(02)01106-6. [DOI] [PubMed] [Google Scholar]
- Hagiwara S, Byerly L. Calcium channel. Annu Rev Neurosci. 1981;4:69–125. doi: 10.1146/annurev.ne.04.030181.000441. [DOI] [PubMed] [Google Scholar]
- Hoyle G, Wiersma CA. Excitation at neuromuscular junctions in Crustacea. J Physiol. 1958;143:403–425. doi: 10.1113/jphysiol.1958.sp006068. [DOI] [PMC free article] [PubMed] [Google Scholar]
- Hua SY, Charlton MP. Activity-dependent changes in partial VAMP complexes during neurotransmitter release. Nat Neurosci. 1999;2:1078–1083. doi: 10.1038/16005. [DOI] [PubMed] [Google Scholar]
- Hua SY, Teylan MA, Cimenser A. An antibody to synaptotagmin I facilitates synaptic transmission. Eur J Neurosci. 2007;25:3217–3225. doi: 10.1111/j.1460-9568.2007.05602.x. [DOI] [PubMed] [Google Scholar]
- Katz B, Miledi R. The measurement of synaptic delay, and the time course of acetylcholine release at the neuromuscular junction. Proc R Soc Lond B Biol Sci. 1965;161:483–895. doi: 10.1098/rspb.1965.0016. [DOI] [PubMed] [Google Scholar]
- Lin RC, Scheller RH. Structural organization of the synaptic exocytosis core complex. Neuron. 1997;19:1087–1094. doi: 10.1016/s0896-6273(00)80399-2. [DOI] [PubMed] [Google Scholar]
- Littleton JT, Stern M, Schulze K, Perin M, Bellen HJ. Mutational analysis of Drosophila synaptotagmin demonstrates its essential role in Ca2+-activated neurotransmitter release. Cell. 1993;74:1125–1134. doi: 10.1016/0092-8674(93)90733-7. [DOI] [PubMed] [Google Scholar]
- Llinás R, Steinberg IZ, Walton K. Presynaptic calcium currents and their relation to synaptic transmission: voltage clamp study in squid giant synapse and theoretical model for the calcium gate. Proc Natl Acad Sci U S A. 1976;73:2918–2922. doi: 10.1073/pnas.73.8.2918. [DOI] [PMC free article] [PubMed] [Google Scholar]
- Llinás R, Steinberg IZ, Walton K. Relationship between presynaptic calcium current and postsynaptic potential in squid giant synapse. Biophys J. 1981;33:323–351. doi: 10.1016/S0006-3495(81)84899-0. [DOI] [PMC free article] [PubMed] [Google Scholar]
- Millar AG, Bradacs H, Charlton MP, Atwood HL. Inverse relationship between release probability and readily releasable vesicles in depressing and facilitating synapses. J Neurosci. 2002;22:9661–9667. doi: 10.1523/JNEUROSCI.22-22-09661.2002. [DOI] [PMC free article] [PubMed] [Google Scholar]
- Millar AG, Zucker RS, Ellis-Davies GC, Charlton MP, Atwood HL. Calcium sensitivity of neurotransmitter release differs at phasic and tonic synapses. J Neurosci. 2005;25:3113–3125. doi: 10.1523/JNEUROSCI.4717-04.2005. [DOI] [PMC free article] [PubMed] [Google Scholar]
- Millet O, Bernado P, Garcia I, Rizo J, Pons M. NMR measurement of the off rate from the first calcium-binding site of the synaptotagmin I C2A domain. FEBS Lett. 2002;516:93–96. doi: 10.1016/s0014-5793(02)02508-5. [DOI] [PubMed] [Google Scholar]
- Msghina M, Govind CK, Atwood HL. Synaptic structure and transmitter release in crustacean phasic and tonic motor neurons. J Neurosci. 1998;18:1374–1382. doi: 10.1523/JNEUROSCI.18-04-01374.1998. [DOI] [PMC free article] [PubMed] [Google Scholar]
- Parnas H, Hovav G, Parnas I. Effect of Ca2+ diffusion on the time course of neurotransmitter release. Biophys J. 1989;55:859–874. doi: 10.1016/S0006-3495(89)82885-1. [DOI] [PMC free article] [PubMed] [Google Scholar]
- Sabatini BL, Regehr WG. Timing of neurotransmission at fast synapses in the mammalian brain. Nature. 1996;384:170–172. doi: 10.1038/384170a0. [DOI] [PubMed] [Google Scholar]
- Schiavo G, Benfenati F, Poulain B, Rossetto O, Polverino de Laureto P, DasGupta BR, Montecucco C. Tetanus and botulinum-B neurotoxins block neurotransmitter release by proteolytic cleavage of synaptobrevin. Nature. 1992;359:832–835. doi: 10.1038/359832a0. [DOI] [PubMed] [Google Scholar]
- Schneggenburger R, Meyer AC, Neher E. Released fraction and total size of a pool of immediately available transmitter quanta at a calyx synapse. Neuron. 1999;23:399–409. doi: 10.1016/s0896-6273(00)80789-8. [DOI] [PubMed] [Google Scholar]
- Schneggenburger R, Neher E. Intracellular calcium dependence of transmitter release rates at a fast central synapse. Nature. 2000;406:889–893. doi: 10.1038/35022702. [DOI] [PubMed] [Google Scholar]
- Shahrezaei V, Delaney KR. Consequences of molecular-level Ca2+ channel and synaptic vesicle colocalization for the Ca2+ microdomain and neurotransmitter exocytosis: a monte carlo study. Biophys J. 2004;87:2352–2364. doi: 10.1529/biophysj.104.043380. [DOI] [PMC free article] [PubMed] [Google Scholar]
- Simon SM, Llinás RR. Compartmentalization of the submembrane calcium activity during calcium influx and its significance in transmitter release. Biophys J. 1985;48:485–498. doi: 10.1016/S0006-3495(85)83804-2. [DOI] [PMC free article] [PubMed] [Google Scholar]
- Sollner TH. Regulated exocytosis and SNARE function. Mol Membr Biol. 2003;20:209–220. doi: 10.1080/0968768031000104953. [DOI] [PubMed] [Google Scholar]
- Sollner T, Whiteheart SW, Brunner M, Erdjument-Bromage H, Geromanos S, Tempst P, Rothman JE. SNAP receptors implicated in vesicle targeting and fusion. Nature. 1993;362:318–324. doi: 10.1038/362318a0. [DOI] [PubMed] [Google Scholar]
- Waldeck RF, Pereda A, Faber DS. Properties and plasticity of paired-pulse depression at a central synapse. J Neurosci. 2000;20:5312–5320. doi: 10.1523/JNEUROSCI.20-14-05312.2000. [DOI] [PMC free article] [PubMed] [Google Scholar]
- Zucker RS, Stockbridge N. Presynaptic calcium diffusion and the time courses of transmitter release and synaptic facilitation at the squid giant synapse. J Neurosci. 1983;3:1263–1269. doi: 10.1523/JNEUROSCI.03-06-01263.1983. [DOI] [PMC free article] [PubMed] [Google Scholar]