Abstract
To clarify the role of mitochondrial Na+–Ca2+ exchange (NCXmito) in regulating mitochondrial Ca2+ (Ca2+mito) concentration at intact and depolarized mitochondrial membrane potential (ΔΨmito), we measured Ca2+mito and ΔΨmito using fluorescence probes Rhod-2 and TMRE, respectively, in the permeabilized rat ventricular cells. Applying 300 nm cytoplasmic Ca2+ (Ca2+c) increased Ca2+mito and this increase was attenuated by cytoplasmic Na+ (Na+c) with an IC50 of 2.4 mm. To the contrary, when ΔΨmito was depolarized by FCCP, a mitochondrial uncoupler, Na+c enhanced the Ca2+c-induced increase in Ca2+mito with an EC50 of about 4 mm. This increase was not significantly affected by ruthenium red or cyclosporin A. The inhibition of NCXmito by CGP-37157 further increased Ca2+mito when ΔΨmito was intact, while it suppressed the Ca2+mito increase when ΔΨmito was depolarized, suggesting that ΔΨmito depolarization changed the exchange mode from forward to reverse. Furthermore, ΔΨmito depolarization significantly reduced the Ca2+mito decrease via forward mode, and augmented the Ca2+mito increase via reverse mode. When the respiratory chain was attenuated, the induction of the reverse mode of NCXmito hyperpolarized ΔΨmito, while ΔΨmito depolarized upon inducing the forward mode of NCXmito. Both changes in ΔΨmito were remarkably inhibited by CGP-37157. The above experimental data indicated that NCXmito is voltage dependent and electrogenic. This notion was supported theoretically by computer simulation studies with an NCXmito model constructed based on present and previous studies, presuming a consecutive and electrogenic Na+–Ca2+ exchange and a depolarization-induced increase in Na+ flux. It is concluded that Ca2+mito concentration is dynamically modulated by Na+c and ΔΨmito via electrogenic NCXmito.
Mitochondria in the cardiac myocyte have been recognized as Ca2+ stores, in addition to their role as energy providers that synthesise a large proportion of ATP required for maintaining heart function. Mitochondrial Ca2+ (Ca2+mito) activates matrix dehydrogenases (pyruvate dehydrogenase, isocitrate dehydrogenase and α-ketoglutarate dehydrogenase) (McCormack et al. 1990) and may also activate F0/F1-ATPase (Territo et al. 2000). The overall effect of elevated Ca2+mito may be the up-regulation of oxidative phosphorylation and the acceleration of ATP synthesis (McCormack et al. 1990; Balaban, 2002; Matsuoka et al. 2004; Jo et al. 2006). On the other hand, the excessive rise in Ca2+mito triggers the mitochondrial permeability transition pore (PTP) resulting in pathological cell injury and death (Weiss et al. 2003; Brookes et al. 2004; Hajnoczky et al. 2006). Therefore, the Ca2+mito concentration must be kept within the proper range to maintain physiological mitochondrial function.
In cardiac mitochondria, Ca2+ uptake and removal is mainly mediated via the mitochondrial Ca2+ uniporter and the Na+–Ca2+ exchange (NCXmito) (Gunter & Pfeiffer, 1990; Bernardi, 1999; Brookes et al. 2004), respectively. The mitochondria Ca2+ uniporter is driven by the mitochondrial membrane potential (ΔΨmito) (Rottenberg & Scarpa, 1974; O'Rourke, 2007) and a recent patch clamp study demonstrated that it is an ion channel highly selective to Ca2+ (Kirichok et al. 2004). On the other hand, the dependence of NCXmito on ΔΨmito has been controversial and an electrophysiological approach for measuring current mediated via NCXmito has not succeeded.
NCXmito was first discovered by Carafoli et al. (1974). Electrogenic or voltage-dependent Na+–Ca2+ exchange was suggested by their later studies demonstrating the higher Hill coefficient (nH) for Na+c (∼3) and the attenuation of Na+-dependent Ca2+ efflux by ΔΨmito depolarization induced by an uncoupler (Crompton et al. 1976, 1977). A later study by Jung et al. (1995) further supported this notion by measuring matrix pH and Ca2+ with fluorescence probes. To the contrary, Affolter & Carafoli (1980) demonstrated that ΔΨmito did not alter when the Ca2+ efflux via NCXmito was induced and suggested NCXmito is electroneutral. Brand (1985) also suggested the voltage-independent exchange by demonstrating that Ca2+ efflux via NCXmito was not affected by A23187, which catalyses Ca2+–2H+ exchange. Wingrove & Gunter (1986) supported this idea by in-depth measurements of the Na+c and Ca2+c dependences (nH= 2.0 and 1.0, respectively). Therefore, it is a prerequisite to clarify whether NCXmito depends on ΔΨmito in order to quantitatively understand the mechanisms regulating Ca2+mito concentration.
ΔΨmito depolarizes under various pathological conditions such as ischaemia/reperfusion (see reviews, for example, Weiss et al. 2003). Under such circumstance, cytoplasmic Na+ (Na+c) as well as Ca2+ (Ca2+c) concentrations increase (Pierce & Czubryt, 1995; Piper et al. 2003). While the increase in Ca2+c concentration leads to the accumulation of Ca2+ in mitochondria, only limited information is available about how Na+c affects Ca2+mito concentration and NCXmito activity when ΔΨmito is depolarized (Smets et al. 2004; Saotome et al. 2005). Saotome et al. (2005) recently reported a slight decrease in the affinity for Na+c of the Ca2+ efflux via NCXmito when ΔΨmito was dissipated, which is in contrast to the larger effect found by Crompton et al. (1977).
In the present study, we aimed to clarify how the changes in Na+c concentration and ΔΨmito modulate the Ca2+mito concentration of cardiac mitochondria, and how NCXmito is involved in the modulation. Our experimental and simulation studies indicated that NCXmito is voltage dependent and electrogenic. Because of this feature, NCXmito dynamically changes the exchange mode (forward or reverse) and modulates the Ca2+mito concentration in a manner dependent on Na+c and ΔΨmito.
Methods
Cell isolation
Ventricular myocytes were obtained from male Wister rats (body wt, 250–350 g) in a similar manner to recent articles (Lin et al. 2006; Shioya, 2007). This protocol was approved by the Animal Research Committee in the Graduate School of Medicine, Kyoto University. In brief, Wister rats were anaesthetized by intraperitoneal administration of pentobarbitone sodium (> 0.1 mg g−1). The heart was quickly excised after thoracotomy and mounted on a Langendorff apparatus to perfuse through the coronary artery with a Ca2+-free cell isolation buffer (CIB) at 37°C. After 8–10 min perfusion to clear the blood and to stop the heart beating, the CIB solution containing 0.2 mm Ca2+, collagenase (Type II, 1 mg ml−1 Worthington), protease (Type XIV, 0.05 mg ml−1 Sigma-Aldrich) and trypsin (Type I, 0.05 mg ml−1 Sigma-Aldrich) was perfused for 10–15 min. The left ventricle was then cut into small pieces and was shaken gently for 5–10 min in the CIB solution, to which 0.3 mm Ca2+ and 1 mg ml−1 bovine serum albumin (Sigma-Aldrich) were added. Finally, isolated myocytes were transferred to the CIB solution containing 1 mm Ca2+ and then stored in a modified DMEM solution.
Solutions and drugs
The CIB solutions contained (mm): 130 NaCl, 5.4 KCl, 0.5 MgCl2, 0.33 NaH2PO4, 22 glucose, 1 l-gutamine, 0.1 EGTA, 25 Hepes, and 0.01 units ml−1 insulin (pH 7.4 with NaOH). The modified DMEM solution was prepared by adding 20 mm NaCl, 25 mm Hepes to DMEM (without NaHCO3, MP Biomedicals) (pH 7.4 with NaOH). The bath solution contained (mm): 118 KCl, 10 EGTA, 10 Hepes, 3 K2ATP, 2 potassium pyruvate, 1 K2HPO4, 2 succinic acid, 0.1 K-ADP, 2 malic acid, and 2 potassium glutamic acid (pH 7.2 with KOH). Free Mg2+ and Ca2+ concentrations, which were calculated by WinMAXC software (Patton et al. 2004), were adjusted to be 1 mm and 300–800 nm, respectively, by adding 4.02–4.99 mm MgCl2 and 6.65–8.41 mm CaCl2. Na+c concentration was changed from 0 to 50 mm by replacing KCl with equimolar NaCl.
Ruthenium red (an inhibitor of the mitochondrial Ca2+ uniportor), cyclosporin A (an inhibitor of PTP), antimycin A (an inhibitor of complex III of the mitochondrial electron transport chain), oligomycin (an inhibitor of F0/F1-ATPase), NS1619 (an opener of mitochondrial Ca2+-activated K+ channel), and carbonyl cyanide 4-(trifluoromethoxy) phenylhydrazone (FCCP, an ionopore of protons) were purchased from Sigma-Aldrich, and CGP-37157 (an inhibitor of NCXmito) was from Tocris Cookson Inc. SM20550 (an inhibitor of mitochondrial Na+–H+ exchange) was a kind gift from Dainippon Sumitomo Phama. CGP-37157 (20 mm), cyclosporin A (1 mm), antimycin A (10 mm), oligomycin (10 mm), FCCP (1 mm) and NS1619 (10 mm) were dissolved in DMSO as stock solutions. The final concentration of DMSO in the bath solution was 0.01–0.1%. Cyclosporin A (0.1 μm) was added to the bath solution when ΔΨmito was depolarized or mitochondria were preloaded with a high Ca2+c (600 or 800 nm) unless otherwise stated. 2,3-butaedione monoxine (20 mm; BDM; Sigma-Aldrich) was added to the bath solution to reduce contraction artifacts when applying a high Ca2+c concentration (600 or 800 nm).
The bath solution was changed within 2–3 s by using a perfusion system (ValveLink8, AutoMate Scientifi Inc., USA).
Measurement of Ca2+mito and ΔΨmito in permeabilized myocytes
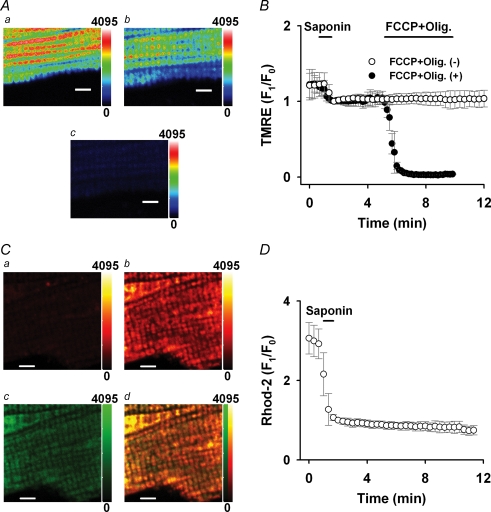
The myocytes were loaded with TMRE (an indicator for the mitochondrial membrane potential; Molecular Probes, Eugene, OR, USA), a permeant AM-ester form of Rhod-2 (a cationic indicator for Ca2+; Molecular Probes), or MitoTracker Green (a mitochondria-specific dye; Molecular Probes). To remove the fluorescence dyes from cytoplasm and to facilitate access to mitochondria, sarcolemmal membrane was permeabilized by applying a Ca2+-free bath solution containing saponin (0.1 mg ml−1) for 1 min, according to previous studies (Fry et al. 1984; Sedova & Blatter, 2000; Saotome et al. 2005). Fluorescence images were obtained at 36–37°C by using a laser scanning confocal microscope (FV500 Olympus, Japan) with a ×40 water-immersion objective lens. All the images were recorded by a single scan every 10 or 20 s, except for those in Fig. 1 (an average of five consecutive scans). Myocytes loaded with TMRE or Rhod-2 were excited at 543 nm, and the fluorescence images at > 560 nm (TMRE) or 560–600 nm (Rhod-2) were obtained. When co-loaded with MitoTracker Green (excitation; 488 nm) and Rhod-2 (excitation: 543 nm), fluorescence images at 505–525 nm and 560–600 nm, respectively, were sequentially obtained.
Figure 1. Measurement of Ca2+mito and ΔΨmito.
A, confocal images of a myocyte loaded with TMRE before (a) and after (b) saponin treatment, and 4 min after applying 1 μm FCCP and 2 μm oligomycin (c). B, time course of TMRE fluorescence change with (•) or without (○) applying 1 μm FCCP and 2 μm oligomycin (FCCP + Olig). C, confocal images of a myocyte co-loaded with Rhod-2 and MitoTracker Green after saponin treatment. Rhod-2 images before (a) and 5 min after (b) applying 600 nm Ca2+, MitoTracker Green image 5 min after applying 600 nm Ca2+ (c), and a merged image of Rhod-2 and MitoTracker Green image (d). D, time course of Rhod-2 fluorescence change. In A and C, the colour scale of fluorescence intensity is denoted on the right side (arbitrary units) and a bar indicates 5 μm in each image. In B and D, the TMRE and Rhod-2 fluorescences were normalized to the first one after the saponin treatment.
The fluorescence intensity (F) of TMRE or Rhod-2 within the cell area was obtained by subtracting a background component as follows:
where Fcell and Fbackground are an average of fluorescence from the entire cell area and the extracellular area, respectively.
For the measurement of ΔΨmito, the myocytes were loaded with 25 nm TMRE for 10 min at room temperature. To reduce TMRE fluorescence loss, 12.5 nm TMRE was added to the bath solution. Figure 1A demonstrates TMRE fluorescence images before (a) and after (b) the saponin treatment (0 Ca2+). The fluorescence pattern was similar to that of MitoTracker Green in Fig. 1Cc and fluorescence in the extracellular area was almost negligible (3–4% of cellular area). The saponin treatment decreased the TMRE fluorescence about by 20%, but did not affect the mitochondrial alignment. Most of the remaining fluorescence reflects ΔΨmito, whose value is about −150 to −180 mV under the normal condition (Nicholls & Budd, 2000). Applying 1 μm FCCP and 2 μm oligomycin abolished the TMRE fluorescence (Fig. 1Ac; 3 min after), indicating depolarization of ΔΨmito. The TMRE fluorescence was stable over 10 min as shown in Fig. 1B (open circles). In the present study, ΔΨmito was depolarized with a variety of procedures illustrated by an example in Fig. 1B (filled circles; 1 μm FCCP and 2 μm oligomycin (FCCP + Olig.)) and change of ΔΨmito (mV) was estimated according to a study by O'Reilly et al. (2003) as follows:
where F0 and F1 are an average fluorescence intensity of TMRE in the cell area, from which the background fluorescence was subtracted, before and after the procedures, respectively. Table 1 summarizes the change of ΔΨmito and the half-time to steady state (t1/2).
Table 1.
Summary of ΔΨmito change
| Estimated change in ΔΨmito (mV) | t1/2 (s) | |
|---|---|---|
| Sub(−) | 78 ± 25 | 132 ± 34 (n = 6) |
| FCCP | 104 ± 4 | 30 ± 4 (n = 10) |
| FCCP + Olig | 101 ± 4 | 36 ± 10 (n = 7) |
| Anti + Olig | 104 ± 3 | 87 ± 26 (n = 7) |
| NS1619 | 75 ± 21 | 282 ± 91 (n = 7) |
| NS1619 + Sub(−) | 97 ± 11 | 154 ± 47 (n = 10) |
Sub(−); removal of mitochondrial substrates (potassium pyruvate, K2HPO4, succinic acid, K-ADP, malic acid, and potassium glutamic acid); FCCP; 1 μm FCCP; FCCP + Olig; 1 μm FCCP and 2 μm oligomycin; Anti + Olig; 10 μm antimycin A and 2 μm oligomycin; NS1619; 10 μm NS1619; and NS1619 + Sub(−); 10 μm NS1619 without the mitochondrial substrates.
For the measurement of Ca2+mito, rat myocytes were loaded with 5 μm Rhod-2 for 60 min at 4°C as described in previous studies (Trolinger et al. 1997; Jo et al. 2006). Rhod-2 was located also in the cytoplasm after the loading (data not shown), but the saponin treatment greatly washed it out (Fig. 1Ca). Localization of Rhod-2 in mitochondria was confirmed in the myocytes by further loading of 200 nm MitoTracker Green for 30 min at 37°C. The Rhod-2 fluorescent was slightly visible after the saponin treatment (Fig. 1Ca; 0 nm Ca2+), while the fluorescence from unloaded control myocytes was not detectable (not shown). Applying Ca2+ remarkably but locally increased the fluorescence intensity (Fig. 1Cb; 5 min after applying 600 nm Ca2+). Figure 1Cc is an image of MitoTracker Green from the same cell and a merged image of panel b and c is shown in panel d, indicating that fluorescences of Rhod-2 and MitoTracker Green were largely co-localized. On average, 96 ± 3% (n = 5) of the MitoTracker Green fluorescence co-localized with the Rhod-2 fluorescence. Therefore we concluded that the Rhod-2 almost exclusively monitors Ca2+ in mitochondria under the present experimental conditions. The Rhod-2 fluorescence was stable over 10 min and did not show significant photo bleaching as shown in Fig. 1D.
Statistical analysis
Data are presented as mean ± s.d. Statistical analyses were performed by one-factor ANOVA using StatView (SAS Institute Inc.). Multiple and two-group comparisons were performed according to Student–Newman–Keul's method and Student's t test, respectively. P < 0.05 was considered significant.
A computer model of NCXmito
A computer model of NCXmito was constructed using Visual Studio 2005 (Microsoft). Details are described in the Appendix.
Results
Na+c dependence of Ca2+mito
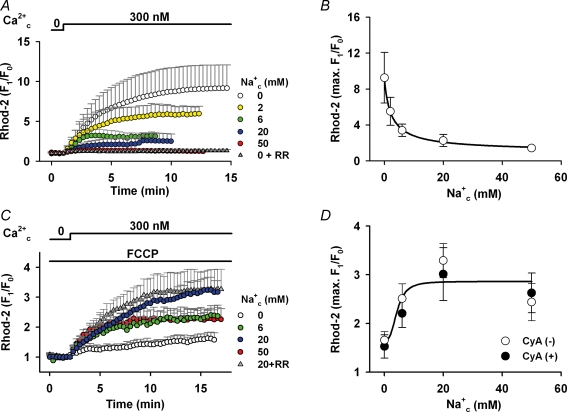
Dependence of Ca2+mito concentration on Na+c was first examined at intact ΔΨmito in Fig. 2. An increase in Ca2+c from 0 to 300 nm greatly augmented Ca2+mito, which was measured by Rhod-2, in the absence of Na+c (white circles). The rise was 9.2 ± 2.8 times on average and it took about 10 min to reach steady state. The rise of Rhod-2 fluorescence was almost completely inhibited by 7 μm ruthenium red (grey triangles), an inhibitor of the mitochondrial Ca2+ uniporter (IC50= 9 nm; Kirichok et al. 2004), supporting the previous notion that the Ca2+ uniporter is the dominant mechanism of Ca2+mito influx (Gunter & Pfeiffer, 1990; Bernardi, 1999). The maximum Ca2+mito level decreased with increasing Na+c concentration. Averages of the maximum increase were 5.5, 3.4, 2.3 and 1.4 times in the presence of 2, 6, 20 and 50 mm Na+c, respectively. The Na+c-dependent decrease is most probably due to Ca2+mito removal via NCXmito. Fitting a Hill equation to the maximum Rhod-2 fluorescence levels yielded a half-inhibitory concentration (IC50) of 2.4 mm Na+ (Fig. 2B).
Figure 2. Effects of Na+c on Ca2+mito.
A, Ca2+c-induced Ca2+mito increase at intact ΔΨmito. Ca2+c (300 nm) was added in the presence of various concentrations of Na+c as denoted at the top and right of graph. Ruthenium red (RR; 7 μm) was added to the Na+-free solution (grey triangles, n = 10). The Rhod-2 fluorescence was normalized to the one before applying Ca2+c. B, Na+c dependence of Ca2+mito. The maximum increases of Rhod-2 fluoresce in A (9.2 ± 2.8, 5.5 ± 1.6, 3.4 ± 0.7, 2.3 ± 0.7 and 1.4 ± 0.2 times, in the presence of 0, 2, 6, 20 and 50 mm Na+c, respectively) were plotted against Na+c concentration. The curve is a fitted equation: 1.0 + 8.2/(1 + (Na+c/2.4)0.9). n = 4–23. C, Ca2+c-induced Ca2+mito increase at depolarized ΔΨmito. The same protocol as in A was repeated in the presence of 1 μm FCCP. RR (7 μm) was added to the solution containing 20 mm Na+ (grey triangles, n = 9). D, the maximum increases of Rhod-2 fluoresce (○) in C (1.7 ± 0.2, 2.5 ± 0.3, 3.3 ± 0.4 and 2.4 ± 0.4 times in the presence of 0, 6, 20 and 50 mm Na+c, respectively) were plotted. The curve is a fitted equation: 1.7 + 1.2/(1 + (4.3/Na+c)3.0). n = 5–11. Data with cyclosporin A (•) are 1.5 ± 0.2, 2.2 ± 0.3, 3.0 ± 0.5 and 2.6 ± 0.4 times in the presence of 0, 6, 20 and 50 mm Na+c, respectively. n = 4–7. The maximum increases were not significantly different in the absence and presence of the drug at each Na+c concentration.
On the other hand, an opposite Na+c dependence was obtained when ΔΨmito was depolarized. In Fig. 2C, the myocytes were first superfused with the bath solution containing 1 μm FCCP, which greatly depolarized ΔΨmito (see Table 1). Applying 300 nm Ca2+ increased the Rhod-2 fluorescence only 1.7 times in the absence of Na+c. However, with 6 or 20 mm Na+c, the rise was augmented to 2.5 and 3.1 times, respectively. A further increase of Na+c to 50 mm attenuated the fluorescence intensity. The half-effective concentration (EC50) for Na+c was about 4 mm (Fig. 2D). Under this experimental condition, the Ca2+c-induced Ca2+mito increase might be due to mechanism(s) different from the Ca2+ uniporter because the Ca2+ influx through the channel was likely to be largely attenuated when ΔΨmito is depolarized (Rottenberg & Scarpa, 1974; O'Rourke, 2007). Consistent with this notion, ruthenium red did not significantly affect the Ca2+mito increase (Fig. 2C; grey triangles; 20 mm Na+c+ 7 μm ruthenium red). The involvement of PTP in the Ca2+c-induced Ca2+mito increase is probably small because addition of 0.1 μm cyclosporin A, which is a potent inhibitor of PTP (IC50= 25 nm; McGuinness et al. 1990), to the bath solution did not greatly affect the Ca2+mito increase (filled circles in Fig. 2D).
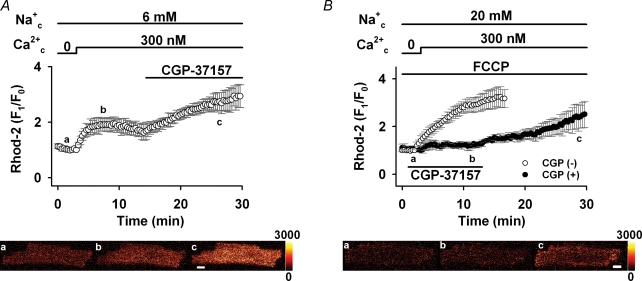
One of the major Ca2+ handling mechanisms of cardiac mitochondria is NCXmito, which exchanges Ca2+mito for Na+c (Crompton et al. 1976, 1977; Bernardi, 1999). We hypothesized that NCXmito is involved in the Ca2+c-induced Ca2+mito increase at both intact and depolarized ΔΨmito. This hypothesis was first tested pharmacologically in Fig. 3. As we expected, applying 30 μm CGP-37157, which almost completely suppresses NCXmito (IC50= 0.36 μm; Cox et al. 1993; also see Fig. 4A), after the application of 300 nm Ca2+c and 6 mm Na+c induced a further increase in the Rhod-2 fluorescence when ΔΨmito was intact (Fig. 3A). This result indicates that the forward mode of NCXmito operates under this condition, attenuating Ca2+mito increase due to Ca2+ influx through the Ca2+ uniporter. To the contrary, when ΔΨmito was depolarized by 1 μm FCCP (Fig. 3B), CGP-37157 attenuated the increase in Rhod-2 fluorescence (3.4 versus 1.4 times, P < 0.05) and a removal of the drug induced a fluorescence increase. This result suggested that the Ca2+mito increase was mediated by the Ca2+ influx through the reverse mode of NCXmito, not via the Ca2+ uniporter. Therefore, it was suggested that NCXmito mediates the Na+c-dependent Ca2+mito extrusion (forward mode of exchange) when ΔΨmito is intact, while the exchange mode reverses when ΔΨmito depolarizes. Dependences of NCXmito on Na+c and ΔΨmito were studied in detail in the following experiments.
Figure 3. Effects of NCXmito inhibition on Ca2+c-induced Ca2+mito increase.
A, inhibition of forward mode of NCXmito at normal ΔΨmito. After reaching a steady state of Rhod-2 fluorescence, 30 μm CGP-37157 was added to the bath solution. n = 6. Representative images of a myocyte loaded with Rhod-2 before (a) and after (b) adding Ca2+c, and 15 min after applying CGP-37157 (c) are shown in the lower panel. B, inhibition of reverse mode of NCXmito at depolarized ΔΨmito. The protocol is the same as in Fig. 2C and 30 μm CGP-37157 was added prior to the application of 300 nm Ca2+c (•, n = 5). The maximum increase with and without CGP-37157 was significantly different. Representative images are shown in the lower panel. The colour scale of fluorescence intensity is denoted on the right side (arbitrary units) and a bar indicates 10 μm.
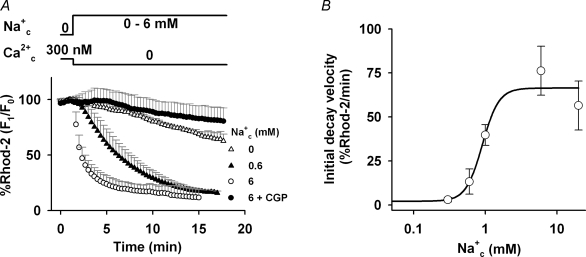
Figure 4. Na+c dependence of Ca2+ efflux via forward mode of NCXmito.
A, time course of Ca2+mito decrease. The myocytes were preloaded with 300 nm Ca2+c and Ca2+ efflux via forward mode of NCXmito was induced by applying the bath solution with no Ca2+ and various Na+c as denoted on the right of graph. CGP-37157 (30 μm) was added to the solution with 6 mm Na+ (•). The Rhod-2 fluorescence was normalized to that before changing the solution. B, Na+c dependence of initial decay velocity of Ca2+ efflux. The initial decay velocity of Ca2+ efflux (2.1 ± 0.4, 3.1 ± 1.3, 13.3 ± 7.1, 39.7 ± 5.9, 76.2 ± 13.9 and 56.5 ± 13.9% min−1 in the presence of 0, 0.3, 0.6, 1, 6 and 20 mm Na+c, respectively) was fitted by a Hill equation: 2.2 + 64.2/(1 + (0.9/Na+c)3.8). n = 4–7.
Ca2+ efflux through the forward mode of NCXmito
In Fig. 4, the Na+c dependence of the forward mode of NCXmito was studied under the condition where NCXmito mainly operates Ca2+ efflux from mitochondria. The myocytes were first preloaded with Ca2+ by superfusing with bath solution containing 300 nm Ca2+c and no Na+c until the Rhod-2 fluorescence reached a steady state. Switching the bath solution to one containing no Ca2+c and 6 mm Na+c induced a decay of Rhod-2 fluorescence with a half-time to steady state (t1/2) of about 60 s (open circles). With 30 μm CGP-37157 (filled circles) or no Na+ (open triangles), the decay was significantly attenuated and did not reach a steady state within 30 min. The initial decay velocity (% min−1) was plotted against Na+c concentration (Fig. 4B). The half-maximum concentration (K1/2) of Na+c was about 1 mm, a value which is comparable to the IC50 in Fig. 2B. The high Hill coefficient (nH= 3.8) suggests that more than three Na+ are transported.
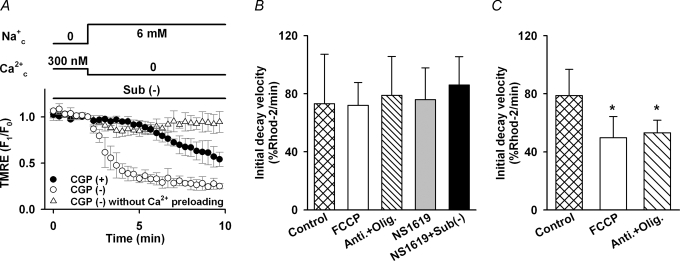
The voltage dependence of NCXmito has been controversial. To directly address this issue, we measured ΔΨmito in TMRE-loaded myocytes. When the Ca2+ efflux via NCXmito was induced with the same protocol as in Fig. 4 (6 mm Na+c), no significant change in the TMRE fluoresence was observed (data not shown). This result is consistent with experiments by Affolter & Carafoli (1980), but inconsistent with the ΔΨmito dependence suggested in Figs 2 and 3. Since ΔΨmito is largely maintained by H+ pumping via the respiratory chain (Nicholls & Budd, 2000), NCXmito-induced membrane potential change might be compensated by the respiratory chain. As expected, a large decline of the TMRE fluorescence (depolarization) was induced upon the activation of Ca2+ efflux via NCXmito (open circles, Fig. 4A) when the respiratory chain was suppressed by removing mitochondria substrates (potassium pyruvate, K2HPO4, succinic acid, K-ADP, malic acid and potassium glutamic acid). The decline of TMRE fluorescence was largely attenuated by CGP-37157 (closed circles, Fig. 5A) and was significantly suppressed without mitochondria pre-loading with Ca2+ (triangles, Fig. 5A). These data demonstrated that the Ca2+ efflux via the forward mode of NCXmito depolarizes ΔΨmito. The direction of ΔΨmito change is consistent with that expected in plasma membrane NCX, in which positive charge is supposed to move concurrently with Na+ flux (Hilgemann et al. 1991; Matsuoka & Hilgemann, 1992; Powell et al. 1993). The above results indicated that NCXmito is electrogenic.
Figure 5. Voltage dependence of forward mode of NCXmito.
A, ΔΨmito change upon activation of forward mode of NCXmito with (•, n = 4) and without (○, n = 6) 30 μm CGP-37157. TMRE fluorescence was normalized to the one before changing the bath solution to that containing 6 mm Na+ and no Ca2+. Mitochondria were preloaded with Ca2+ for 10 min with the protocol in Fig. 4. Without Ca2+ preloading, no remarkable change in TMRE fluorescence was induced (▵, n = 5). B, ΔΨmito dependence of forward mode of NCXmito in intact (Control) and depolarized mitochondria preloaded with 300 nm Ca2+c. The initial decay velocity of Rhod-2 fluorescence was measured at control and depolarized ΔΨmito by 1 μm FCCP, 10 μm antimycin A and 2 μm oligomycin (Anti + Olig), 10 μm NS1619, and 10 μm NS1619 without mitochondrial substrates (NS1619 + Sub(−)). The initial decay velocity was not significantly different among the five groups. n = 5–24. C, ΔΨmito dependence of forward mode of NCXmito in mitochondria preloaded with 800 nm Ca2+c. The initial decay velocity was measured at control and depolarized ΔΨmito by FCCP or Anti + Olig. The initial decay velocity of FCCP or Anti + Olig was significantly smaller than the control group (*P < 0.05). n = 7–11. In these experiments, 0.1 μm cyclosporin A was added to inhibit PTP.
The ΔΨmito dependence of Ca2+ efflux via NCXmito was studied in Fig. 5B. ΔΨmito was altered by several procedures: 1 μm FCCP (an ionopore of proton), 10 μm antimycin A (an inhibitor of complex III of the mitochondrial electron transport chain, IC50= 13 nm; Cherednichenko et al. 2004) and 2 μm oligomycin (an inhibitor of F0/F1-ATPase, IC50≈ 0.3 μm; Van Dyke et al. 1984) (Anti + Olig.), 10 μm NS1619 (an opener of mitochondrial Ca2+-activated K+ channel; Sato et al. 2005), and 10 μm NS1619 without mitochondrial substrates (NS1619 + Sub(−)). It was estimated that these procedures depolarized the mitochondrial membrane by approximately 104, 104, 75 and 97 mV on average, respectively (see Table 1). In Fig. 5B, Rhod-2-loaded myocytes were first pre-loaded with 300 nm Ca2+c until reaching a steady state; these conditions were maintained for 5–12 min to allow ΔΨmito to reach a new steady state. Then the Ca2+ efflux was induced in a manner similar to Fig. 4A (6 mm Na+). However, the initial decay velocity of Rhod-2 fluorescence was not significantly different between intact and depolarized mitochondria. Our computer model predicted, as shown later in Fig. 7, that the Ca2+ efflux via NCXmito is more steeply dependent on ΔΨmito at higher Ca2+mito. In line with this prediction, the initial decay velocity was largely slowed by the ΔΨmito depolarization (FCCP, Anti + Oligo) when mitochondria was pre-loaded with 800 nm Ca2+ (Fig. 5C). The contribution of PTP and Ca2+ uniporter to the Rhod-2 fluorescence decay was unlikely, because no significant difference was found in the initial decay velocity at intact ΔΨmito with or without ruthenium red, which was added after the pre-loading (71.2 ± 9.6 versus 76.7 ± 13.9% min−1) and cyclosporin A (78.9 ± 18.0 versus 76.7 ± 13.9% min−1). These data indicated that the Ca2+ efflux via the forward mode of NCXmito is dependent on ΔΨmito. However, the Ca2+ efflux might be saturated at negative ΔΨmito when Ca2+mito concentration is lower.
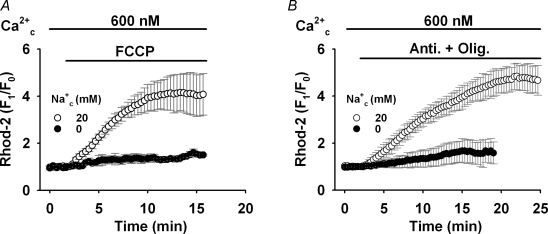
Figure 7. Effects of Na+c on depolarization-induced Ca2+mito increase by 1 μm FCCP (A) or 10 μm antimycin A and 2 μm oligomycin (B).
The protocol is the same as in Fig. 6A. Removal of Na+c significantly attenuated the depolarization-induced Ca2+mito increase. Data are with 20 mm Na+c (○: n = 7, A; n = 7, B) and without Na+c (•: n = 5, A; n = 6, B).
Ca2+ influx through the reverse mode of NCXmito
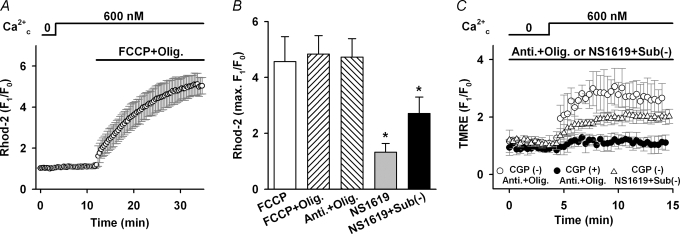
The voltage dependence of the reverse mode of NCXmito was studied in Fig. 6. In this series of experiments, 7 μm ruthenium red, 0.1 μm cyclosporin A and 10 μm SM20550 (IC50= 10 nm; Yamamoto et al. 2000) were added to the bath solution to suppress the mitochondrial Ca2+ uniporter, PTP, and the mitochondrial Na+–H+ exchange, respectively. Applying 600 nm Ca2+c did not significantly increase the Rhod-2 fluorescence, but membrane depolarization by 1 μm FCCP and 2 μm oligomycin (FCCP + Olig, Fig. 6A) remarkably augmented the Rhod-2 fluorescence (Na+c= 20 mm). Essentially the same result was obtained with 1 μm FCCP alone (Fig. 7A), or 10 μm antimycin A and 2 μm oligomycin (Anti + Olig, Fig. 7B). CGP-37157 (30 μm) did not significantly affect the Rhod-2 fluorescence with 600 nm Ca2+c at the intact Ψmito, but greatly attenuated the depolarization-induced Ca2+mito rise (data not shown), indicating that the Ca2+mito increase is mediated via the reverse mode of NCXmito. Although FCCP might induce mitochondrial ATP depletion via the reverse of F0/F1-ATPase (Nicholls & Budd, 2000) and Ca2+ release from sarcoplasmic reticulum (Landolfi et al. 1998), these effects were not involved in the Ca2+mito increase because no significant difference was found both in the maximum increase of Ca2+mito (Fig. 6B) and the change of ΔΨmito (Table 1) among the procedures with FCCP, FCCP + Olig, and Anti + Olig. However, lesser ΔΨmito depolarization by NS1619 or NS1619 + Sub(−) tended to induce a lower increase in Ca2+mito. This suggested a strong voltage dependence of the reverse mode of NCXmito. To further confirm the voltage-dependent nature of the reverse mode of NCXmito, we measured the change in ΔΨmito with TMRE upon inducing the reverse mode of NCXmito (Fig. 6C). Applying 600 nm Ca2+ to the myocyte that was treated with the NS1619 + Sub(−) procedure increased the TMRE fluorescence twofold (triangles), indicating membrane hyperpolarization. A larger increase in the TMRE fluorescence was induced in myocytes treated with Anti + Olig (open circles) probably because of larger activity of NCXmito (see Fig. 6B). CGP-37157 significantly inhibited the fluorescence increase (filled circles, Fig. 6C). These data indicated that NCXmito is electrogenic also in the reverse mode. The direction of ΔΨmito change was opposite to that induced by the forward mode of NCXmito (Fig. 5A), and consistent with the notion that the Na+ translocation step is electrogenic.
Figure 6. Voltage dependence of reverse mode of NCXmito.
A, the increase in Ca2+mito change upon ΔΨmito depolarization. Ca2+ (600 nm) was added as denoted at the top of graph under the conditions that Ca2+ uniporter and PTP were suppressed. Na+c concentration was 20 mm. Depolarization by 1 μm FCCP and 2 μm oligomycin (FCCP + Olig) significantly augmented the Rhod-2 fluorescence. B, summary of Ca2+mito increase induced by five depolarization procedures. The maximum increases of Rhod-2 florescence were 4.6 ± 0.9, 4.8 ± 0.7, 4.7 ± 0.7, 1.3 ± 0.3 and 2.7 ± 0.6 times, respectively, in the presence of FCCP, FCCP + Olig, Anti + Olig, NS1619, and NS1619 + Sub(−). n = 5–27. The maximum increase by NS1619 or NS1619 + Sub(−) was significantly small than the other groups (*P < 0.05). C, ΔΨmito change upon activation of reverse mode of NCXmito. The myocytes loaded with TMRE were superfused with the bath solution containing Anti + Olig or NS1619 + Sub(−). The reverse mode of NCXmito was induced by adding 600 nm Ca2+c with (•) and without (○ and ▵) CGP-37157. n = 5–10.
The Na+c dependence of the reverse mode of NCXmito was studied in Fig. 7. Although the reverse mode of NCXmito was expected to be enhanced by removing Na+c, the Na+c removal almost completely abolished the depolarization-induced Ca2+mito increase by FCCP alone (Fig. 7A) or antimycin A and oligomycin (Anti + Olig, Fig. 7B). These results are consistent with data in Fig. 2, but apparently conflict with the general characteristics of plasma membrane NCX.
The above experimental findings strongly indicated that the Na+c-dependent Ca2+mitodecrease at intact ΔΨmito and increase at depolarized ΔΨmito are mediated via voltage-dependent and electrogenic NCXmito. We further studied dependences of NCXmito on Na+c and ΔΨmito by computer simulations.
Simulation study on NCXmito
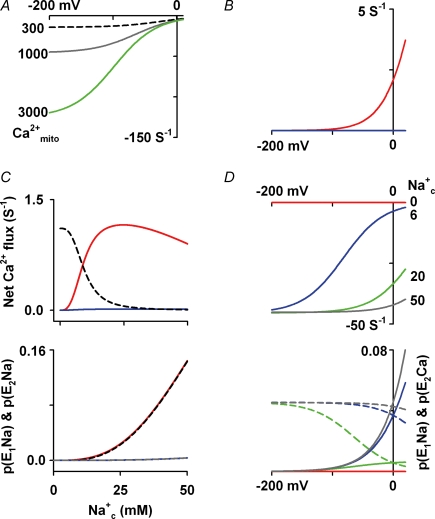
As described in the Appendix, our computer model of NCXmito assumed the following hypotheses: (i) electrogenic 3Na+/1Ca2+ exchange, (ii) the carrier-bound 3Na+ has one positive charge, and (iii) a consecutive exchange which consists of two states of the carrier (E1 and E2). We examined how this model can explain our and previous experimental data. In Fig. 8A, the voltage dependence of Ca2+ efflux was simulated at various Ca2+mito; 300 nm (black dashed line), 1000 nm (grey line) and 3000 nm (green line). The saturation of the Ca2+ efflux with 300 nm Ca2+mito at negative ΔΨmito is in agreement with the result in Fig. 5B. However, increasing Ca2+mito steepened the voltage dependence. The steep ΔΨmito dependence at higher Ca2+mito concentrations is in agreement with the present (Fig. 5C) and previous experiment by Crompton et al. (1977) demonstrating that depolarization by an uncoupler attenuated the Na+c-dependent Ca2+ efflux from isolated mitochondria pre-loaded with 1000–3000 nm Ca2+c. The voltage dependence of the reverse mode of NCXmito was simulated under the experimental conditions of Fig. 6 (Fig. 8B). We assumed a linear relationship between Na+c and Na+ in the mitochondrial matrix (Na+mito) according to experimental data by Jung et al. (1992) as described in the Appendix; Na+c/Na+mito= 8.6 at intact ΔΨmito (red line in Fig. 8B) and Na+c/Na+mito= 2.2 at depolarized ΔΨmito (blue line in Fig. 8B). It was predicted that the Ca2+ influx is negligible at intact ΔΨmito (−180 to about −150 mV), but the ΔΨmito depolarization and the following increase in Na+mito permeability strongly augment the Ca2+ influx at ΔΨmito more than −100 mV (red line in Fig. 8B). These results are comparable to the experimental result in Fig. 6A. The Na+c dependence of the reverse model of NCXmito at depolarized ΔΨmito was studied in Fig. 8C. Increasing Na+c monotonically attenuated the Ca2+ influx when a constant Na+mito (4 mm) was assumed (black dashed line in upper panel of Fig. 8C) because of the competitive inhibition of the Ca2+c binding by Na+c. If the ratio of Na+c/Na+mito under the normal condition (8.6) was assumed, no significant increase in the Ca2+ influx was evoked (blue line in the upper panel of Fig. 8C). This is because the probability of carriers bound with Na+c and Na+mito (P(E1Na) and P(E2Na), respectively) did not significantly increase (grey dashed line and blue line in lower panel of Fig. 8C). However, if the ratio under the depolarized condition (2.2) was assumed, P(E1Na) and P(E2Na) remarkably increased as increasing Na+c (black dashed line and red line in the lower panel of Fig. 8C), and the Ca2+ influx augmented as increasing Na+c and peaked approximately at 20 mm Na+c (red line in upper panel of C). This relation is consistent with the experimental finding in Fig. 2D.
Figure 8. Simulation of net Ca2+ flux via NCXmito.
A, relation between net Ca2+ flux and ΔΨmito of forward mode of NCXmito. Ca2+mito= 300, 1000 and 3000 nm as denoted at the left of graph. Na+c= 6 mm, Ca2+c= 0 and Na+mito= Na+c/8.6 mm. B, relation between net Ca2+ flux and ΔΨmito of reverse mode of NCXmito. Na+c= 20 mm, Ca2+c= 600 nm, Ca2+mito= 0, and with Na+mito= Na+c/2.2 (red line) or Na+c/8.6 mm (blue line). C, Na+c dependence of Ca2+ influx via reverse mode (upper panel), and P(E2Na) and P(E1Na) (at lower panel). Ca2+mito= 0, Ca2+c= 300 nm and ΔΨmito= 0 mV. At upper panel, Na+mito was set to a fixed value (4 mm, black dashed line), Na+c/8.6 (blue line), and Na+c/2.2 mm (red line), respectively. In lower panel, P(E2Na) and P(E1Na) were plotted setting Na+mito= Na+c/8.6 (blue line and grey dashed line, respctively) and Na+mito= Na+c/2.2 mm (red and black dashed line, respectively). D, effects of Na+c on Ca2+ efflux via forward mode of NCXmito. Upper and lower panels represent the net Ca2+ flux–ΔΨ relationship and the ΔΨ dependence of P(E1Na) (continuous lines) and P(E2Ca) (dashed lines). Na+mito= Na+c/8.6 mm, Ca2+mito= 1000 nm, and Ca2+c= 0. Na+c is denoted at right of graph.
The above simulation results demonstrated that the voltage-dependent nature of NCXmito plays key roles in regulating Ca2+mito concentration, and predicted that the increase in mitochondrial Na+ permeability at depolarized ΔΨmito contributes to the apparently opposite Na+c dependence of the reverse mode of NCXmito.
Discussion
The voltage dependence or electrogenicity of NCXmito has been controversial since NCXmito was first discovered by Carafoli et al. (1974). In the present study, we for the first time recorded the ΔΨmito change upon inducing the forward and reverse mode of NCXmito. This finding strongly indicated that NCXmito is electrogenic. The direction of ΔΨmito change suggested that net positive charge moves in the direction of net Na+ flux, or that net negative charge moves in the direction of net Ca2+ flux. The Na+ translocation step of NCXmito may be a major electrogenic step, analogously to the plasma membrane NCX (Hilgemann et al. 1991; Matsuoka & Hilgemann, 1992; Powell et al. 1993). The latter is also possible as shown in plasma membrane NCX (Niggli & Lederer, 1991). Affolter & Carafoli (1980) failed to observe the ΔΨmito change upon inducing the Na+c-dependent Ca2+ efflux from isolated mitochondria. The ΔΨmito change induced by NCXmito might be easily compensated by H+ pumping via the respiratory chain. This hypothesis was validated in the experiment of Fig. 5A where the expected change in ΔΨmito was observed when the respiratory chain was inhibited.
The voltage dependence of NCXmito may depend on ionic conditions. The Na+c-dependent Ca2+ efflux from mitochondria preloaded with a relatively low concentration of Ca2+c (300 nm) was not significantly affected by ΔΨmito depolarization (Fig. 5B), but it was indeed affected when preloaded with higher Ca2+c (800 nm, Fig. 5C). The latter finding was consistent with the data of Crompton et al. (1977) demonstrating that ΔΨmito depolarization by an uncoupler greatly attenuated the Na+c-dependent Ca2+ efflux from isolated mitochondria preloaded with 1000–3000 nm Ca2+c. Our computer simulation predicted that the slope of net Ca2+ flux of the forward mode of NCXmito depends on Ca2+mito concentration (Fig. 8A) and supported the experimental findings. Our computer model further predicted that the Na+c concentration also affects the slope of voltage dependence as shown in Fig. 8D. The increase in Na+c concentration augmented the probability of exchanger bound with Na+c (P(E1Na)) and that with Ca2+mito (P(E2Ca)) at higher ΔΨmito, resulting in the augmentation of Ca2+ efflux at higher ΔΨmito and the attenuation of the voltage dependence. On the other hand, a substantial increase in the Ca2+ influx via the reverse mode of NCXmito was induced by the ΔΨmito depolarization (Fig. 6A). This marked effect of depolarization is probably due to the steep voltage dependence of NCXmito under the experimental conditions (20 mm Na+c, Fig. 8B). Details of the voltage dependence of NCXmito remain to be clarified by direct measurement of NCXmito-associated current.
Saotome et al. (2005) suggested that ΔΨmito dissipation does not remarkably affect Ca2+ efflux via NCXmito when preloaded with 300 nm Ca2+c. Their findings might be in line with our conclusion. However, in their experiments, about a half of the Ca2+ efflux was mediated via non-NCXmito mechanism(s) which was insensitive to Na+c and diltiazem (an inhibitor of NCXmito), and the speed of the Ca2+ efflux was slower. Experimental temperature (22 versus 37°C) might affect the turnover rate of NCXmito.
As demonstrated in the current and previous studies (Sedova & Blatter, 2000; Malli et al. 2003), Na+c significantly affects Ca2+mito concentration through the forward mode of NCXmito. However, a variety of K1/2 values of NCXmito for Na+c has been reported in cardiac myocytes and other cells, ranging from 1 to 12 mm (Crompton et al. 1976, 1978; Coll et al. 1982; Fry et al. 1984; Wingrove & Gunter, 1986; Sedova & Blatter, 2000; Saotome et al. 2005; Fig. 4B from our data). Our computer simulation predicted that the affinity for Na+c is decreased by the ΔΨmito depolarization, the increase in Ca2+mito or increase in Ca2+c concentration (data not shown). Thus the variability of the K1/2 value is probably, at least in part, caused by the experimental conditions employed.
The most puzzling finding was the Na+c dependence of the reverse mode of NCXmito. The dependence was opposite to the general characteristics of plasma membrane NCX and the NCXmito model (the black dashed line of the upper panel in Fig. 8C). However, the NCXmito model well reproduced the experimentally obtained Na+c dependence by adopting the relationship between Na+c and Na+mito in isolated mitochondria (Jung et al. 1992). Griffiths (1999) found that metabolic inhibition induced the collapse of ΔΨmito and the Ca2+mito increase in rat cardiomyocytes and the Ca2+mito increase was attenuated by CGP-37157. Similar results were obtained in metabolically inhibited renal epithelial cells of Madin–Darby canine kidney (MDCK) and concomitant increases in Na+c and Na+mito were observed (Smets et al. 2004; Baron et al. 2005). It is logically expected that the increase in Na+cattenuates the reverse mode of NCXmito. However, as demonstrated by the present experiments and computer simulation, the increase in Na+c up to 50 mm still induced significant Ca2+ influx via NCXmito when ΔΨmito was depolarized because of a possible increase in the Na+ permeability of the mitochondrial membrane.
Several pathways of mitochondrial Na+ flux have been proposed; Na+–H+ exchange for Na+ efflux, and NCXmito, Na+ channel and PTP for Na+ influx (Bernardi, 1999). Monocarboxylic acid transporter (lactate or pyruvate – Na+ cotransporter; Takeo & Tanonaka, 2004) and mitochondrial KATP channels (Bernardinelli et al. 2006) may be another route for Na+ influx. Although mechanisms of the depolarization-induced increase in Na+ permeability has not been clarified, it might be speculated that the depolarization procedures employed in this study increased mitochondrial H+, which in turn attenuated H+ gradient across the mitochondrial membrane and inhibited Na+ efflux via Na+–H+ exchanger. In our preliminary experiments, no remarkable difference was observed in the depolarization-induced Ca2+mito increase with or without SM20550, an inhibitor of mitochondrial Na+–H+ exchange. This might indicate that the Na+–H+ exchanger was already suppressed when ΔΨmito was depolarized.
In this study, we did not calibrate Rhod-2 fluorescence due to the difficulty of accurate calibration, and assumed a linear relationship between the Rhod-2 fluorescence and Ca2+mito concentration because the almost proportional relation to Ca2+mito concentration of Hela cells was reported in the range that the intensity greatly changes (Collins et al. 2001). Similarly, the absolute value of ΔΨmito could not be obtained in this study. The values of K1/2 and ΔΨmito may be slightly different if accurate calibrations of Rhod-2 and TMRE signals are achieved, but our conclusion about the voltage-dependent and electrogenic property of NCXmito will be still valid. Our computer model is the first one that can well reproduce a wide range of experimental data of cardiac NCXmito, but has several limitations because of the lack of quantitative experimental data about NCXmito, such as the current–voltage relationship, affinities for Na+mito and Ca2+mito, and the stoichiometry. Further experimental studies are needed to refine the model.
In summary, the cardiac NCXmito is voltage dependent and electrogenic. The voltage- and Na+c-dependent natures of NCXmito dynamically modulate Ca2+mito concentration in the cardiac myocyte.
Acknowledgments
We are grateful to Professor Akinori Noma for his valuable support and advice. This study was supported by the Leading Project for Biosimulation and a Grant-in-Aid for Scientific Research from the Ministry of Education, Culture, Sports, Science and Technology of Japan (to S.M.) and COE Formation project for Genomic Analysis of Disease Model Animals with Multiple Genetic Alterations (to B.K.).
Appendix
A model of NCXmito
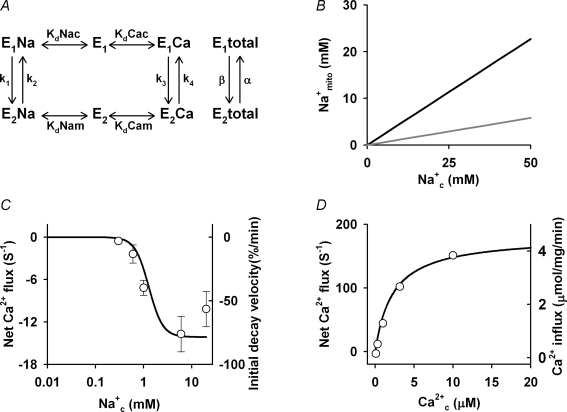
A computer model of NCXmito was constructed based on a general scheme proposed by Crompton et al. (1977) and a computer model of sarcolemmal 3Na+–1Ca2+ exchange (Powell et al. 1993) (Fig. 9). E1 and E2 are states that an ion binding site faces, cytoplasm and mitochondrial matrix, respectively. Instantaneous binding of Na+ and Ca2+ to the carrier was assumed and the probability of the ion-bound carrier in the E1 and E2 states was expressed as follows.
 |
Figure 9. Dependence of NCXmito model on Na+c and Ca2+c.
A, a scheme of NCXmito model. B, linear relations between Na+c and Na+mito at intact (grey) and depolarized (black) ΔΨmito reproduced from Jung et al. (1992). C, Na+c dependence of Ca2+ efflux via forward mode of NCXmito. The continous line is a model simulation (Na+mito= Na+c/8.6 mm, Ca2+mito= 300 nm, Ca2+c= 0 and ΔΨmito=−180 mV). Circles are experimental data from Fig. 4B in the present study. D, Ca2+c dependence of Ca2+ influx via reverse mode of NCXmito. The continous line is a model simulation (Na+mito= 25 mm, Na+c= 0, Ca2+mito= 0 and ΔΨmito= 0 mV). Circles are experimental data by Paucek & Jabůrek (2004).
The Na+-bound carrier was assumed to have one positive charge and rate constants (k1–k4) were expressed as follows.
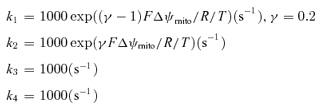 |
where F is Faraday's constant (96.4867 C mmol−1), R is the gas constant (8.3143 C mV K−1 mmol−1), and T is absolute temperature (310 K).
Steady state probability that the exchanger locates in E1 and E2 state P(E1total) and P(E2total) and net Ca2+ flux were calculated as below.
 |
Reversal potential of the NCXmito current, which can be calculated with the Na+ flux rate, should be the same as the equilibrium potential of 3Na+–1Ca2+ exchange (ENa/Ca).
This assumption yields a following constraint
The values of the dissociation constant were determined so as to fit experimental data and this constraint.
In the present experiments, Na+mito concentration might change when changing Na+c. Na+mito concentration was estimated by the linear relation between Na+c and Na+mito, which was obtained in isolated mitochondria by Jung et al. (1992); Na+c/Na+mito= 8.6 at intact ΔΨmito (grey line in Fig. 9B) and Na+c/Na+mito= 2.2 at depolarized ΔΨmito (black line in Fig. 9B).
Figure 9C and D demonstrates the Na+c dependence of the forward mode and the Ca2+c dependence of the reverse mode of NCXmito, respectively. Dissociation constants for Na+c and Ca2+c were determined to fit experimental data in Fig. 4B and data of Ca2+ and Na+ fluxes measurement from reconstructed beef heart NCXmito by Paucek & Jabůrek (2004). The Na+c dependence of Ca2+ efflux via forward mode NCXmito is also in agreement with the data of Paucek & Jabůrek (2004) under their experimental conditions (0 mV, 10 μm Ca2+mito, 0 Na+mito and 0 Ca2+c).
References
- Affolter H, Carafoli E. The Ca2+-Na+ antiporter of heart mitochondria operates electroneutrally. Biochem Biophys Res Commun. 1980;95:193–196. doi: 10.1016/0006-291x(80)90723-8. [DOI] [PubMed] [Google Scholar]
- Balaban RS. Cardiac energy metabolism homeostasis: role of cytosolic calcium. J Mol Cell Cardiol. 2002;34:1259–1271. doi: 10.1006/jmcc.2002.2082. [DOI] [PubMed] [Google Scholar]
- Baron S, Caplanusi A, van de Ven M, Radu M, Despa S, Lambrichts I, Ameloot M, Steels P, Smets I. Role of mitochondrial Na+ concentration, measured by CoroNa Red, in the protection of metabolically inhibited MDCK cells. J Am Soc Nephrol. 2005;16:3490–3497. doi: 10.1681/ASN.2005010075. [DOI] [PubMed] [Google Scholar]
- Bernardi P. Mitochondrial transport of cations: channels, exchangers, and permeability transition. Physiol Rev. 1999;79:1127–1155. doi: 10.1152/physrev.1999.79.4.1127. [DOI] [PubMed] [Google Scholar]
- Bernardinelli Y, Azarias G, Chatton JY. In situ fluorescence imaging of glutamate-evoked mitochondrial Na+ responses in astrocytes. Glia. 2006;54:460–470. doi: 10.1002/glia.20387. [DOI] [PubMed] [Google Scholar]
- Brand MD. The stoichiometry of the exchange catalysed by the mitochondrial calcium/sodium antiporter. Biochem J. 1985;229:161–166. doi: 10.1042/bj2290161. [DOI] [PMC free article] [PubMed] [Google Scholar]
- Brookes PS, Yoon Y, Robotham JL, Anders MW, Sheu SS. Calcium, ATP, and ROS: a mitochondrial love-hate triangle. Am J Physiol Cell Physiol. 2004;287:C817–C833. doi: 10.1152/ajpcell.00139.2004. [DOI] [PubMed] [Google Scholar]
- Carafoli E, Tiozzo R, Lugli G, Crovetti F, Kratzing C. The release of calcium from heart mitochondria by sodium. J Mol Cell Cardiol. 1974;6:361–371. doi: 10.1016/0022-2828(74)90077-7. [DOI] [PubMed] [Google Scholar]
- Cherednichenko G, Zima AV, Feng W, Schaefer S, Blatter LA, Pessah IN. NADH oxidase activity of rat cardiac sarcoplasmic reticulum regulates calcium-induced calcium release. Circ Res. 2004;94:478–486. doi: 10.1161/01.RES.0000115554.65513.7C. [DOI] [PubMed] [Google Scholar]
- Coll KE, Joseph SK, Corkey BE, Williamson JR. Determination of the matrix free Ca2+ concentration and kinetics of Ca2+ efflux in liver and heart mitochondria. J Biol Chem. 1982;257:8696–8704. [PubMed] [Google Scholar]
- Collins TJ, Lipp P, Berridge MJ, Bootman MD. Mitochondrial Ca2+ uptake depends on the spatial and temporal profile of cytosolic Ca2+ signals. J Biol Chem. 2001;276:26411–26420. doi: 10.1074/jbc.M101101200. [DOI] [PubMed] [Google Scholar]
- Cox DA, Conforti L, Sperelakis N, Matlib MA. Selectivity of inhibition of Na+-Ca2+ exchange of heart mitochondria by Benzothiazepine CGP-37157. J Cardivasc Pharmacol. 1993;21:595–599. doi: 10.1097/00005344-199304000-00013. [DOI] [PubMed] [Google Scholar]
- Crompton M, Capano M, Carafoli E. The sodium-induced efflux of calcium from heart mitochondria. Eur J Biochem. 1976;69:453–462. [Google Scholar]
- Crompton M, Knzi M, Carafoli E. The calcium-induced and sodium-induced effluxes of calcium from heart mitochondria. Eur J Biochem. 1977;79:549–558. doi: 10.1111/j.1432-1033.1977.tb11839.x. [DOI] [PubMed] [Google Scholar]
- Crompton M, Moser R, Rüdi H, Carafoli E. The interrelations between the transport of sodium and calcium in mitochondria of various mammalian tissues. Eur J Biochem. 1978;82:25–31. doi: 10.1111/j.1432-1033.1978.tb11993.x. [DOI] [PubMed] [Google Scholar]
- Fry CH, Powell T, Twist VW, Ward JPT. The effects of sodium, hydrogen and magnesium ions on mitochondrial calcium sequestration in adult rat ventricular myocytes. Proc R Soc Lond B Biol Sci. 1984;223:239–254. doi: 10.1098/rspb.1984.0092. [DOI] [PubMed] [Google Scholar]
- Griffiths EJ. Reversal of mitochondrial Na/Ca exchange during metabolic inhibition in rat cardiomyocytes. FEBS Lett. 1999;453:400–404. doi: 10.1016/s0014-5793(99)00726-7. [DOI] [PubMed] [Google Scholar]
- Gunter TE, Pfeiffer DR. Mechanisms by which mitochondria transport calcium. Am J Physiol Cell Physiol. 1990;258:C755–C786. doi: 10.1152/ajpcell.1990.258.5.C755. [DOI] [PubMed] [Google Scholar]
- Hajnoczky G, Csordas G, Das S, Garcia-Perez C, Saotome M, Sinha Roy S, Yi M. Mitochondrial calcium signaling and cell death: approaches for assessing the role of mitochondrial Ca2+ uptake in apoptosis. Cell Calcium. 2006;40:553–560. doi: 10.1016/j.ceca.2006.08.016. [DOI] [PMC free article] [PubMed] [Google Scholar]
- Hilgemann DW, Nicoll DA, Philipson KD. Charge movement during Na+ translocation by native and cloned cardiac Na+/Ca2+ exchanger. Nature. 1991;352:715–718. doi: 10.1038/352715a0. [DOI] [PubMed] [Google Scholar]
- Jo H, Noma A, Matsuoka S. Calcium-mediated coupling between mitochondrial substrate dehydrogenation and cardiac workload in single guinea-pig ventricular myocytes. J Mol Cell Cardiol. 2006;40:394–404. doi: 10.1016/j.yjmcc.2005.12.012. [DOI] [PubMed] [Google Scholar]
- Jung DW, Apel LM, Brierley GP. Transmembrane gradients of free Na+ in isolated heart mitochondria estimated using a fluorescent probe. Am J Physiol Cell Physiol. 1992;262:C1047–C1055. doi: 10.1152/ajpcell.1992.262.4.C1047. [DOI] [PubMed] [Google Scholar]
- Jung DW, Baysal K, Brierley GP. The sodium-calcium antiport of heart mitochondria is not electroneutral. J Biol Chem. 1995;270:672–678. doi: 10.1074/jbc.270.2.672. [DOI] [PubMed] [Google Scholar]
- Kirichok Y, Krapivinsky G, Clapham DE. The mitochondrial calcium uniporter is a highly selective ion channel. Nature. 2004;427:360–364. doi: 10.1038/nature02246. [DOI] [PubMed] [Google Scholar]
- Landolfi B, Curci S, Debellis L, Pozzan T, Hofer AM. Ca2+ homeostasis in the agonist-sensitive internal store: functional interactions between mitochondria and the ER measured in situ in intact cells. J Cell Biol. 1998;142:1235–1243. doi: 10.1083/jcb.142.5.1235. [DOI] [PMC free article] [PubMed] [Google Scholar]
- Lin X, Jo H, Sakakibara Y, Tambara K, Kim B, Komeda M, Matsuoka S. β-Adrenergic stimulation does not activate Na+/Ca2+ exchange current in guinea pig, mouse, and rat ventricular myocytes. Am J Physiol Cell Physiol. 2006;290:C601–C608. doi: 10.1152/ajpcell.00452.2005. [DOI] [PubMed] [Google Scholar]
- McCormack JG, Halestrap AP, Denton RM. Role of calcium ions in regulation of mammalian intramitochondrial metabolism. Physiol Rev. 1990;70:391–425. doi: 10.1152/physrev.1990.70.2.391. [DOI] [PubMed] [Google Scholar]
- McGuinness O, Yafel N, Costi A, Crompton M. The presence of two classes of high-affinity cyclosporin A binding sites in mitochondria. Eur J Biochem. 1990;194:671–679. doi: 10.1111/j.1432-1033.1990.tb15667.x. [DOI] [PubMed] [Google Scholar]
- Malli R, Frieden M, Osibow K, Zoratti C, Mayer M, Demaurex N, Graier WF. Sustained Ca2+ transfer across mitochondria is essential for mitochondrial Ca2+ buffering, store-operated Ca2+ entry, and Ca2+ store refilling. J Biol Chem. 2003;278:44769–44779. doi: 10.1074/jbc.M302511200. [DOI] [PubMed] [Google Scholar]
- Matsuoka S, Hilgemann DW. Steady-state and dynamic properties of cardiac sodium-calcium exchange. Ion and voltage dependencies of the transport cycle. J Gen Physiol. 1992;100:963–1001. doi: 10.1085/jgp.100.6.963. [DOI] [PMC free article] [PubMed] [Google Scholar]
- Matsuoka S, Jo H, Sarai N, Noma A. An in silico study of energy metabolism in cardiac excitation-contraction coupling. Jpn J Physiol. 2004;54:517–522. doi: 10.2170/jjphysiol.54.517. [DOI] [PubMed] [Google Scholar]
- Nicholls DG, Budd SL. Mitochondra and neuronal survival. Physiol Rev. 2000;80:315–360. doi: 10.1152/physrev.2000.80.1.315. [DOI] [PubMed] [Google Scholar]
- Niggli E, Lederer WJ. Molecular operations of the sodium-calcium exchanger revealed by conformation currents. Nature. 1991;349:621–624. doi: 10.1038/349621a0. [DOI] [PubMed] [Google Scholar]
- O'Reilly CM, Fogarty KE, Drummond RM, Tuft RA, Walsh JV., Jr Quantitative analysis of spontaneous mitochondrial depolarizations. Biophys J. 2003;85:3350–3357. doi: 10.1016/S0006-3495(03)74754-7. [DOI] [PMC free article] [PubMed] [Google Scholar]
- O'Rourke B. Mitochondrial ion channels. Annu Rev Physiol. 2007;69:19–49. doi: 10.1146/annurev.physiol.69.031905.163804. [DOI] [PMC free article] [PubMed] [Google Scholar]
- Patton C, Thompson S, Epel D. Some precautions in using chelators to buffer metals in biological solutions. Cell Calcium. 2004;35:427–431. doi: 10.1016/j.ceca.2003.10.006. [DOI] [PubMed] [Google Scholar]
- Paucek P, Jabůrek M. Kinetics and ion specificity of Na+/Ca2+ exchange mediated by the reconstituted beef heart mitochondrial Na+/Ca2+ antiporter. Biochim Biophys Acta. 2004;1659:83–91. doi: 10.1016/j.bbabio.2004.03.019. [DOI] [PubMed] [Google Scholar]
- Pierce GN, Czubryt MP. The contribution of ionic imbalance to ischemia/reperfusion-induced injury. J Mol Cell Cardiol. 1995;27:53–63. doi: 10.1016/s0022-2828(08)80007-7. [DOI] [PubMed] [Google Scholar]
- Piper HM, Meuter K, Schafer C. Cellular mechanisms of ischemia-reperfusion injury. Ann Thorac Surg. 2003;75:S644–S648. doi: 10.1016/s0003-4975(02)04686-6. [DOI] [PubMed] [Google Scholar]
- Powell T, Noma A, Shioya T, Kozlowski RZ. Turnover rate of the cardiac Na+-Ca2+ exchanger in guinea-pig ventricular myocytes. J Physiol. 1993;472:45–53. doi: 10.1113/jphysiol.1993.sp019935. [DOI] [PMC free article] [PubMed] [Google Scholar]
- Rottenberg H, Scarpa A. Calcium uptake and membrane potential in mitochondria. Biochemistry. 1974;13:4811–4817. doi: 10.1021/bi00720a020. [DOI] [PubMed] [Google Scholar]
- Saotome M, Katoh H, Satoh H, Nagasaka S, Yoshihara S, Terada H, Hayashi H. Mitochondrial membrane potential modulates regulation of mitochondrial Ca2+ in rat ventricular myocytes. Am J Physiol Heart Circ Physiol. 2005;288:H1820–H1828. doi: 10.1152/ajpheart.00589.2004. [DOI] [PubMed] [Google Scholar]
- Sato T, Saito T, Saegusa N, Nakaya H. Mitochondrial Ca2+-activated K+ channels in cardiac myocytes: a mechanism of the cardioprotective effect and modulation by protein kinase A. Circulation. 2005;111:198–203. doi: 10.1161/01.CIR.0000151099.15706.B1. [DOI] [PubMed] [Google Scholar]
- Sedova M, Blatter LA. Intracellular sodium modulates mitochondrial calcium signaling in vascular endothelial cells. J Biol Chem. 2000;275:35402–35407. doi: 10.1074/jbc.M006058200. [DOI] [PubMed] [Google Scholar]
- Shioya T. A simple technique for isolating healthy heart cells from mouse models. J Physiol Sci. 2007;57:327–335. doi: 10.2170/physiolsci.RP010107. [DOI] [PubMed] [Google Scholar]
- Smets I, Caplanusi A, Despa S, Molnar Z, Radu M, Vandeven M, Ameloot M, Steels P. Ca2+ uptake in mitochondria occurs via the reverse action of the Na+/Ca2+ exchanger in metabolically inhibited MDCK cells. Am J Physiol Renal Physiol. 2004;286:F784–F794. doi: 10.1152/ajprenal.00284.2003. [DOI] [PubMed] [Google Scholar]
- Takeo S, Tanonaka K. Na+ overload-induced mitochondrial damage in the ischemic heart. Can J Physiol Phamacol. 2004;82:1033–1043. doi: 10.1139/y04-124. [DOI] [PubMed] [Google Scholar]
- Territo PR, Mootha VK, French SA, Balaban RS. Ca2+ activation of heart mitochondrial oxidative phosphorylation: role of the F0/F1-ATPase. Am J Physiol Cell Physiol. 2000;278:C423–C435. doi: 10.1152/ajpcell.2000.278.2.C423. [DOI] [PubMed] [Google Scholar]
- Trolinger DR, Cascio WE, Lemasters JJ. Selective loading of Rhod-2 into mitochondria shows mitochondrial Ca2+ transients during the contractile cycle in adult rabbit cardiac myocytes. Biochem Biophys Res Commun. 1997;236:738–742. doi: 10.1006/bbrc.1997.7042. [DOI] [PubMed] [Google Scholar]
- Van Dyke RW, Steer CJ, Scharschmidt BF. Clathrin-coated vesicles from rat liver: Enzymatic profile and characterization of ATP-dependent proton transport. Proc Natl Acad Sci U S A. 1984;81:3108–3112. doi: 10.1073/pnas.81.10.3108. [DOI] [PMC free article] [PubMed] [Google Scholar]
- Weiss JN, Korge P, Honda HM, Ping P. Role of the mitochondrial permeability transition in myocardial disease. Circ Res. 2003;93:292–301. doi: 10.1161/01.RES.0000087542.26971.D4. [DOI] [PubMed] [Google Scholar]
- Wingrove DE, Gunter TE. Kinetics of mitochondrial calcium transport. II. A kinetic description of the sodium-dependent calcium efflux mechanism of liver mitochondria and inhibition by ruthenium red and by tetraphenylphosphonium. J Biol Chem. 1986;261:15166–15171. [PubMed] [Google Scholar]
- Yamamoto S, Matsui K, Kitano M, Ohashi N. SM-20550, a new Na+/H+ exchange inhibitor and its cardioprotective effect in ischemic/reperfused isolated rat hearts by preventing Ca2+-overload. J Cardiovasc Pharmacol. 2000;35:855–862. doi: 10.1097/00005344-200006000-00005. [DOI] [PubMed] [Google Scholar]


