Abstract
Failure of functional adaptation to protect the skeleton from damage is common and is often associated with targeted remodeling of bone microdamage. Horses provide a suitable model for studying loading-related skeletal disease because horses are physically active, their exercise is usually regulated, and adaptive failure of various skeletal sites is common. We performed a histologic study of the navicular bone of three groups of horses: (1) young racing Thoroughbreds (n = 10); (2) young unshod ponies (n = 10); and (3) older horses with navicular syndrome (n = 6). Navicular syndrome is a painful condition that is a common cause of lameness and is associated with extensive remodeling of the navicular bone; a sesamoid bone located within the hoof which articulates with the second and third phalanges dorsally. The following variables were quantified: volumetric bone mineral density; cortical thickness (Ct.Th); bone volume fraction, microcrack surface density; density of osteocytes and empty lacunae; and resorption space density. Birefringence of bone collagen was also determined using circularly polarized light microscopy and disruption of the lacunocanalicular network was examined using confocal microscopy. Remodeling of the navicular bone resulted in formation of transverse secondary osteons orientated in a lateral to medial direction; bone collagen was similarly orientated. In horses with navicular syndrome, remodeling often led to the formation of intracortical cysts and development of multiple tidemarks at the articular surface. These changes were associated with high microcrack surface density, low bone volume fraction, low density of osteocytes, and poor osteocyte connectivity. Empty lacunae were increased in Thoroughbreds. Resorption space density was not increased in horses with navicular syndrome. Taken together, these data suggest that the navicular bone may experience habitual bending across the sagittal plane. Consequences of cumulative cyclic loading in horses with navicular syndrome include arthritic degeneration of adjacent joints and adaptive failure of the navicular bone, with accumulation of microdamage and associated low bone mass, poor osteocyte connectivity, and low osteocyte density, but not formation of greater numbers of resorption spaces.
Keywords: functional adaptation, microdamage, osteocytes, targeted remodeling
Introduction
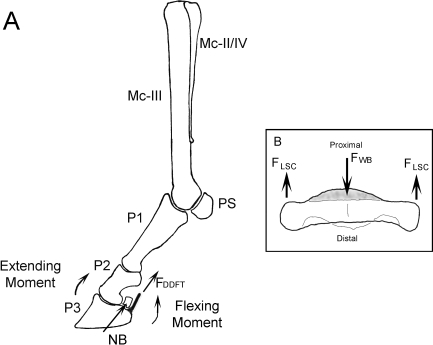
Navicular syndrome (NS) is a common cause of thoracic limb lameness in domesticated horses, which has been recognized clinically since the 18th century (Pool et al. 1989). NS is a collective term used to describe a range of pathologies of the foot associated with palmar foot pain and lameness, which is most commonly bilateral (Pool et al. 1989). Extensive remodeling of the navicular bone is a characteristic feature of advanced NS (Pool et al. 1989, Blunden et al. 2006). The navicular bone is a shuttle-shaped sesamoid bone, which has an articulation with both the middle and distal phalanges (Kainer, 1989) (Fig. 1). The long axis of the bone is transverse and the articular surface is proximal and dorsal (Kainer, 1989). The palmar distal (flexor) surface is covered with fibrocartilage, which provides a gliding surface for the deep digital flexor tendon (Kainer, 1989).
Fig. 1.
(A) Lateral view of the bones of the equine distal thoracic limb, with the moments arms around the distal interphalangeal joint during weight-bearing indicated. The extending moment is balanced by the force in the deep digital flexor tendon (FDDFT) (Wilson et al. 2001). Mc-III – Third metacarpal (cannon) bone; Mc-II/IV – second and fourth metacarpal (splint) bones; PS – proximal sesamoids; P1 – proximal phalanx; P2 – middle phalanx; P3 – distal phalanx; NB – navicular bone. (B) Oblique dorsal view of a navicular bone, indicating the hypothesized forces acting on the navicular bone during locomotion. The force of weight-bearing (FWB) on the articulation with the middle and distal phalanges is balanced by opposing forces in the ligamenta sesmoidea collateralia (FLSC).
Extensive functional adaptation of the navicular bone develops over time (Pool et al. 1989). Distal limb bones in the horse experience large cyclic loads, particularly during athletic activity (Nunamaker et al. 1990). Therefore mechanical loading of the navicular bone is probably influenced by several factors including the type of work performed by the horse and the use of metal shoes, which attenuate the viscoelastic composite of the tissues of the foot (Dyhre-Poulsen et al. 1994). Development of palmar foot pain and lameness is associated with excessive activation of remodeling in the cortex of the navicular bone, perforation of medullary trabeculae, focal osteolysis of the palmar cortex, loss of bone mass, and occasionally fracture (Ostblom et al. 1982; Wright et al. 1998).
Skeletal adaptation occurs during life and also during evolution in different species (Currey, 2003); the need for extreme athletic performance (Nunamaker et al. 1990) has been a key factor in the evolutionary development of the horse. While bones may be well adapted to cyclic loading associated with normal activity, accumulation and coalescence of microcracking may easily develop if cyclic loading is atypical and rapidly applied (Schaffler et al. 1989; Currey, 2003). Here, the usual management practices used for domesticated horses likely cause the loads experienced by the foot of the horse to often be atypical (Wright & Douglas, 1993). Any factor that negatively impacts the viscoelastic properties of the hoof composite would also likely increase the strain rate of loading applied to the navicular bone; here extensive remodeling of the navicular bone may represent adaptive failure (Pool et al. 1989; Wright & Douglas, 1993). Although activation of remodeling and loss of bone mass within the cortex of the navicular bone is considered important for the development of palmar foot pain and lameness, in horses with NS, the disease mechanism is not understood.
The purpose of the present study was to determine specific histologic features of the navicular bone of horses with clinical disease associated with development of excessive remodeling and loss of navicular bone mass. The osteocyte network within bone is an important mechanotransduction pathway and a normal population of osteocytes is considered necessary for bone to be healthy; numbers of osteocytes may be related to bone mass in human bone (Vashishth et al. 2002; Mullender et al. 2005). Osteocyte apoptosis at sites of microdamage is an important signal for targeted or site-specific remodeling (Verborgt et al. 2000; Noble et al. 2003); however, at least in the horse, intense site-specific remodeling is not necessarily associated with low numbers of osteocytes at skeletal sites that are exposed to large cyclic strains and contain diffuse microdamage (Da Costa Gómez et al. 2005). We hypothesized that development of extensive remodeling within the navicular bone would be associated with specific regional adaptive changes within the bone, including development of microdamage.
Methods
Horses
Left and right distal thoracic limbs were transected at the level of the carpus and stored at –20 °C after humane euthanasia had been performed for reasons unrelated to the present study. Pairs of navicular bones were collected from 3 groups of horses: (1) young Thoroughbred racehorses without navicular disease (n = 10); (2) young unshod ponies without navicular disease (n = 10); (3) older horses with NS; diagnosis was based on clinical signs of lameness, palmar foot pain, and pathological remodeling of the navicular bone seen radiographically. The group of racing Thoroughbreds was selected for two reasons: first to study a group of phenotypically similar young horses (mean ± SD 3.8 ± 1.6 years) in which functional adaptation of distal limb bone is pronounced (Nunamaker et al. 1989), and secondly to study a horse phenotype that has a high incidence of NS in the older animal (Wright et al. 1998). The group of young ponies was selected to study navicular adaptation in a group of unshod animals of a phenotype that is rarely affected with NS (mean ± SD age and weight were 3.6 ± 2.1 years and 147 ± 49 kg, respectively).
Specimen preparation and bone densitometry
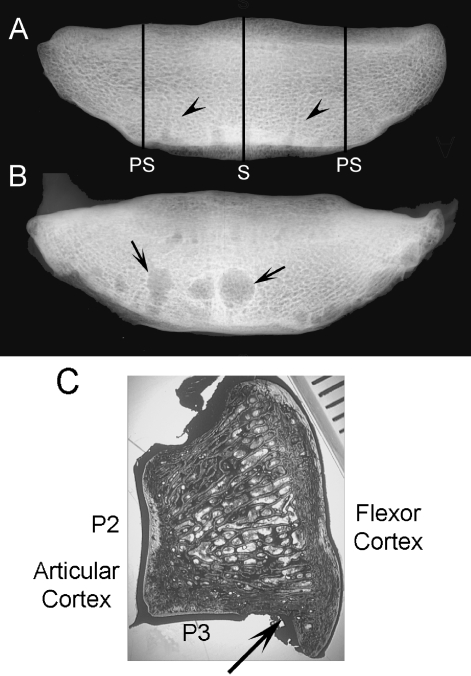
After thawing to room temperature, navicular bones were isolated, and fixed in 70% ethanol. High-detail dorsoproximal-palmardistal radiographs were made of racing Thoroughbred and pony bones to screen for any radiographic abnormality. Volumetric bone mineral density (vBMD, g cm−3) was determined in sagittal and parasagittal slices using a peripheral quantitative computed tomography scanner with a voxel size of 0.69 mm (Stratec XCT960, Orthometrix, White Plains, NY, USA) (Fig. 2). The location of these regions within the navicular bone was selected to correspond with the bone regions typically affected with pathological remodeling in diseased bones. One navicular bone of each pair was then randomly selected and sagittal and parasagittal segments 1 cm wide were excised, centered on the region of interest. Bone blocks were prepared with a band saw. The parasagittal segment was randomly chosen from the lateral or the medial region of the bone. The one-centimeter-wide bone segments were bulk-stained in 1% basic fuchsin in a graded series of ethanols (80%, 90%, 100%) for a total staining time of 18 days under a vacuum (20–40 mmHg) (Burr & Hooser 1995). This technique stains osteocyte lacunae and canaliculi and stains microcracks that existed before histologic sectioning, thus allowing them to be differentiated from unstained artifactual damage inducing during sectioning (Burr & Hooser 1995). After bone blocks were embedded in polymethylmethacrylate, calcified sagittal and parasagittal sections were prepared 125 µm thick using a Leica SP 1600 annular saw microtome (Leica Microsystems, Bannockburn, IL, USA). Therefore, sections corresponded to the regions used for vBMD determination and were prepared 5 mm from the cut edge of the bone.
Fig. 2.
Dorso-palmar radiographic view of isolated navicular bones from a 3-year-old male racing Thoroughbred (A) and a 19-year-old Paint horse with foot pain and lameness and pathological remodeling of the navicular bone for comparison (B). Cortical resorption (arrows) is co-localized with vascular foramina (arrow heads) located in the distal border of the navicular bone. PS – sites of the parasagittal section, S – site of the sagittal section. (C) Navicular bone section cut in the sagittal plane. Articulations with the second (P2) and third (P3) phalanges form a synovial joint. Just palmar to the synovial articulation with the third phalanx, is a groove in the distal border of the navicular bone (black arrow) containing the vascular foramina. Scale bar represents millimeters.
Histomorphometry
Sagittal and parasagittal navicular bone sections were divided into two regions: (1) the articular cortex underlying the synovial articulation with the middle and distal phalanx; and (2) the flexor cortex underlying the surface adjacent to the deep digital flexor. Morphometric analysis was performed using 200× and 400× magnification and image analysis software (Scion Corporation, Frederick, MD, USA). For each region of interest, the following features were studied: (1) cortical width; (2) bone volume fraction; (3) collagen orientation; (4) osteocyte density; (5) microcracking; and (6) remodeling. All data sets were collected by single observers. Large intracortical cysts in NS horses were excluded from the morphometric analyses.
Quantification of cortical thickness and bone mass
Using bright-field microscopy at 40×, mean cortical thickness (Ct.Th, mm) of the articular and flexor cortices was determined by measurement of cortical area and the width of the field. In addition, using 200× images, mean bone volume fraction (B.Ar/T.Ar, %) in each cortical region was also determined.
Orientation of bone collagen
Bone sections were examined at 200× using circularly polarized light (605229 RH, 605230 LH circularly polarizing light filters 3M Polaroid, Norwood, MA, USA) for birefringence and collagen orientation (Martin et al. 1996). Using image analysis software (Image J, NIH, Bethesda, MD, USA), birefringent images of secondary osteons were thresholded against the birefringence observable in the original color image, converted to a binary format, and the percentage of birefringent pixels was determined.
Microcrack quantification
Microcracks were defined as linear structures, with basic fuchsin staining around the cracks, and which were visible in difference planes through the depth of the section. Diffuse damage, represented by areas of diffuse staining of the matrix, was not quantified. Unstained cracks were considered processing artifact (Burr & Stafford 1990). Microcrack surface density was calculated as the product of microcrack density (Cr.Dn, # mm−2) and microcrack length (Cr.Le, µm) as an overall estimation of microcracking (Cr.S.Dn, µm mm−2). As microcracks were relatively rare events, data from sagittal and parasagittal sections were combined for each horse.
Quantification of osteocyte and resorption space density
Blue-violet epifluorescent light (425–440 excitation and 475 nm barrier filter) at 400× was used to count osteocytes, which are readily identified by fluorescence of the lacunar edges, the canaliculi, and the nucleus (Vashishth et al. 2000). Because this light only penetrates the first few microns of the section, osteocytes can be counted in a narrow plane within a thicker bone section, thereby minimizing counting error. Within the articular and flexor cortical regions, osteocyte density within mineralized tissue was determined (Ot.N/B.Ar, # mm−2). B.Ar, rather than T.Ar was used for this calculation to account for any variation in remodeling between groups of horses (Da Costa Gómez et al. 2005). The densities of empty lacunae (Em.Lc/B.Ar, # mm−2) and resorption spaces (Rs.N/T.Ar, # mm−2) were also determined.
Morphometry using confocal laser microscopy
Bone sections were also examined using confocal laser microscopy. Basic fuchsin fluoresces strongly in a krypton/argon laser with a 568 nm excitation and a 585 emission filter (Bio-Rad MRC-1024 Laser Scanning Confocal Microscope, Bio-Rad, Hercules, CA, USA). Osteocyte morphology can be observed because of fluorescence of basic fuchsin staining of non-mineralized matrix layer that lines lacunae and canaliculi, as well as direct staining of cell membranes. Loss of this osteocyte, lacunar, and canalicular staining is directly related to osteocyte disruption (Bentolila et al. 1998).
Representative Z-stack images consisting of 3 fields-of-view, 6 µm apart, were collected from the articular and flexor cortices using the confocal microscope via a 60× objective. Images were examined in a blinded fashion by an experienced observer (PM) and scored for diffuse matrix injury, as indicated by diffuse staining of the extracellular matrix, disruption of the network of osteocyte dendritic processes, and osteocyte disruption as indicated by loss of canalicular and osteocyte lacunar fluorescence (Colopy et al. 2004). The images were scored subjectively using a visual analogue scale. This scale used a 100 mm line, the end points of which were set by descriptors for normal bone (0) and bone exhibiting the most severe change in this study (100). Each image was assessed and the observer then marked a point on the line that best described the degree of change. Each observation was therefore assigned a score from 0 to 100 (Tomlin et al. 2000).
Statistical analysis
Data are presented as mean ± standard deviation. Repeated-measures ANOVA and a Bonferroni post-hoc t-test were used to determine the effect of group (ponies, racing Thoroughbreds, and horses with NS) and location within the navicular bone (parasagittal or sagittal) and cortical region-of-interest (articular or flexor cortex) on Ct.Th, B.Ar/T.Ar, percentage of bone matrix that was birefringent, Cr.S.Dn, Ot.N/B.Ar and Rs.N/T.Ar. The Kolmogorov-Smirnov test indicated that Cr.S.Dn and Em.Lc/B.Ar data were not normally distributed. Therefore, the Friedman and Kruskal Wallis ANOVA tests, and the Wilcoxon matched-pairs test were used for analysis of these variables. Visual analogue scale data were also analyzed using repeated-measures ANOVA and modeled as approximating a normal distribution (Colopy et al. 2004). Results were considered significant at P < 0.05.
Results
Navicular bone adaptation
Breeds of horse with NS were Thoroughbred (n = 3), Warmblood (n = 1), Paint (n = 1), Quarterhorse (n = 1); mean ± SD body weight and age were 536 ± 30 kg and 15.2 ± 4.2 years respectively. Development of typical large cystic lesions associated with synovial invaginations and vascular foramina was confirmed on radiographic examination of navicular bones from older horses with NS; similar lesions were not seen on radiographic views of navicular bones from younger Thoroughbreds and ponies (Fig. 2).
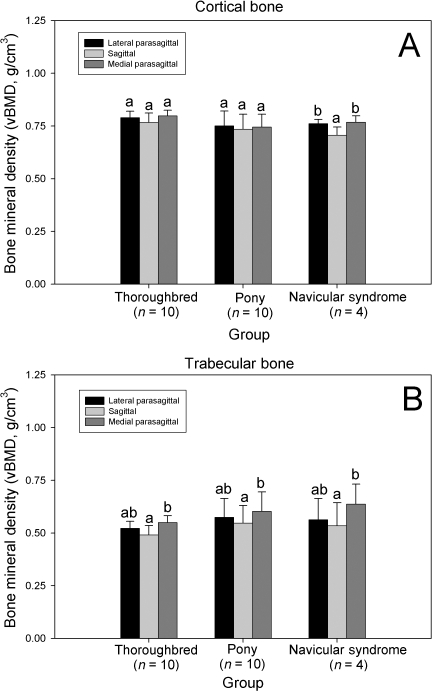
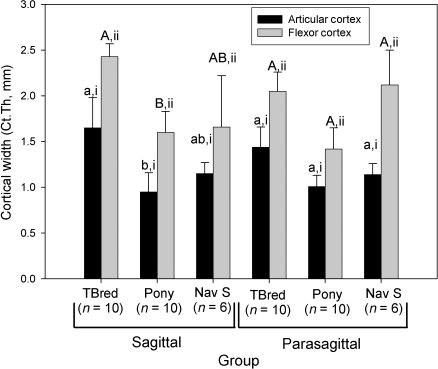
Regional changes in vBMD were found in horses with NS, but not racing Thoroughbreds or ponies. Cortical vBMD was significantly decreased in the sagittal slice, when compared with the lateral and medial parasagittal slices in this group (P < 0.05, Fig. 3). Trabecular vBMD was also significantly decreased in the sagittal slice, when compared with the medial parasagittal slice in all groups of horses (P < 0.05, Fig. 3). Ct.Th (P < 0.001) varied significantly between groups; overall, groups were significantly different from each other. This effect was most evident in sagittal sections. Ct.Th was greatest in the Thoroughbred group; the group of ponies had the smallest Ct.Th values. Ct.Th was increased in sagittal sections, when compared with parasagittal sections in the Thoroughbred group (P < 0.005). The flexor cortex was significantly thicker than the articular cortex of both the sagittal and parasagittal sections in all groups of horses (P < 0.001, Fig. 4).
Fig. 3.
Effect of bone region on navicular bone volumetric bone mineral density (vBMD) as determined by pQCT. (A) Cortical vBMD. (B) Trabecular vBMD. Within a group, columns with differing lower case letters are significantly different (P < 0.05). pQCT data were only available for bones from 4 NS horses.
Fig. 4.
Effect of horse group on navicular bone cortical thickness (Ct.Th). Within a group and section, columns with differing Roman numerals are significantly different (P < 0.05), and within a section and cortical region, groups with differing lower case (articular cortex) and upper case (flexor cortex) letters are significantly different (P < 0.05). TBred – Thoroughbred; Nav S – Horses with navicular syndrome.
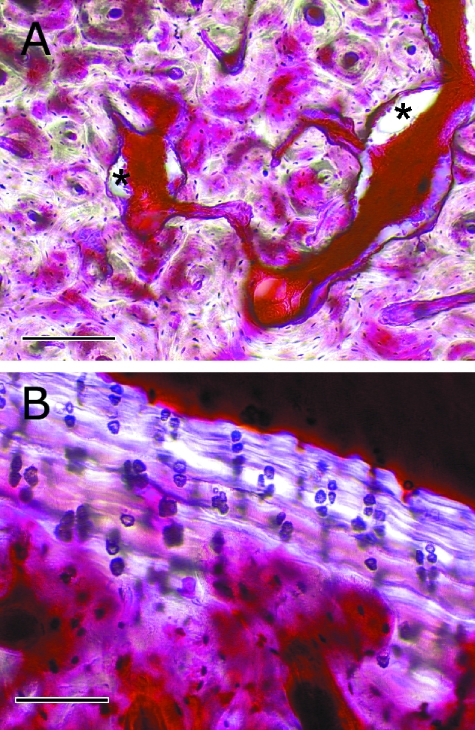
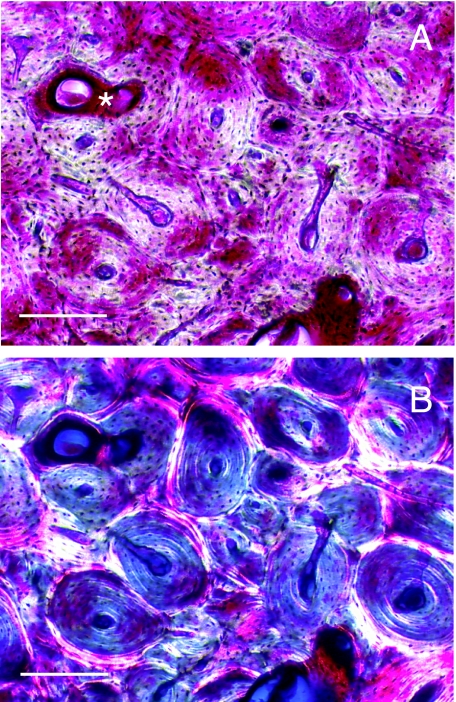
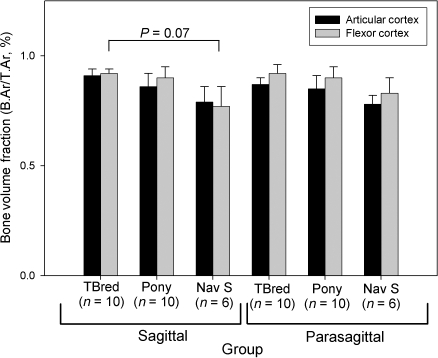
Microarchitecture of the cortices of the navicular bone was often poorly organized. Networks of large intracortical blood vessels were often associated with resorption spaces (Fig. 5). Furthermore, blood vessels that penetrated calcified cartilage were a prominent feature of all bones examined. Multiple tidemarks were also seen, particularly in navicular bones from NS horses (Fig. 5). Secondary osteons within the flexor cortex were orientated in a transverse lateral to medial direction (Fig. 6). Birefringence was not significantly different between groups (P = 0.12, Table 1). Overall, birefringence was increased in sagittal sections, when compared with parasagittal sections (P = 0.05). In the flexor cortex, birefringence was increased in the sagittal section, when compared to the parasagittal section (P < 0.005). Overall, B.Ar/T.Ar was significantly decreased in horses with NS, when compared with Thoroughbreds and ponies (P < 0.001, Fig. 7). In sagittal sections, B.Ar/T.Ar in articular and flexor cortices was not significantly different, whereas in parasagittal slices, B.Ar/T.Ar was increased in the flexor cortex, when compared with the articular cortex (P < 0.05). Overall, B.Ar/T.Ar was increased in the flexor cortex, when compared with the articular cortex (P < 0.001, Fig. 7).
Fig. 5.
(A) Photomicrograph of the flexor cortex of a navicular bone from a 14-year-old Warmblood horse with NS. Networks of large blood vessels within the cortex were often associated with resorption spaces (*). Cortical microarchitecture is disorganized, although some secondary osteonal remodeling was often seen. Uptake of basic fuchsin stain into the bone matrix is variable. In some areas, diffuse matrix staining is evident, suggesting diffuse microdamage. In other areas, little stain has been taken up into the bone matrix. Scale bar = 200 µm. (B) Photomicrograph of the articular cortex of a navicular bone from a 10-year-old Thoroughbred horse with NS. Multiple tidemarks can be seen within the calcified cartilage layer. Vascular penetration of calcified cartilage is also evident. Scale bar = 100 µm. Parasagittal calcified sections examined using bright-field microscopy after bulk-staining with basic fuchsin.
Fig. 6.
Photomicrographs of the flexor cortex of a sagittal calcified section of navicular bone from a 5-year-old Thoroughbred, bulk-stained with basic fuchsin. Using bright-field microscopy (A), extensive and active secondary osteonal remodeling can be seen. The star indicates a forming osteon running in a lateral to medial direction. When viewed using circularly polarized light (B), it can be seen that the interstitial bone is predominantly birefringent (bright) indicating that the bone collagen is oblique/transverse to the polarized light, whereas the secondary osteonal bone is not birefringent (dark), indicating that the bone collagen is parallel to the polarized light. Scale bar = 200 µm.
Table 1.
Influence of horse phenotype on cortical birefringence in the navicular bone
| Sagittal sections* | Parasagittal sections | |||
|---|---|---|---|---|
| Birefringence (%) | Articular cortex | Flexor cortex** | Articular cortex | Flexor cortex |
| Thoroughbreds (n = 10) | 29 ± 5 | 32 ± 7 | 27 ± 5 | 23 ± 5 |
| Ponies (n = 10) | 31 ± 6 | 36 ± 9 | 35 ± 8 | 31 ± 8 |
| NS Horses (n = 6) | 28 ± 6 | 31 ± 11 | 31 ± 7 | 27 ± 7 |
Mean ± standard deviation. Birefringence was not significantly different between groups (P = 0.12). Overall, birefringence was increased in sagittal sections
(P = 0.05), and in the flexor cortex of sagittal sections
(P < 0.005).
Fig. 7.
Effect of horse group on navicular bone tissue mass (B.Ar/T.Ar). Within a group and section, differences between articular and flexor cortices were not significant. Similarly, within a section and cortical region, differences between groups were not significant. TBred – Thoroughbred; Nav S – Horses with navicular syndrome.
Influence of animal phenotype on microcracking
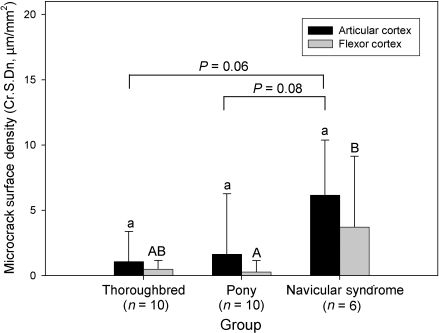
Overall, Cr.S.Dn was significantly influenced by horse phenotype (P < 0.05, Fig. 8); microcracking was increased in NS horses when compared with Thoroughbreds and ponies. Cr.S.Dn in the articular and flexor cortices was not significantly different.
Fig. 8.
Effect of horse group on microcrack surface density (Cr.S.Dn). Within a group, differences between articular and flexor cortices were not significant. Within a cortical region, groups with differing lower case (articular cortex) and upper case (flexor cortex) letters are significantly different (P < 0.05).
Influence of animal phenotype on osteocyte and resorption space density
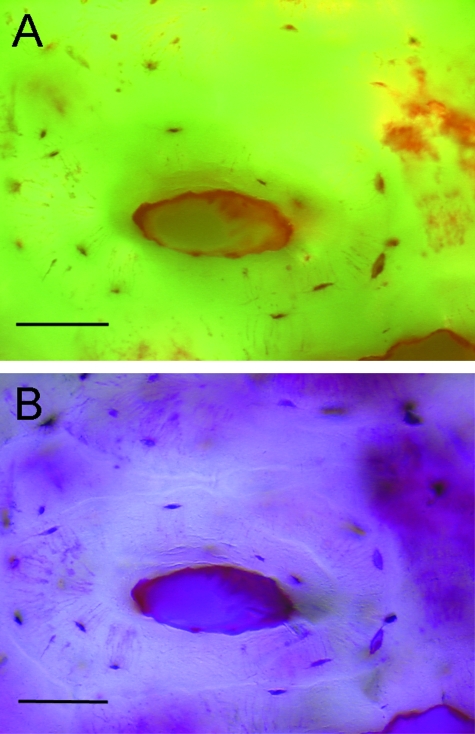
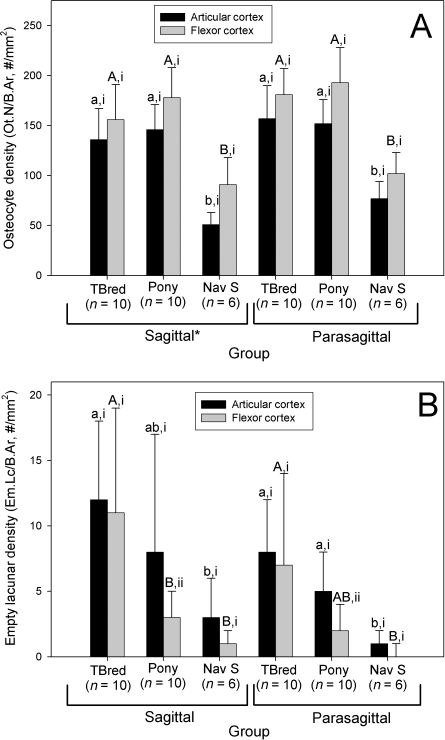
Ot.N/B.Ar densities ranged from 34 to 248 cells per square millimeter (Fig. 9). Ot.N/B.Ar was significantly influenced by horse phenotype; Ot.N/B.Ar was decreased in horses with NS, when compared with Thoroughbreds and ponies (P < 0.001, Fig. 10A). Low osteocyte densities were evident in the navicular bones from all three groups of horses. Micropetrosis was also prominent in horses with NS. Bone tissue affected with micropetrosis often exhibited poor uptake of basic fuchsin stain (Fig. 9). Low numbers of osteocytes were most evident in the bone of the subchondral plate immediately adjacent to the joint surface; here poor uptake of basic fuchsin stain into the matrix was particularly evident. Overall, Ot.N/B.Ar was decreased in sagittal sections, when compared with parasagittal sections (P < 0.01). Overall, Ot.N/B.Ar was also decreased in the articular cortex, when compared with the flexor cortex (P < 0.001). Em.Lc/B.Ar was significantly different between groups of horses (P < 0.05, Fig. 10B); Em.Lc/B.Ar was highest in the Thoroughbred group, and was lowest in the horses with NS. Empty lacunae were also most evident in the region of the subchondral plate adjacent to the joint surface. In the ponies, Em.Lc/B.Ar was increased in the articular cortex, when compared with the flexor cortex (P < 0.05). Em.Lc/B.Ar was not significantly different between sagittal and parasagittal slices in any group (P > 0.05).
Fig. 9.
Photomicrographs of a sagittal calcified section of navicular bone from a 17-year-old Thoroughbred with NS, bulk-stained with basic fuchsin. Using epifluorescent microscopy (A), loss of osteocytes and infilling of lost osteocyte lacunae (micropetrosis) was evident. When viewed using bright-field microscopy (B), micropetrotic bone matrix typically exhibited poor staining with basic fuchsin. Diffuse staining of the matrix, indicating diffuse microdamage was also often seen (arrows). Scale bar = 50 µm.
Fig. 10.
Effect of horse group on (A) navicular osteocyte density (Ot.N/B.Ar) and (B) empty lacunar density. Within a group and section, columns with differing Roman numerals are significantly different (P < 0.05), and within a section and cortical region, groups with differing lower case (articular cortex) and upper case (flexor cortex) letters are significantly different (P < 0.05). *Overall, in sagittal sections, Ot.N/B.Ar was decreased, when compared with parasagittal sections (P < 0.005). TBred – Thoroughbred; Nav S – Horses with navicular syndrome.
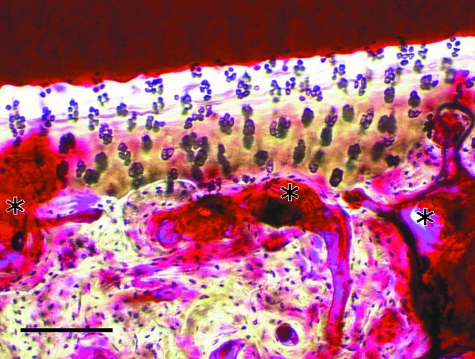
Rs.N/T.Ar was significantly influenced by horse phenotype (P < 0.005, Table 2); overall Rs.N/T.Ar was increased in ponies, when compared with Thoroughbreds. Rs.N/T.Ar in ponies was not significantly different from horses with NS (P = 0.08). Overall, Rs.N/T.Ar was increased in parasagittal sections, when compared to sagittal sections (P < 0.001). Clusters of resorption spaces were often found immediately adjacent to the joint surfaces (Fig. 11).
Table 2.
Influence of horse phenotype on formation of resorption spaces in the navicular bone
| Sagittal sections | Parasagittal sections* | |||
|---|---|---|---|---|
| Rs.N/T.Ar (# mm−2) | Articular cortex | Flexor cortex | Articular cortex | Flexor cortex |
| Thoroughbreds (n = 10) | 0.13 ± 0.07 | 0.10 ± 0.07 | 0.27 ± 0.16 | 0.49 ± 0.13 |
| Ponies (n = 10)** | 0.62 ± 0.37 | 0.37 ± 0.29 | 0.67 ± 0.42 | 0.85 ± 0.58* |
| NS Horses (n = 6) | 0.22 ± 0.17 | 0.36 ± 0.23 | 0.34 ± 0.32 | 0.47 ± 0.35 |
Mean ± standard deviation.
Rs.N/T.Ar is increased in parasagittal sections versus sagittal sections (P < 0.001).
Value is significantly different from Thoroughbreds (P < 0.005). Rs.N/T.Ar in ponies was not significantly different from NS horses (P = 0.08).
Rs.N/T.Ar – resorption space density.
Fig. 11.
Bright-field photomicrograph of the articular cortex of a parasagittal calcified section of navicular bone from a 19-year-old Paint horse with NS. Multiple resorption spaces (*) can be seen adjacent to the calcified cartilage layer. Resorption pits within the calcified cartilage are also evident. Scale bar = 200 µm. Bulk-stain with basic fuchsin.
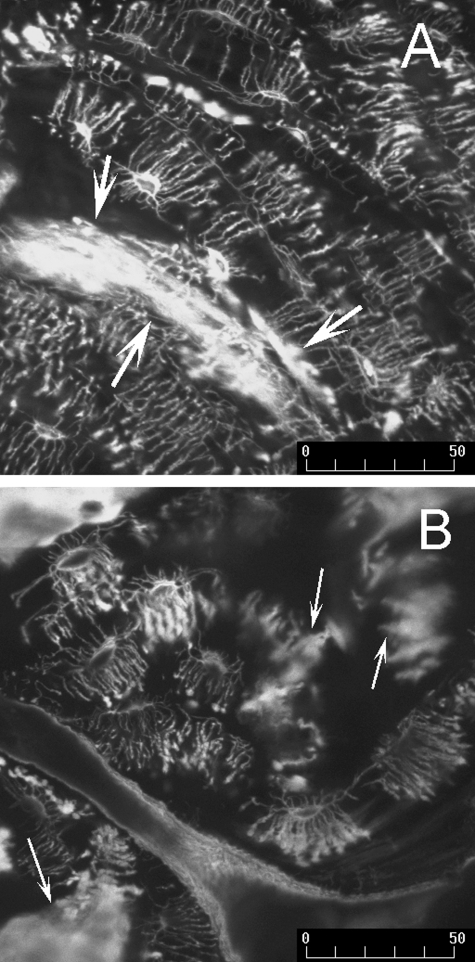
When viewed using confocal microscopy, bone sections from all groups of horses exhibited extensive disruption to the lacunocanalicular network of osteocytes (Table 3). The connectivity of the lacunocanalicular network was reduced in all bones, particularly bone tissue from horses with NS; in many instances osteocytes appeared isolated from other cells within the network (Fig. 12). Matrix injury, as indicated by the matrix staining severity score was greatest in ponies and was significantly increased, when compared with Thoroughbreds (P < 0.005, Fig 12); matrix staining in sections from ponies and horses with NS was not significantly different (P = 0.17). Disruption of the lacunocanalicular network, as indicated by the canalicular and lacunar staining severity scores, was increased in ponies and horses with NS, when compared with Thoroughbreds (P < 0.005, Fig. 12). Overall, disruption of the network of canaliculi was also increased in the articular cortex, when compared with the flexor cortex (P = 0.01).
Table 3.
Influence of horse phenotype on the disruption of the lacunocanalicular network of the navicular bone
| Sagittal sections | Parasagittal sections | |||
|---|---|---|---|---|
| Articular cortex | Flexor cortex | Articular cortex | Flexor cortex | |
| Matrix staining score | ||||
| Thoroughbreds (n = 10) | 42 ± 11 | 39 ± 18 | 43 ± 17 | 38 ± 15 |
| Ponies (n = 10)* | 54 ± 12 | 58 ± 9 | 60 ± 15 | 62 ± 16 |
| NS Horses (n = 6) | 49 ± 23 | 47 ± 16 | 46 ± 25 | 49 ± 22 |
| Canalicular disruption score | ||||
| Thoroughbreds (n = 10)** | 71 ± 8 | 62 ± 13 | 70 ± 12 | 63 ± 8 |
| Ponies (n = 10) | 78 ± 7 | 74 ± 7 | 79 ± 6 | 76 ± 9 |
| NS Horses (n = 6) | 74 ± 12 | 75 ± 7 | 85 ± 8 | 78 ± 4 |
| Osteocyte disruption score | ||||
| Thoroughbreds (n = 10)** | 77 ± 5 | 76 ± 12 | 79 ± 6 | 74 ± 8 |
| Ponies (n = 10) | 83 ± 5 | 83 ± 4 | 85 ± 3 | 84 ± 7 |
| NS Horses (n = 6) | 84 ± 6 | 81 ± 5 | 85 ± 8 | 83 ± 5 |
Mean ± standard deviation.
Overall, matrix staining was increased in ponies, when compared with Thoroughbreds (P < 0.005).
Overall, canalicular and osteocyte disruption was decreased in Thoroughbreds, when compared with ponies and horses with NS (P < 0.005).
Fig. 12.
Z-stack composite confocal photomicrographs of a sagittal calcified section of navicular bone from a 5-year-old racing Thoroughbred (A) and a parasagittal calcified section of navicular bone from a 20-year-old Quarterhorse with NS (B), bulk-stained with basic fuchsin. (A) The network of osteocytes retains some connectivity. Many canaliculi had blind-ending blebs of basic fuchsin staining, suggesting disruption of canaliculi and loss of osteocyte connectivity through rupture of dendritic processes. Diffuse microdamage is also evident through diffuse uptake of basic fuchsin into the bone matrix (arrows). (B) Loss of osteocytes and osteocyte connectivity was more pronounced in horses with NS. Multiple patches of diffuse matrix staining can also be seen (arrows), suggesting diffuse microdamage. Scale bar = 50 µm.
Discussion
Although several important skeletal diseases, such as osteoporosis and stress fracture are associated with failure of functional adaptation to maintain the skeleton in a healthy state (Burr et al. 1997), the specific reasons for development of adaptive failure over time are poorly understood. A normal population of osteocytes is considered a key component of healthy bone, with loss of osteocytes occurring in skeletal diseases such as osteoporosis (Mullender et al. 2005). However, low osteocyte densities have not consistently been found at high strain sites in the skeleton that, clinically, are predilection sites for adaptive failure and exercise-induced injury (Da Costa Gómez et al. 2005; Verheyen et al. 2006). In the present study we have utilized a common skeletal disease of the horse associated with bone-specific pathological remodeling and loss of bone mass as a model of adaptive failure and obtained new morphologic data on key variables influenced by functional adaptation.
Little is known about the mechanical environment the navicular bone is typically exposed to. In the present study, we found osteonal remodeling led to the formation of transverse secondary osteons orientated in a lateral to medial direction and reorientation of bone collagen. This suggests the navicular bone may predominantly experience loading in bending during life. However, the lack of significant differences in predominant collagen fiber orientation between articular and flexor cortices suggests that habitual loading may be complex, or that osteon and collagen fiber organization is not indicative of loading history in this particular bone, perhaps because of ligament attachments to a sesamoid bone.
We found decreased vBMD in sagittal slices in NS horses, when compared with parasagittal slices; this may suggest that cyclic strains are greatest in the sagittal part of the bone. Thoroughbred horses in race training have low skeletal safety margins (Verheyen et al. 2006) and experience extensive adaptation of distal limb bone (Nunamaker et al. 1989; Da Costa Gómez et al. 2005). The adaptive response to training may explain the increase in Ct.Th that was evident in the sagittal region of the navicular bone only in this type of horse, when compared with parasagittal slice.
In the present study, fatigue damage to the navicular bone was most evident in older horses with NS, suggesting that over time the navicular bones of these horses are exposed to increased cyclic loading; here we hypothesize that the use of metal shoes is a key factor leading to accumulation of microdamage in the navicular bone. If such a hypothesis were true, it might be expected that horses that have never worn metal shoes would have reduced amounts of navicular microdamage and that a relationship might exist between exercise history and navicular microdamage in athletic horses that wear shoes.
Overall, bone mass (B.Ar/T.Ar) was decreased in horses with NS when compared with the other groups of horses; we also found an associated decrease in Ot.N/B.Ar. Micropetrosis was also evident, suggesting that loss of osteocytes had occurred over an extended period of time in this group of horses in particular. However, low osteocyte densities were found in all three groups of horses. This pathological change was associated with extensive disruption of the lacunocanalicular connections in the osteocyte network. Loss of osteocytes was most pronounced in the sagittal region of the bone, which may experience the greatest cyclic strains during locomotion. Em.Lc/B.Ar was highest in the group of racing Thoroughbreds, suggesting that recent loss of osteocytes was associated with concurrent athletic activity. Rs.N/T.Ar was highest in ponies and lowest in the TB group; formation of resorption spaces was most evident in the flexor cortex of parasagittal sections. Diffuse matrix injury,which was particularly evident in ponies, may help to explain why formation of resorption spaces was most prevalent in this group of horses. However the four factors of microdamage accumulation, low bone mass, poor osteocyte connectivity, and very low osteocyte densities were only found in the navicular bones of older horses with NS. Large numbers of resorption spaces, which are likely targeted at matrix microdamage repair, may not necessarily be associated with uncoupled pathological remodeling and loss of bone mass; this finding mirrors our earlier study of the dorsal cortex of the third metacarpal/metatarsal bone in racing Thoroughbred horses (Da Costa Gómez et al. 2005). Therefore, the key factors that promote formation of large intracortical cysts, which were only seen in NS horses remain unclear; we hypothesize that development of this pathology may be associated with a chronic increase in blood flow to the bone over time.
Multiple tidemarks were particularly evident in the bones of horses with NS, suggesting active functional adaptation of the joint surfaces of the navicular bone has occurred over time (Muir et al. 2006). Vascular penetration of the tidemark and the formation of resorption pits within calcified cartilage were also common; development of this pathology is likely associated with bone pain (Shibakawa et al. 2005; Ogino et al. 2007). Ot.N/B.Ar was decreased in the articular cortex, when compared with the flexor cortex; loss of osteocytes, the presence of empty lacunae, and disruption of the lacunocanalicular network were also most evident in the bone of the subchondral plate immediately adjacent to the joint surface. These findings suggest that habitual cyclic loading of the distal interphalangeal joint and the navicular bone in horses with NS also promotes arthritic degeneration of adjacent joints.
Important limitations of this study were that we were only able to study relatively small numbers of diseased bones. At least three biologically important variables may influence development of the navicular morphology we found in horses with NS; NS status, horse age, horse phenotype/management. However, we consider our data adequate for the purposes of the present study, which was to obtain detailed knowledge of navicular bone morphology in horses with NS. Examination of additional navicular bones from age- and breed-matched horses will be necessary to understand specific phenotype and aging effects on navicular morphology. Examination of bones from Thoroughbred-type horses that had never worn shoes would also further understanding of whether use of metal shoes may be an important management factor promoting failure of navicular adaptation over time. Pathological changes to bone tissue suggest that poor interstitial fluid flow (Muir et al. 2007) may be present within the navicular bone, although this was not studied. Tracer studies with the fluorochrome procion red may further understanding of how loading of the navicular bone influences bone fluid flow; recent data suggests that cyclic fatigue loading induces increased bone blood flow, but decreased interstitial fluid flow (Muir et al. 2007). Examination of additional bones from horses with NS, in which clinical disease severity was more comprehensively assessed may also facilitate determination of which histological features most closely correlate with development of foot pain.
In conclusion, our data suggest that in older horses with NS, habitual cyclic fatigue loading associated with bending of the navicular bone across the sagittal plane promotes adaptive failure, accumulation of microdamage, loss of bone mass, disruption of osteocyte connectivity, and eventually very low numbers of osteocytes; formation of increased numbers of resorption spaces were not a key factor associated with NS bones, although formation of large intracortical cysts was only found in diseased bones. We currently hypothesize that poor interstitial fluid flow within the navicular bone and progressive disruption of osteocyte dendritic processes may both be important factors that promote osteocyte death in this equine bone model of adaptive failure.
Acknowledgments
This work was supported by a grant from the AO VET Center, Switzerland.
References
- Bentolila V, Boyce TM, Fyhrie DP, Drumb R, Skerry TM, Schaffler MB. Intracortical remodeling in adult rat long bones after fatigue loading. Bone. 1998;23:275–281. doi: 10.1016/s8756-3282(98)00104-5. [DOI] [PubMed] [Google Scholar]
- Blunden A, Dyson S, Murray R, Scramme M. Histopathology in horses with chronic palmar foot pain and age-matched controls. Part 1: Navicular bone and related structures. Equine Vet J. 2006;38:15–22. doi: 10.2746/042516406775374298. [DOI] [PubMed] [Google Scholar]
- Burr DB, Forwood MR, Fyhrie DP, Martin RB, Schaffler MB, Turner CH. Bone microdamage and skeletal fragility in osteoporotic and stress fractures. J Bone Miner Res. 1997;12:6–15. doi: 10.1359/jbmr.1997.12.1.6. [DOI] [PubMed] [Google Scholar]
- Burr DB, Hooser M. Alterations to the en bloc basic fuchsin staining protocol for the demonstration of microdamage produced in vivo. Bone. 1995;17:431–433. doi: 10.1016/s8756-3282(95)00241-3. [DOI] [PubMed] [Google Scholar]
- Burr DB, Stafford T. Validity of the bulk-staining technique to separate artifactual from in vivo bone microdamage. Clin Orthop Rel Res. 1990;260:305–308. [PubMed] [Google Scholar]
- Colopy SA, Benz-Dean J, Barrett JG, et al. Response of the osteocyte syncytium adjacent to and distant from linear microcracks during adaptation to cyclic fatigue loading. Bone. 2004;35:881–891. doi: 10.1016/j.bone.2004.05.024. [DOI] [PubMed] [Google Scholar]
- Currey JD. How well are bones designed to resist fracture? J Bone Miner Res. 2003;18:591–598. doi: 10.1359/jbmr.2003.18.4.591. [DOI] [PubMed] [Google Scholar]
- Da Costa Gómez TM, Barrett JG, Sample SJ, et al. Up-regulation of site-specific remodeling without accumulation of microcracking and loss of osteocytes. Bone. 2005;37:16–24. doi: 10.1016/j.bone.2004.12.016. [DOI] [PubMed] [Google Scholar]
- Dyhre-Poulsen P, Smedegaard HH, Roed J, Korsgaard E. Equine hoof function investigated by pressure transducers inside the hoof and accelerometers mounted on the first phalanx. Equine Vet J. 1994;26:362–366. doi: 10.1111/j.2042-3306.1994.tb04404.x. [DOI] [PubMed] [Google Scholar]
- Kainer RA. Clinical anatomy of the equine foot. Vet Clin N Am: Equine Pract. 1989;5:1–27. doi: 10.1016/s0749-0739(17)30601-6. [DOI] [PubMed] [Google Scholar]
- Martin RB, Gibson VA, Stover SM, Gibeling JC, Griffin LV. Osteonal structure in the equine third metacarpus. Bone. 1996;19:165–171. doi: 10.1016/8756-3282(96)00167-6. [DOI] [PubMed] [Google Scholar]
- Muir P, McCarthy J, Radtke CL, et al. Role of endochondral ossification of articular cartilage and functional adaptation of the subchondral plate in the development of fatigue microcracking of joints. Bone. 2006;38:342–349. doi: 10.1016/j.bone.2005.08.020. [DOI] [PubMed] [Google Scholar]
- Muir P, Sample SJ, Barrett JG, et al. Effect of fatigue loading and associated matrix microdamage on bone blood flow and interstitial fluid flow. Bone. 2007;40:948–956. doi: 10.1016/j.bone.2006.11.012. [DOI] [PubMed] [Google Scholar]
- Mullender MG, Tan SD, Vico L, Alexandre C, Klein-Nulend J. Differences in osteocyte density and bone histomorphometry between men and women and between healthy and osteoporotic subjects. Calcif Tissue Int. 2005;77:291–296. doi: 10.1007/s00223-005-0043-6. [DOI] [PubMed] [Google Scholar]
- Noble BS, Peet N, Stevens HY, et al. Mechanical loading: biphasic osteocyte survival and targeted of osteoclasts for bone destruction in rat cortical bone. Am J Physiol Cell Physiol. 2003;284:C934–C943. doi: 10.1152/ajpcell.00234.2002. [DOI] [PubMed] [Google Scholar]
- Nunamaker DM, Butterweck DM, Provost MT. Some geometric properties of the third metacarpal bone: a comparison between the thoroughbred and standardbred racehorse. J Biomech. 1989;22:129–134. doi: 10.1016/0021-9290(89)90035-3. [DOI] [PubMed] [Google Scholar]
- Nunamaker DM, Butterweck DM, Provost MT. Fatigue fracture in thoroughbred racehorses: relationships with age, peak bone strain, and training. J Orthop Res. 1990;8:604–611. doi: 10.1002/jor.1100080417. [DOI] [PubMed] [Google Scholar]
- Ogino S, Sasho T, Suzuki M, et al. Origin of osteoarthritic knee pain: immunohistochemical analysis of subchondral bone – second report. Trans Orthop Res Soc. 2007;53:0134. [Google Scholar]
- Ostblom L, Lund C, Melsen F. Histological study of navicular bone disease. Equine Vet J. 1982;14:199–202. doi: 10.1111/j.2042-3306.1982.tb02391.x. [DOI] [PubMed] [Google Scholar]
- Pool RR, Meagher DM, Stover SM. Pathophysiology of navicular syndrome. Vet Clin N Am: Equine Pract. 1989;5:109–129. doi: 10.1016/s0749-0739(17)30606-5. [DOI] [PubMed] [Google Scholar]
- Schaffler MB, Radin EL, Burr DB. Mechanical and morphological effects of strain rate on fatigue of compact bone. Bone. 1989;10:207–214. doi: 10.1016/8756-3282(89)90055-0. [DOI] [PubMed] [Google Scholar]
- Shibakawa A, Yudoh K, Masuko-Hongo K, Kato T, Nishioka K, Nakamura H. The role of subchondral bone resorption pits in osteoarthritis: MMP production by cells derived from bone marrow. Osteoarthritis Cartilage. 2005;13:679–687. doi: 10.1016/j.joca.2005.04.010. [DOI] [PubMed] [Google Scholar]
- Tomlin JL, Lawes TJ, Blunn GW, Goodship AE, Muir P. Fractographic examination of racing greyhound central tarsal bone failure surfaces using scanning electron microscopy. Calcif Tissue Int. 2000;67:260–266. doi: 10.1007/s002230001129. [DOI] [PubMed] [Google Scholar]
- Vashishth D, Gibson G, Kimura J, Schaffler MB, Fyhrie DP. Determination of bone volume by osteocyte population. Anat Rec. 2002;267:292–295. doi: 10.1002/ar.10114. [DOI] [PubMed] [Google Scholar]
- Vashishth D, Verborgt O, Divine G, Schaffler MB, Fyhrie DP. Decline in osteocyte lacunar density in human cortical bone is associated with accumulation of microcracks with age. Bone. 2000;26:375–380. doi: 10.1016/S8756-3282(00)00236-2. [DOI] [PubMed] [Google Scholar]
- Verborgt O, Gibson GJ, Schaffler MB. Loss of osteocyte integrity in association with microdamage and bone remodeling after fatigue in vivo. J Bone Miner Res. 2000;15:60–67. doi: 10.1359/jbmr.2000.15.1.60. [DOI] [PubMed] [Google Scholar]
- Verheyen K, Price J, Lanyon L, Wood J. Exercise distance and speed affect the risk of fracture in racehorses. Bone. 2006;39:1322–1330. doi: 10.1016/j.bone.2006.05.025. [DOI] [PubMed] [Google Scholar]
- Wilson AM, McGuigan MP, Fouracre L, MacMahon L. The force and contact stress on the navicular bone during trot locomotion in sound horses and horses with navicular disease. Equine Vet J. 2001;33:159–165. doi: 10.1111/j.2042-3306.2001.tb00594.x. [DOI] [PubMed] [Google Scholar]
- Wright IM, Douglas J. Biomechanical considerations in the treatment of navicular disease. Vet Rec. 1993;133:109–114. doi: 10.1136/vr.133.5.109. [DOI] [PubMed] [Google Scholar]
- Wright IM, Kidd L, Thorp BH. Gross, histological and histomorphometric features of the navicular bone and related structures in the horse. Equine Vet J. 1998;30:220–234. doi: 10.1111/j.2042-3306.1998.tb04491.x. [DOI] [PubMed] [Google Scholar]


