Abstract
Both Asian (Elephas maximus) and African (Loxodonta africana) elephants produce low-frequency, high-amplitude rumbles that travel well through the ground as seismic waves, and field studies have shown that elephants may utilize these seismic signals as one form of communication. Unique elephant postures observed in field studies suggest that the elephants use their feet to ‘listen’ to these seismic signals, but the exact sensory mechanisms used by the elephant have never been characterized.
The distribution, morphology and tissue density of Pacinian corpuscles, specialized mechanoreceptors, were studied in a forefoot and hindfoot of Asian elephants. Pacinian corpuscles were located in the dermis and distal digital cushion and were most densely localized to the anterior, posterior, medial and lateral region of each foot, with the highest numbers in the anterior region of the forefoot (52.19%) and the posterior region of the hindfoot (47.09%). Pacinian corpuscles were encapsulated, had a typical lamellar structure and were most often observed in large clusters. Three-dimensional reconstruction through serial sections of the dermis revealed that individual Pacinian corpuscles may be part of a cluster. By studying the distribution and density of these mechanoreceptors, we propose that Pacinian corpuscles are one possible anatomic mechanism used by elephants to detect seismic waves.
Keywords: elephant communication, elephant foot, Pacinian corpuscle, seismic waves
Introduction
Low-frequency vocalizations play an important role in both African (Loxodonta africana) and Asian (Elephas maximus) elephant long distance communication (Payne et al. 1986; O'Connell-Rodwell et al. 2000, 2001, 2006; McComb et al. 2003). Both African and Asian elephant high-amplitude low-frequency vocalizations in the range of 20–40 Hz travel through the air as acoustic waves and also propagate through the ground as seismic waves (Heffner & Heffner, 1982; Payne et al. 1986; Poole et al. 1988; Langbauer et al. 1991; O'Connell-Rodwell et al. 2000; Gunther et al. 2004). The ability to detect seismic waves may provide elephants with an increased range of communication in dense forests, with distant herd members, or the ability to detect underground water sources, the footfalls of other elephants (O'Connell-Rodwell et al. 2000; Wood et al. 2005) or environmentally generated seismic activity. When responding to specific seismic cues (O'Connell-Rodwell et al. 2006), African elephants display certain non-random ‘listening’ behaviors and postures that strongly indicate that the feet play a crucial role in detecting these signals. However, the actual means by which these signals are detected and the anatomic structures utilized by the elephants are unknown.
Pacinian corpuscles (PCs, also known as Vater-Pacinian corpuscles) are rapidly-adapting, encapsulated, primary mechanoreceptors known to respond to mechanical deformation and vibratory stimuli (Bell et al. 1994). The literature contains several detailed descriptions of the distribution of PCs in various mammalian tactile organs including the human and non-human primate hand (Kumamoto et al. 1993; Stark et al. 1998; Pare et al. 2002), raccoon and mouse paws (Ide, 1976; Rice & Rasmusson, 2000), dog forefoot pads (Rico et al. 1996), elephant trunk tip (Rasmussen & Munger, 1996) and elephant tongue (Kubota, 2005). Though PCs have been found in the African elephant foot within both the dermis and digital cushions (Weissengruber et al. 2006), the morphology, density and distribution of PCs have not previously been described in detail, nor have PCs been documented in the Asian elephant foot.
Peak sensitivity of human PCs is 250 Hz (Bell et al. 1994); however, studies have shown PC sensitivity ranges from 10–1000 Hz (Bolanowski & Zwislocki, 1984; Brisben et al. 1999). The actual PC sensitivity in elephants has not been documented. However, since elephant rumbles in the 20–40 Hz range can be detected by elephants in both the air and ground, we hypothesize that PCs in the foot provide one mechanism for detecting low-frequency seismic waves. In this study, we describe the density and predominant regional distribution of PCs within the Asian elephant foot, and propose that typical ‘listening’ postures seen in elephants detecting seismic cues may occur in part to facilitate PC stimulation and function.
Materials and methods
Samples of preserved elephant feet
Asian elephant foot specimens (see Table 1) were provided by one of our authors (TH) at the Leibniz-Institute for Zoo and Wildlife Research (IZW), Berlin, Germany. Specimens 2 and 3 had been frozen, quartered along the sagittal plane, and then placed in a minimal amount of 10% buffered neutral formalin (10% BNF) for several years until this study was conducted. Specimens 1 and 4 were routinely fixed in 10% BNF.
Table 1.
Elephant tissues used for histological analyses
| Specimen | Sample provided | Source | Analysis performed |
|---|---|---|---|
| 1 | Sagittal slice through middle of left forefoot | 46-year old female Asian elephant | Preliminary histological evaluation |
| 2 | Entire right forefoot | Same animal as specimen 1 | Distribution and density studies |
| 3 | Entire right hindfoot | 38-year old female Asian elephant | Distribution and density studies |
| 4 | Sagittal slice through foot* | Stillborn Asian elephant calf | 3D analysis of PC cluster |
No more information was available for this specimen.
Preparation of tissue and processing for histopathology
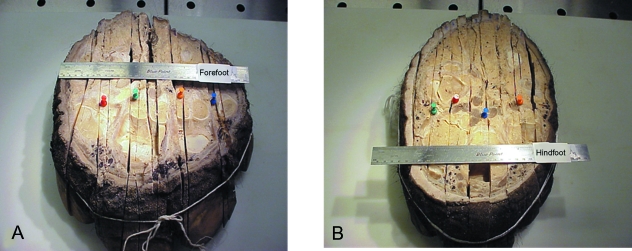
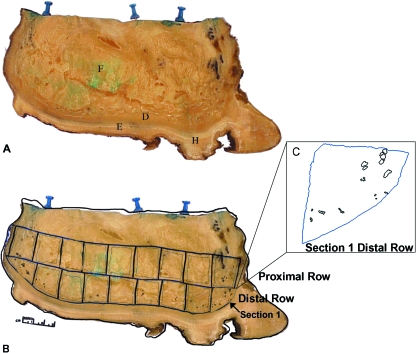
Additional 1-cm-thick sagittal sections (Fig. 1) were made adjacent to the original cuts through specimens 2 and 3 using a band saw and dimensions (height, length, width and perimeter) of each foot were recorded (data not shown). Because of the massive size of these feet, we elected to analyze four representative slices from each foot (see Fig. 1). A side view of slice 1 is shown in Fig. 2A.
Fig. 1.
Asian elephant foot specimens. The forefoot (A), which supports the majority of the elephant's weight, has a more rounded profile and larger circumference compared to the more mediolaterally compressed hindfoot (B). The front of each foot is oriented toward the bottom of the figure. Colored pins designate the slices examined histologically. Forefoot (A): blue pin = slice 1, medial aspect of the 2nd digit; orange pin = slice 2, lateral aspect of the 2nd digit; green pin = slice 3, through and beneath the 3rd digit; and red pin = slice 4, through and beneath the 4th digit. Hindfoot (B): orange pin = slice 5, through and beneath the 2nd digit; blue pin = slice 6, through and beneath the 3rd digit; red pin = slice 7, through and beneath the 4th digit; and green pin = slice 8, between the 4th and 5th digits.
Fig. 2.
Representative slice through the elephant foot, delineating the areas used for histological analysis. The anterior of the foot is to the right of the image. (A) Slice 1, the medial-most slice taken from the forefoot. F = digital cushion, D = dermis, E = epidermis/sole skin, H = dense horny tissue. (B) Slice 1 overlaid with the tracings of the sections sampled for histology (bold outlines), as well as the tracings performed using the Stereo Investigator software (thin lines). (C) An enlargement of section 1 from the distal row, showing the tracings of individual and clusters of PCs.
Each individual slice was measured, photographed, and traced onto an overhead transparency. The dense horny tissue which comprises the very distal part of the epidermis/sole on the bottom of each slice was removed for ease of histological preparation. Preliminary histological evaluation by our group in specimen 1 detected PCs in the dermis (dense connective tissue proximal to the epidermis/sole) and in the distal digital cushion (Weissengruber et al. 2006). Therefore, we focused our study on this region of the foot (approximately 6 cm above the sole) and subdivided it into proximal and distal rows. Each row of tissue was further subdivided into sections that fit standard histology cassettes (2.5 cm × 3 cm), numbered in order from anterior to posterior, and traced onto an overhead transparency. The forefoot and hindfoot together yielded a total of 196 sections for the distribution analysis.
Tissues were routinely processed, embedded in paraffin, cut at 4-µm thickness, mounted on glass slides and stained with Hematoxylin and Eosin (H&E). Processing resulted in approximately 18% tissue shrinkage (data not shown).
Analysis of PCs
Two-dimensional (2D) analysis was performed on a total of 196 tissue sections from the forefoot and hindfoot combined. Histology of tissue sections was viewed using the 10× objective on a microscope (Zeiss, Oberkochen, Germany) equipped with a motorized stage (Ludl Electronic Products, Hawthorne, NY, USA). All tissue sections and PCs were digitally traced using Stereo Investigator software (MicroBrightField Inc., Colchester, VT, USA). PCs were identified based on appropriate morphology (a central neurite surrounded by concentric non-neural lamellae, with a distinct dense connective tissue outer capsule) (Bell et al. 1994), and the outline of each PC was traced to form a closed contour. The outline of each tissue section on a slide was also traced as a closed contour in order to obtain the area. Using these data, we calculated the density of PCs (number of PCs per mm2 of tissue). A composite image that shows each tissue section tracing and PCs within that section was overlaid onto the gross picture of the foot slice (Fig. 2B).
Data obtained from contours traced in Stereo Investigator were analyzed using NeuroExplorer (data analysis) software (MicroBrightField Inc.) which provided the following information: measurements of each PC perimeter and area; the total number of PCs traced within the tissue section; the number of individual versus clustered PCs; and the perimeter and area of the total tissue section. From these results, additional data was assembled, including the range of PC sizes (smallest, largest and average size in mm2), the total number of PCs within a given row (distal or proximal), the combined area of all PCs within a tissue section or row, the percentage area occupied by PCs within a tissue section, and the density of PCs (number of PCs/mm2) within a given tissue section.
The tissue sections from each slice were grouped into three approximately equal regions (anterior, middle and posterior), by dividing the length of the interface between the proximal and distal rows by three. This process enabled examination of similar regions despite different lengths of foot slices and different numbers of tissue sections per row.
3D reconstruction of PCs
In addition to routine light microscopy (2D), we undertook 3D reconstruction of one PC cluster to explore the dimensions of PCs through space. This analysis was performed on well-preserved, paraffin-embedded dermal tissue from the middle region of specimen 4 (see Table 1). PCs in 100 H&E, 4-µm-thick serial sections were digitally traced with Neurolucida software (MicroBrightField Inc.) at 2.5×. A representative PC cluster was identified in slide 50 of the 100 slide sequence. The first PC within this cluster originated in slide 9, and PCs comprising the cluster were traced through the remaining slides. Digital tracings were compiled into 3D images and the volumes of three of the PCs within the cluster were calculated in NeuroExplorer. Volumes could only be determined for those PCs that both originated and completely disappeared from view within the confines of the 100 serial sections.
Results
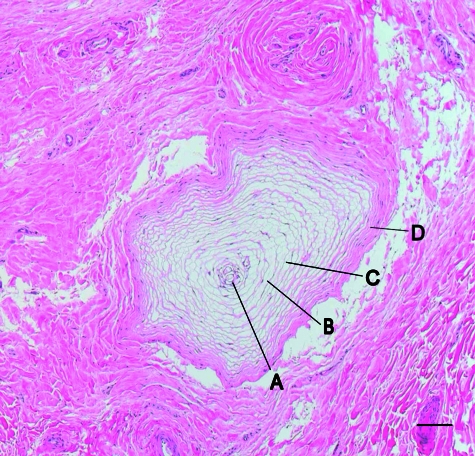
PCs were analyzed in four sagittal slices from the forefoot and four from the hindfoot. In each slice, two rows (proximal and distal) were analyzed, totaling 196 tissue sections. PCs were easily recognized as intact structures with discrete outer capsules, concentric lamellae, interlamellar spaces filled with fluid and various inclusions (Bell et al. 1994), and centrally located neurites (Fig. 3). PCs were identified as individuals or in clusters of up to 18, with the average cluster size between 3–4 PCs. Approximately 80% of the PCs appeared in clusters, some which were large enough to visualize on the glass slide without the use of the microscope. Table 2 contains data from slice 1, the more medial slice through specimen 2 (see Fig. 1A andTable 1). More PCs were located in the distal row than in the proximal row. Similar results were obtained for the remaining seven foot slices. Table 3 summarizes the data from specimens 2 and 3 (four slices per foot, two rows per slice).
Fig. 3.
A typical PC found in the elephant foot. (A) terminal neurite, (B) interlamellar space, (C) concentric lamellae, and (D) external capsule. Staining H&E, scale bar = 0.1 mm.
Table 2.
Data obtained from tracing PCs in one slice of an Asian elephant forefoot. The tissues examined came from a proximal and distal row of dermis, nine tissue sections each
| Row and section | Total area (mm2) | PC area (mm2) | % PC Area | # of PCs | Density (PC/mm2) |
|---|---|---|---|---|---|
| Proximal | |||||
| 1 | 545.185000 | 3.892560 | 0.714 | 10 | 0.018 |
| 2 | 600.465000 | 0 | 0 | 0 | 0 |
| 3 | 527.464000 | 0 | 0 | 0 | 0 |
| 4 | 530.602000 | 0 | 0 | 0 | 0 |
| 5 | 531.224000 | 0 | 0 | 0 | 0 |
| 6 | 538.797000 | 0 | 0 | 0 | 0 |
| 7 | 517.593000 | 0 | 0 | 0 | 0 |
| 8 | 462.946000 | 0 | 0 | 0 | 0 |
| 9 | 567.031000 | 3.247860 | 0.573 | 9 | 0.016 |
| Distal | |||||
| 1 | 390.893000 | 7.830180 | 2.003 | 23 | 0.059 |
| 2 | 599.327000 | 1.486200 | 0.248 | 7 | 0.012 |
| 3 | 586.375000 | 0.796750 | 0.136 | 3 | 0.005 |
| 4 | 553.953000 | 1.558980 | 0.281 | 6 | 0.011 |
| 5 | 551.203000 | 0 | 0 | 0 | 0 |
| 6 | 619.218000 | 1.288400 | 0.208 | 3 | 0.005 |
| 7 | 514.317000 | 0 | 0 | 0 | 0 |
| 8 | 566.715000 | 1.530770 | 0.270 | 11 | 0.019 |
| 9 | 314.482000 | 8.568480 | 2.725 | 31 | 0.099 |
Table 3.
Compilation of the PC data for all eight slices (four from the forefoot and four from the hindfoot)
| Front foot | Row | Tissue area (mm2) | # of PCs | Total PC area (mm2) | % PC area | PC density (PC/mm2) | Smallest PC (mm2) | Largest PC (mm2) | Average PC (mm2) |
|---|---|---|---|---|---|---|---|---|---|
| 1 | Proximal | 4821.307000 | 19 | 7.140420 | 0.148 | 0.004 | 0.110407 | 1.199300 | 0.375811 |
| Distal | 4696.483000 | 84 | 23.059760 | 0.491 | 0.018 | 0.009881 | 1.492860 | 0.274521 | |
| 2 | Proximal | 5407.115000 | 6 | 1.303720 | 0.024 | 0.001 | 0.106753 | 0.290442 | 0.217288 |
| Distal | 6644.686000 | 43 | 9.078361 | 0.137 | 0.006 | 0.587116 | 0.916233 | 0.211125 | |
| 3 | Proximal | 6418.951000 | 0 | 0 | 0 | 0 | 0 | 0 | 0 |
| Distal | 7802.760000 | 27 | 2.845888 | 0.036 | 0.003 | 0.010936 | 0.533018 | 0.105404 | |
| 4 | Proximal | 6254.511000 | 34 | 9.514603 | 0.152 | 0.005 | 0.305603 | 1.064290 | 0.279841 |
| Distal | 7113.401000 | 86 | 18.663890 | 0.262 | 0.012 | 0.949098 | 0.917542 | 0.217022 |
| Back foot | Row | Tissue area (mm2) | # of PCs | Total PC area (mm2) | % PC Area | PC density (PC/mm2) | Smallest PC (mm2) | Largest PC (mm2) | Average PC (mm2) |
|---|---|---|---|---|---|---|---|---|---|
| 5 | Proximal | 5065.516000 | 5 | 0.474218 | 0.009 | 0.001 | 0.014861 | 0.163985 | 0.094844 |
| Distal | 6177.953000 | 56 | 6.990684 | 0.113 | 0.009 | 0.007093 | 0.521719 | 0.124833 | |
| 6 | Proximal | 6316.449000 | 22 | 5.084787 | 0.081 | 0.003 | 0.019346 | 0.970535 | 0.231127 |
| Distal | 7881.736000 | 85 | 25.089530 | 0.318 | 0.011 | 0.030116 | 0.990030 | 0.295171 | |
| 7 | Proximal | 6896.930000 | 10 | 1.264667 | 0.018 | 0.001 | 0.032844 | 0.264237 | 0.126467 |
| Distal | 7248.872000 | 47 | 15.484645 | 0.214 | 0.006 | 0.065653 | 0.843024 | 0.329461 | |
| 8 | Proximal | 5407.110000 | 35 | 7.106473 | 0.131 | 0.006 | 0.006807 | 0.633737 | 0.203042 |
| Distal | 6046.051000 | 118 | 27.208680 | 0.450 | 0.020 | 0.015795 | 0.862347 | 0.230582 |
In order to determine PC regional distribution in the foot, the tissue sections from each slice were grouped into three approximately equal regions (anterior, middle and posterior, see Materials and methods). The total number of PCs within each region is summarized in Table 4. In the forefoot, there is a clear difference in PC distribution within the four slices; more PCs are found in the anterior and posterior regions than in the middle region (52.1%, 42.7% and 5% respectively). In the four hindfoot slices, PCs were again more numerous in the anterior and posterior regions than in the middle region, but the difference was not as pronounced (31.8%, 45.7% and 22.5% respectively). Interestingly, the forefoot had higher numbers of PCs in the anterior region, while in the hindfoot, higher numbers were located in the posterior region.
Table 4.
Regional distribution of PCs in each foot
| Total # of PCs (forefoot) | Total # of PCs (hindfoot) | ||||||||
|---|---|---|---|---|---|---|---|---|---|
| Slice | Anterior | Middle | Posterior | Total no. | Slice | Anterior | Middle | Posterior | Total no. |
| 1 | 43 | 9 | 51 | 5 | 24 | 19 | 18 | ||
| 2 | 13 | 0 | 36 | 6 | 21 | 22 | 64 | ||
| 3 | 8 | 2 | 17 | 7 | 25 | 2 | 30 | ||
| 4 | 91 | 4 | 23 | 8 | 47 | 40 | 66 | ||
| Total #/region | 155 | 15 | 127 | 297 | Total #/region | 117 | 83 | 178 | 378 |
| % of Total | 52.19% | 5.05% | 42.76% | % of Total | 30.95% | 21.96% | 47.09% | ||
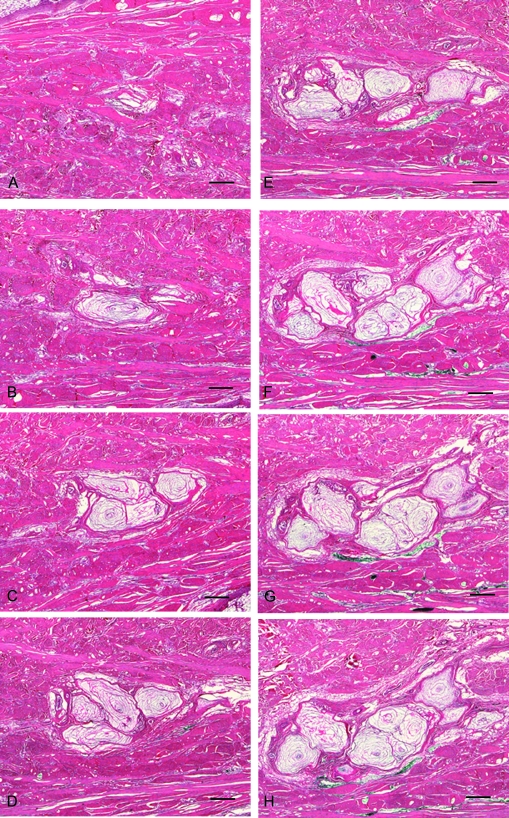
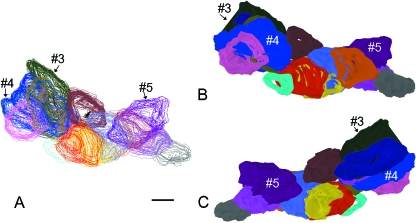
For the 3D analysis, the formation and progressive changes of the cluster morphology are demonstrated in Figs 4 and 5. Figure 4 depicts representative levels of the cluster through the 100 serial sections. The cluster morphology is quite complex: in addition to new PCs appearing or disappearing from the plane of section, occasionally some PCs split into two.
Fig. 4.
A cluster of PCs as they appear in section through a series of 100 slides, spanning a total thickness of 400 µm. PCs were traced from the glass slides using Neurolucida software, beginning with slide 9, the first slide in which a PC appeared in the designated cluster. (A) slide 9, (B) slide 22, (C) slide 34, (D) slide 50, (E) slide 62, (F) slide 79, (G) slide 87 and (H) slide 95. Staining H&E, scale bar = 0.5 mm.
Fig. 5.
3D image of a PC cluster constructed from traced contours. Each PC is a different color. (A) line drawing, (B) solid filled contours, and (C) solid filled contours as viewed from the opposite side of the cluster. Numbered PC volumes were 3 = 0.0996236 mm3, 4 = 0.126674 mm3, and 5 = 0.113634 mm3. Scale bar = 0.5 mm.
Figure 5 shows the computer-generated 3D image of the PC cluster with linear (Fig. 5A) and filled contour (Fig. 5B,C) forms. At its largest, the cluster contained thirteen PCs, five which were considered ‘complete’ (PCs that appeared and completely disappeared from the plane of section within the 100 serial sections). Volumes were calculated for three of the PCs labeled 3, 4 and 5 in Fig. 5, and their respective volumes are included in the figure legend.
Discussion
Pacinian corpuscles are found in a variety of species and tissues and their function has been previously described in detail (see Bell et al. 1994 for review). This is, however, the first in-depth study to examine PCs in the Asian elephant foot and to describe their distribution and density through four regions of a forefoot and hindfoot. The presence and location of these mechanoreceptors in both Asian and African elephant feet (Weissengruber et al. 2006) suggest that PCs may play a role in detecting seismic waves produced by low-frequency, high-amplitude elephant rumbles.
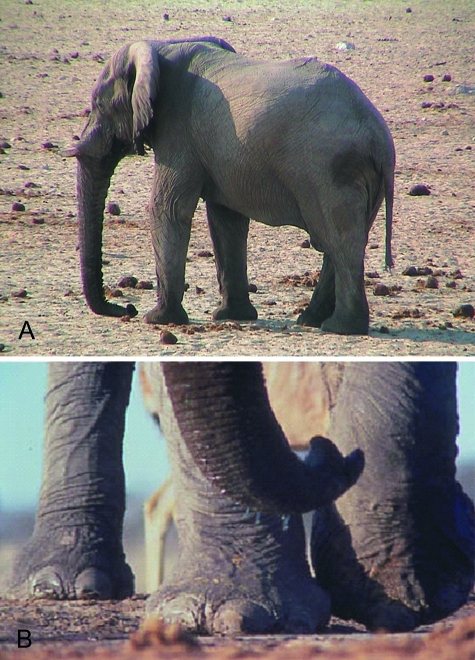
Field studies conducted in Namibia's Etosha National Park have documented specific African elephant behaviors in response to previously recorded elephant vocalizations played back through the ground (O'Connell-Rodwell et al. 2006). Behaviors exhibited in response to seismic signals include ceasing normal activity to adopt a motionless, ‘freezing’ posture, scanning the horizon, orienting toward the source of the seismic signal (Fig. 6A), shifting weight to the forefeet, lifting 1 foot to touch the most anterior portion of the foot to the ground (Fig. 6B), or rocking back onto the heels of the hindfeet (O'Connell-Rodwell et al. 2006 and C.E. O'Connell-Rodwell unpublished observations). These foot postures appear to directly correlate to the PC regional distributions in the Asian elephant forefoot and hindfoot which suggest that these mechanoreceptors within the foot may be intricately involved in seismic signal detection.
Fig. 6.
Postures assumed by elephants detecting previously recorded elephant vocalizations played back through the ground (see Discussion). (A) The elephant is facing the source of the vibration with weight shifted to the front feet. (B) An elephant lifts the left forefoot, placing more weight on the entire right foot, and focusing weight on the toes of the left foot. (Photos taken in Etosha National Park, Namibia, courtesy of Dr Caitlin O'Connell-Rodwell.)
The results of our current study show that PCs in the elephant foot are similar in size and morphology to those described in other species (Ide, 1976; Kumamoto et al. 1993; Rico et al. 1996; Dubovy & Bednarova, 1999; Rice & Rasmusson, 2000). PCs in the human hand average 0.77 mm2 and appear in clusters (Stark et al. 1998). The PCs identified in our study had an average size of 0.241 mm2 in the forefoot and 0.231 mm2 in the hindfoot and approximately 80% were in clusters. This arrangement of PCs would increase available surface area and would most likely facilitate the ability to detect the horizontal motion from surface waves produced from elephant vocalizations in the ground (Gunther et al. 2004). PCs in the Asian elephant foot are distributed more densely in the dermis, close to the sole. A similar distribution has been described in the digits of humans, monkeys and raccoons (Kumamoto et al. 1993; Stark et al. 1998; Rice & Rasmusson, 2000; Hoffmann et al. 2004) where PCs are more numerous closer to the skin. Furthermore, PCs in the Asian elephant foot are predominantly localized along the anterior and posterior regions of the foot. The location of the higher numbers of PCs in these areas suggests a correlation with the above mentioned foot postures, i.e. focusing that part of the foot in such a position as to possibly facilitate a direct route for relaying vibrations in the ground to the somatosensory nervous system. Other anatomic structures may contribute to elephants' ability to detect seismic waves including conduction of ground vibrations through the toe bones to stimulate the over-sized malleus of the middle ear (Reuter et al. 1998), or laying of the trunk, which is highly invested with PCs and Meissner's corpuscles, on the ground (Rasmussen & Munger, 1996; O'Connell et al. 1998). However the sensitivity range of PCs (20–1000 Hz) would suggest that PCs are particularly suited to detect the very low-frequencies emitted by elephant rumbles.
Elephant seismic rumbles most likely supplement acoustic vocalizations with the advantage of traveling through the ground, often a more stable substrate. These seismic signals travel at different rates and have different wavelengths relative to their acoustic counterparts. For example, at two different field sites, a 20 Hz elephant vocalization had an approximately 12 m wavelength in the ground (relative to a 17 m wavelength in the air). The shorter wavelengths of these slower velocity seismic waves would be easier to localize. In addition, the larger distance between the front and back feet as compared with the ears provides a greater distance to detect phase angle differences, also increasing the elephant's ability to localize these wavelengths (O'Connell-Rodwell et al. 2000, 2001, 2006).
We now know that elephants produce, detect and respond to low-frequency seismic information. Proposed pathways for elephant detection of these vibrations include bone conduction, somatosensory reception or both. In our exploration of the somatosensory pathway coupled with behavioral observations, it appears that elephant PCs serve as an important mechanism for detecting seismic information produced by other elephants and potentially the physical environment as well.
Acknowledgments
We would like to thank Stanford University's VPUE grant, Stanford University's Bio-X Interdisciplinary Research Award and the Seaver Institute for funding this research. We thank Pauline Chu for her excellent technical assistance with the histology.
References
- Bell J, Bolanowski S, Holmes MH. The structure and function of Pacinian corpuscles: a review. Prog Neurobiol. 1994;42:79–128. doi: 10.1016/0301-0082(94)90022-1. [DOI] [PubMed] [Google Scholar]
- Bolanowski SJ, Jr, Zwislocki JJ. Intensity and frequency characteristics of pacinian corpuscles. II. Receptor potentials. J Neurophysiol. 1984;51:812–830. doi: 10.1152/jn.1984.51.4.812. [DOI] [PubMed] [Google Scholar]
- Brisben AJ, Hsiao SS, Johnson KO. Detection of vibration transmitted through an object grasped in the hand. J Neurophysiol. 1999;81:1548–1558. doi: 10.1152/jn.1999.81.4.1548. [DOI] [PubMed] [Google Scholar]
- Dubovy P, Bednarova J. The extracellular matrix of rat pacinian corpuscles: an analysis of its fine structure. Anat Embryol (Berl) 1999;200:615–623. doi: 10.1007/s004290050309. [DOI] [PubMed] [Google Scholar]
- Gunther RH, O'Connell-Rodwell CE, Klemperer SL. Seismic waves from elephant vocalizations: a possible communication mode? Geophys Res Lett. 2004;31:1–4. [Google Scholar]
- Heffner RS, Heffner HE. Hearing in the elephant (Elephas maximus): absolute sensitivity, frequency discrimination, and sound localization. J Comp Physiol Psychol. 1982;96:926–944. [PubMed] [Google Scholar]
- Hoffmann JN, Montag AG, Dominy NJ. Meissner corpuscles and somatosensory acuity: the prehensile appendages of primates and elephants. Anat Rec A Discov Mol Cell Evol Biol. 2004;281:1138–1147. doi: 10.1002/ar.a.20119. [DOI] [PubMed] [Google Scholar]
- Ide C. The fine structure of the digital corpuscle of the mouse toe pad, with special reference to nerve fibers. Am J Anat. 1976;147:329–355. doi: 10.1002/aja.1001470307. [DOI] [PubMed] [Google Scholar]
- Kubota K. Comparative anatomical and neurohistological observations on the tongues of elephants (Elephas indicus and Loxodonta africancx) Anat Rec. 2005;157:505–515. [Google Scholar]
- Kumamoto K, Senuma H, Ebara S, Matsuura T. Distribution of pacinian corpuscles in the hand of the monkey, Macaca fuscata. J Anat. 1993;183(Pt 1):149–154. [PMC free article] [PubMed] [Google Scholar]
- Langbauer WR, Jr, Payne KB, Charif RA, Rapaport L, Osborn F. African elephants respond to distant playbacks of low-frequency conspecific calls. J Exp Biol. 1991;157:35–46. [Google Scholar]
- McComb K, Reby D, Baker L, Moss C, Sayialel C. Long-distance communication of acoustic cues to social identity in African elephants. Anim Behav. 2003;65:317–329. [Google Scholar]
- O'Connell CE, Hart LA, Arnason B. Comments on ‘Elephant hearing ’[J. Acoust. Soc. Am. 104, 1122–1123, 1998] J Acoust Soc Am. 1998;105:2051–2052. doi: 10.1121/1.426748. [DOI] [PubMed] [Google Scholar]
- O'Connell-Rodwell CE, Arnason BT, Hart LA. Seismic properties of Asian elephant (Elephas maximus) vocalizations and locomotion. J Acoust Soc Am. 2000;108:3066–3072. doi: 10.1121/1.1323460. [DOI] [PubMed] [Google Scholar]
- O'Connell-Rodwell CE, Hart LA, Arnason BT. Exploring the potential use of seismic waves as a communication channel by elephants and other large mammals. Am Zool. 2001;41:1157–1170. [Google Scholar]
- O'Connell-Rodwell CE, Wood JD, Rodwell TC, et al. Wild elephant (Loxodonta africana) breeding herds respond to artificially transmitted seismic stimuli. Behav Ecol Sociobiol. 2006;59:842–850. [Google Scholar]
- Pare M, Smith AM, Rice FL. Distribution and terminal arborizations of cutaneous mechanoreceptors in the glabrous finger pads of the monkey. J Comp Neurol. 2002;445:347–359. doi: 10.1002/cne.10196. [DOI] [PubMed] [Google Scholar]
- Payne KB, Langbauer WR, Jr, Thomas EM. Infrasonic calls of the Asian elephant (Elephus maximus) Behavioral Ecology and Sociobiology. 1986;1986:297–301. [Google Scholar]
- Poole JH, Payne K, Langbauer WR, Jr, Moss CJ. The social contexts of some very low frequency calls of African elephants. Behav Ecol Sociobiol. 1988;22:385–392. [Google Scholar]
- Rasmussen LE, Munger BL. The sensorineural specializations of the trunk tip (finger) of the Asian elephant, Elephas maximus. Anat Rec. 1996;246:127–134. doi: 10.1002/(SICI)1097-0185(199609)246:1<127::AID-AR14>3.0.CO;2-R. [DOI] [PubMed] [Google Scholar]
- Reuter T, Nummela S, Hemilea S. Elephant hearing. J Acoust Soc Am. 1998;104:1122–1123. doi: 10.1121/1.423341. [DOI] [PubMed] [Google Scholar]
- Rice FL, Rasmusson DD. Innervation of the digit on the forepaw of the raccoon. J Comp Neurol. 2000;417:467–490. doi: 10.1002/(sici)1096-9861(20000221)417:4<467::aid-cne6>3.0.co;2-q. [DOI] [PubMed] [Google Scholar]
- Rico B, Solas MT, Clement J, Suarez I, Fernandez B. Ultrastructural study of the Pacinian corpuscles in the newborn and adult dog forefoot. Eur J Morphol. 1996;34:311–320. doi: 10.1076/ejom.34.4.311.13047. [DOI] [PubMed] [Google Scholar]
- Stark B, Carlstedt T, Hallin RG, Risling M. Distribution of human Pacinian corpuscles in the hand. A cadaver study. J Hand Surg [Br] 1998;23:370–372. doi: 10.1016/s0266-7681(98)80060-0. [DOI] [PubMed] [Google Scholar]
- Weissengruber GE, Egger GF, Hutchinson JR, et al. The structure of the cushions in the feet of African elephants (Loxodonta africana) J. Anat. doi: 10.1111/j.1469-7580.2006.00648.x. [DOI] [PMC free article] [PubMed] [Google Scholar]
- Wood JD, O'Connell-Rodwell CE, Klemperer E. Using seismic sensors to detect elephants and other large mammals: a novel censusing technique for wildlife managers. J Appl Ecol. 2005;42:587–594. [Google Scholar]


