

Abstract
Background
The National Survey of Lead and Allergens in Housing was the first population-based study to measure indoor allergen levels in US homes.
Objective
We characterized the overall burden to multiple allergens and examined whether elevated allergen levels were associated with occupants’ asthma status.
Methods
This cross-sectional study surveyed a nationally representative sample of 831 housing units in 75 different locations throughout the US. Information was collected by questionnaire and environmental assessments. Allergen concentrations in dust samples were assessed by immunoassays. The following cut points were used to define elevated allergen levels: 10 μg/g for Der p 1, Der f 1, and Can f 1; 8 μg/g for Fel d 1; 8 U/g Bla g 1; 1.6 μg/g for mouse urinary protein; and 7 μg/g for Alternaria antigens. Allergen burden was considered high when 4 or more allergens exceeded elevated levels in any of the sampling locations.
Results
Exposure to multiple allergens was common in US homes. Of the surveyed homes, 51.5% had at least 6 detectable allergens and 45.8% had at least 3 allergens exceeding elevated levels. Occupants’ race, income, housing type, absence of children, and presence of smokers, pets, cockroaches, rodents and mold/moisture related problems were independent predictors of high allergen burden. Among atopics, high allergen burden increased the odds of having asthma symptoms (OR=1.81, 95% CI: 1.04-3.15).
Conclusion
Elevated allergen levels in the home are associated with asthma symptoms in allergic individuals.
Clinical implication
In allergic asthma, indoor allergen exposures play an important role in asthma exacerbations.
Keywords: allergen, indoor, exposure, asthma, allergy
INTRODUCTION
Asthma morbidity is a significant public health concern, not only in terms of health care costs but also in terms of lost productivity and reduced quality of life.1 Over 30 million people in the US have been diagnosed with asthma, and at least two-thirds of the diagnosed asthmatics suffer from current asthma with active symptoms.2
Indoor exposures are of great importance in relation to asthma because most people spend a large amount of their time indoors, especially at home.3 Exposure to indoor allergens, generated from animals, arthropods, rodents, and molds, is considered an important risk factor for asthma.4, 5 Although the role of indoor allergen exposure in the development of sensitization and asthma has remained a subject of controversy, there is strong evidence that indoor allergens play a key role in triggering and exacerbating asthma, particularly in sensitized individuals.6
In the United States, numerous studies of indoor allergens have been conducted; however, many of the studies have focused on single allergens and/or selected populations (e.g., asthmatic, allergic, and inner city populations).4, 7 Types and levels of allergens have been found to vary substantially by socioeconomic, ethnic, and regional factors among the studied populations, which predominantly represent high risk groups.8, 9 Yet, little information is available about how levels of common indoor allergens vary in the general US population. Although studies suggest that exposure to multiple allergens in homes is not uncommon,10, 11 few studies have examined factors that contribute to high allergen burden across multiple allergens,12 or the role of multiple allergen exposures in relation to asthma.
To characterize and achieve better understanding of the exposure variability in homes, the National Institute of Environmental Health Sciences and the US Department of Housing and Urban Development conducted a survey that assessed levels of several indoor allergens (Bla g 1, Can f 1, Der f 1, Der p 1, Fel d 1, mouse urinary protein, and Alternaria alternata) and endotoxin in the US housing stock. It has been postulated that besides allergens, exposure to endotoxin may also influence asthma morbidity.13 The National Survey of Lead and Allergens in Housing (NSLAH) provides a unique opportunity to examine allergen and endotoxin exposures in relation to asthma in a nationally representative sample of US population.14 Our previous publications have described the details of the individual exposures.13, 15-19 In this manuscript, we estimate the burden of exposure to multiple allergens in US homes, identify independent predictors of high allergen burden, explore interrelationships between allergen and endotoxin levels, and examine the associations between high allergen burden and asthma-related outcomes among the study population.
METHODS
The data for this cross-sectional study were collected as part of the NSLAH, which used a complex, multistage design to sample the US population of permanently occupied, non-institutional housing units that permit children. The survey was approved by the NIEHS Institutional Review Board in 1998. Details of the survey methodology and population characteristics have been previously published.14 Briefly, a nationally representative sample of 831 housing units, inhabited by 2,456 individuals, within 75 different locations throughout the US was surveyed. At each home, a residential questionnaire was administered and environmental data were acquired by inspection and sample collection.
Environmental sampling
Single surface dust samples were collected from a bed, a sofa or a chair, and from bedroom, living room, and kitchen floors as previously described.14 Concentrations of the indoor allergens were measured with immunoassays. Dust mite (Der f 1, Der p 1), dog (Can f 1), cat (Fel d 1), and cockroach (Bla g 1) allergens were measured using monoclonal antibody-based enzyme-linked immunosorbent assays (ELISA).14 Mouse urinary protein (MUP) and Alternaria alternata antigens were assayed with ELISA using polyclonal antibodies.14, 18, 19 The Alternaria assay has been shown to measure overall Alternaria exposure in environmental samples; the polyclonal antibody used is directed against a large range of Alternaria proteins, including but not limited to known allergens.20 For most samples, the lower limits of detection (LLODs) were as follows: 0.025 μg/g for Der p 1 and Der f 1; 0.050 μg/g for Can f 1; 0.012 μg/g for Fel d 1; 0.10 U/g for Blag 1; 0.25 μg/g for MUP; and 0.14 μg/g for Alternaria. Concentrations below the LLODs were considered non-detectable. Endotoxin concentrations in the samples were assessed using the kinetic chromogenic Limulus ambocyte lysate assay with the detection limit of 0.001 EU/mg of sieved dust.13 The samples that had insufficient amount of dust for the analysis were considered missing. However, allergen measurements were available from at least one room for 99% of the homes. The corresponding percentage for endotoxin was 95%.
Assessment of asthma and allergy
The interviewer-administered questionnaire obtained information on doctor-diagnosed asthma and allergies. Current symptomatic asthma among the diagnosed asthmatics was ascertained with a question confirming asthma symptoms in the past year. Atopic status was assessed by report of physician diagnosis of allergies. While these self-reported health outcomes were assessed and primarily analyzed at the individual level, we also evaluated the outcomes at the household level (i.e., household level definition was based on whether anyone in the household reported the health outcome or none of the residents reported it).
Statistical analysis
All statistical analyses were conducted using SUDAAN software (v. 9.1, RTI, RTP, NC) and sample weights were applied to all estimates. Details of statistical weighting for the NSLAH have been described elsewhere.14
For the purpose of analysis, we dichotomized allergen concentrations using provisional cut points that have been associated with asthma morbidity and allergic sensitization.21-25 Such cut points, however, are not as well established for Alternaria and mouse allergen as they are for other indoor allergens. For mouse allergen, we used a threshold that has been associated with sensitization in recent publications.18, 26 For Alternaria, we chose a cut point which has been associated with increased odds of asthma symptoms in the NSLAH.27 The cut points used in the analysis were as follows: 10 μg/g for Der p 1, Der f 1, and Can f 1; 8 μg/g for Fel d 1; 8 U/g Bla g 1; 1.6 μg/g for MUP; and 7 μg/g for Alternaria.
We evaluated the overall burden of exposure to multiple allergens by assessing how many allergens exceeded detection limits and allergen-specific thresholds for elevated levels in each home. The allergen-specific exposure level in the home was considered elevated if allergen concentration exceeded the cut point value in any of the sampling locations. Exposure to dust mite allergens was defined as elevated if either Der f 1 or Der p 1 concentrations exceeded 10 μg/g in any of the sampling locations. Exposure to multiple allergens in the home was dichotomized to reflect high (4 or more allergens exceeding elevated levels) versus low-medium levels (0-3 allergens exceeding elevated levels).
To identify factors that predicted a high burden of exposure to multiple allergens, we performed logistic regression analysis. All potential socio-demographic and housing-related variables were first evaluated using bivariate analyses. Of the evaluated variables, we selected those with p-values less than or equal to 0.25 (race, income/poverty level, census region, housing type, building year, use of air conditioning/dehumidifier, cleaning frequency, presence of children, smokers, pets, cockroaches, rodents or mold/moisture related problems) for inclusion in the regression analysis. In our data driven modeling approach, we used backward elimination for model selection; starting from the full model, variables with the highest p-value (Wald F) were dropped until all remaining predictors in the model had p-values less than or equal to 0.05.
For descriptive purposes, we explored exposure patterns in the allergen data. We used logistic regression analysis to determine which allergens cluster together in high levels. To evaluate associations between pairs of allergens, we calculated odds ratios with 95% confidence intervals for each pair, using dichotomized allergen levels (elevated level: yes vs. no). Because exposure to endotoxin has been associated with asthma morbidity,13 we not only looked at interrelationships between different allergens, but also at associations between allergen and endotoxin levels. To further characterize the relationship between allergen burden and endotoxin levels, we estimated mean (geometric) endotoxin concentrations for each level of allergen burden. Comparisons of the means were assessed with ANOVA using Wald’s F statistics.
We compared the allergen burden between asthmatic and non-asthmatic households using χ2 statistics. To examine whether high allergen burden was associated with occupants’ asthma status at the individual level, we calculated odds ratios with 95% confidence intervals for the asthma related outcomes using logistic regression. The models we present here are adjusted for age, gender, race, education, smoking, season, and endotoxin levels. Since we did not have information on personal smoking, smoking exposure was assessed at the household level (indoor smoking in the home). Although total amount of dust can influence inhaled exposure levels, we did not adjust for dust weight because the adjustment did not appreciably change the odds ratios (change less than 5%). We present separate odds ratios for atopic and non-atopic individuals; the observed effect was modified by atopic status. Subjects with missing data on the exposures were excluded from the analyses at the individual level, leaving 1953 of 2456 subjects for the analysis (80%).
RESULTS
Distributions of allergens levels
Table I shows percentages of US households with detectable and with elevated levels of measured allergens. Alternaria, cat (Fel d 1) and dog (Can f 1) allergens were the most commonly detected allergens; virtually all homes (>99%) had detectable levels in at least 1 sampling location. Detectable levels of dust mite allergens (Der f 1 and Der p 1) were found in at least 85% of the surveyed homes, and mouse (MUP) and cockroach (Bla g 1) allergens were detected in 82% and 63% of the households, respectively. Of the dust mite allergens, Der f 1 had highest levels in bedrooms; Alternaria, cat, and dog allergens were found to be highest in living rooms; and mouse and cockroach allergen levels tended to be most elevated in kitchens (Table I). More detailed information of the distributions can be found elsewhere.15-19
TABLE I.
Estimated distributions of detectable and elevated allergen levels in US homes by sampling location
| Percentage (SE) of households by sampling location |
||||||
|---|---|---|---|---|---|---|
| Allergen levels | Bedroom Bed | Bedroom Floor | Kitchen Floor | Living room Floor | Living room Upholstery | Any Location |
| Alternaria | ||||||
| Detectable | 92.9 (1.4) | 99.6 (0.2) | 98.1 (0.5) | 98.7 (0.4) | 98.6 (0.5) | 99.9 (0.1) |
| <7 μg/g | 10.4 (1.6) | 30.4 (2.4) | 24.0 (2.4) | 38.8 (1.9) | 24.6 (2.2) | 56.5 (2.3) |
| Bla g 1 | ||||||
| Detectable | 6.1 (0.8) | 17.6 (1.6) | 28.5 (1.9) | 44.4 (2.1) | 38.4 (2.0) | 62.7 (1.8) |
| <8 U/g | 0.5 (0.2) | 3.2 (0.7) | 9.5 (1.0) | 2.7 (0.7) | 1.1 (0.4) | 10.2 (1.1) |
| Can f 1 | ||||||
| Detectable | 93.8 (1.1) | 95.6 (0.9) | 82.6 (2.4) | 94.9 (0.9) | 98.0 (0.5) | 99.2 (0.3) |
| <10 μg/g | 28.9 (1.9) | 30.3 (2.0) | 27.2 (3.9) | 34.6 (2.0) | 37.7 (2.0) | 42.2 (2.1) |
| Der f 1 | ||||||
| Detectable | 82.3 (2.0) | 80.7 (2.1) | 42.8 (3.5) | 73.5 (2.2) | 78.3 (2.2) | 89.5 (1.8) |
| <10 μg/g | 17.4 (2.1) | 24.2 (2.5) | 1.1 (0.6) | 15.6 (1.6) | 15.3 (2.2) | 35.5 (2.6) |
| Der p 1 | ||||||
| Detectable | 68.7 (2.7) | 70.3 (2.2) | 39.0 (4.4) | 63.6 (3.0) | 72.1 (3.0) | 85.9 (2.2) |
| <10 μg/g | 8.4 (0.9) | 11.6 (1.5) | 1.0 (0.5) | 8.6 (1.1) | 14.6 (1.7) | 22.1 (1.5) |
| Fel d 1 | ||||||
| Detectable | 96.7 (0.6) | 96.9 (0.8) | 83.5 (2.0) | 96.0 (0.8) | 97.9 (0.5) | 99.7 (0.2) |
| <8 μg/g | 30.9 (1.9) | 28.3 (1.6) | 22.3 (2.2) | 26.9 (1.8) | 40.2 (1.8) | 43.4 (1.7) |
| MUP | ||||||
| Detectable | 41.2 (2.2) | 50.0 (2.1) | 57.0 (2.2) | 40.7 (2.5) | 37.4 (2.4) | 82.3 (1.6) |
| <1.6 μg/g | 8.4 (1.2) | 13.5 (1.2) | 21.6 (2.1) | 12.1 (1.4) | 7.9 (1.2) | 34.6 (2.3) |
Allergen measurements available from at least one room for 99% (N=822) of the households
Overall burden of multiple indoor allergens
Exposure to multiple allergens in US homes was common (Figure 1). Over half of the homes (51.5%) had detectable levels of all measured allergens. At least 2 allergens were detected in every home (Figure 1A). In less than 8% of the homes, allergen levels did not exceed any of the threshold values for elevated levels. Most homes had 2-3 allergens in elevated levels, and 18.0% (SE=1.8) of the homes had 4 or more allergens exceeding elevated levels (Figure 1B). Table E1 in the online supplement shows how elevated allergen levels were distributed among those who had a high burden of exposure to multiple allergens (4 or more allergens exceeding elevated levels). As in the total study population, Alternaria was the most common and cockroach the least common allergen to exceed elevated levels.
Figure 1.
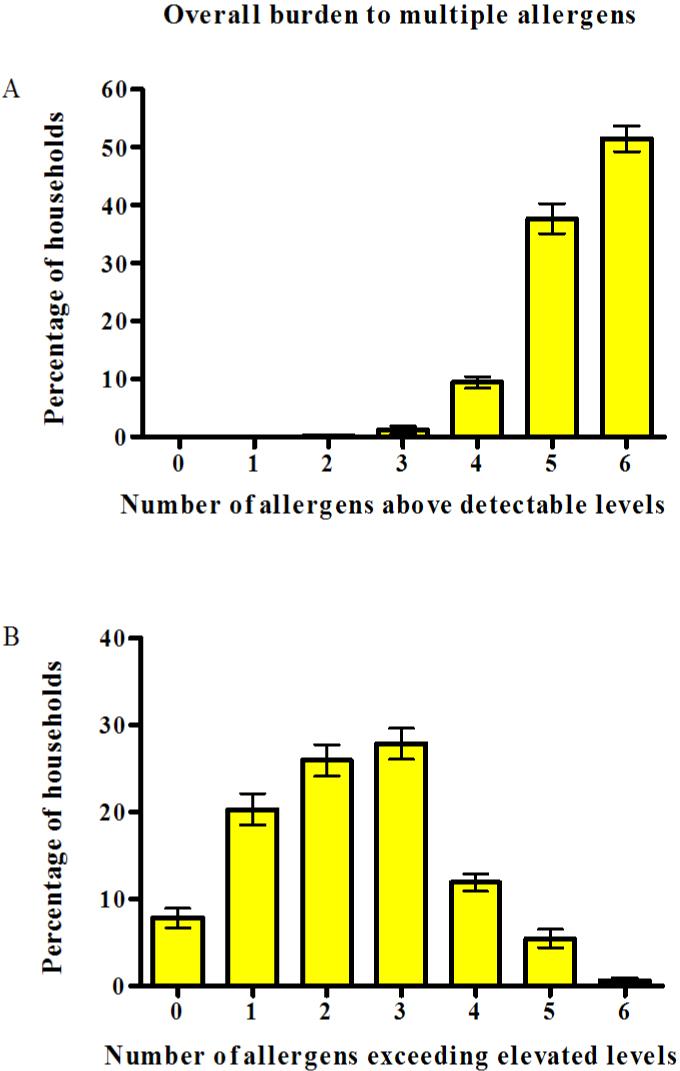
Overall burden of multiple allergens in US homes. The bar graph shows percentages (± SE) of homes with detectable (A) and with elevated levels of allergens (B) by numbers of allergens exceeding allergen-specific thresholds.
Independent predictors of high allergen burden
We used multivariable logistic regression to identify independent predictors of high allergen burden. The following predictors remained in the final model: family race, income level, housing type, absence of children, and presence of smokers, pets, cockroaches, rodents and mold/moisture related problems. Table II shows estimated prevalences and odds ratios for the independent predictors of high allergen burden in US homes. The online supplement (Table E2) shows allergen-specific prevalences by the predictors (bivariate analysis).
TABLE II.
Estimated prevalences and odds ratios for the independent predictors of high allergen burden*in US homes (NSLAH, 1998-1999)
| Predictor | Percentage (SE) | OR (95%CI)† | p-value‡ |
|---|---|---|---|
| Race | |||
| White | 19.84 (2.14) | 2.64 (1.50, 4.63) | <0.01 |
| Other | 10.94 (1.80) | 1.00 | |
| Family income | <0.01 | ||
| $0 - 19,999 | 22.56 (4.71) | 1.84 (0.85, 3.98) | |
| $20, 000 - 39,000 | 23.87 (3.46) | 2.44 (1.14, 5.22) | |
| $40,000 - 59,000 | 11.53 (2.96) | 0.72 (0.30, 1.74) | |
| $60,000+ | 12.12 (2.96) | 1.00 | |
| Housing type | 0.04 | ||
| Single family home | 19.06 (2.01) | 1.94 (1.02, 3.67) | |
| Multi-family home | 11.36 (2.32) | 1.00 | |
| Child resident(s) | 0.01 | ||
| No | 19.43 (1.92) | 1.65 (1.16, 2.34) | |
| Yes | 15.95 (2.36) | 1.00 | |
| Smoker(s) in the household | <0.01 | ||
| Yes | 23.47 (2.01) | 1.74 (1.19, 2.53) | |
| No | 13.23 (2.01) | 1.00 | |
| Mold/moisture problems§ | <0.01 | ||
| Yes | 24.21 (2.63) | 2.06 (1.28, 3.30) | |
| No | 11.76 (1.80) | 1.00 | |
| Pets in the household | <0.01 | ||
| Yes | 24.82 (2.55) | 2.98 (1.67, 5.31) | |
| No | 11.31 (2.19) | 1.00 | |
| Cockroaches§ | 0.05 | ||
| Yes | 24.12 (4.65) | 1.80 ( 1.00, 3.24) | |
| No | 16.73 (1.84) | 1.00 | |
| Rodents§ | 0.01 | ||
| Yes | 26.01 (4.33) | 1.75 (1.15, 2.66) | |
| No | 16.55 (1.77) | 1.00 |
4 or more allergens exceeding elevated levels in the household; cut points for elevated allergen levels: 10 μg/g for Der f 1, Derp 1, and Can f 1; 8 μg/g for Fel d 1; 8 U/g Bla g 1; 1.6 μg/g for MUP; and 7 μg/g for Alternaria
Odds ratio adjusted for each variable in the table
Wald F test
Assessed by observation (occupants, field team)
Interelationships between endotoxin and multiple indoor allergens
We examined the association between the allergen burden and endotoxin levels by comparing the geometric mean concentration of endotoxin across the levels of allergen burden (Figure 2). Endotoxin levels increased with increasing allergen burden (P < 0.01 for trend).
Figure 2.
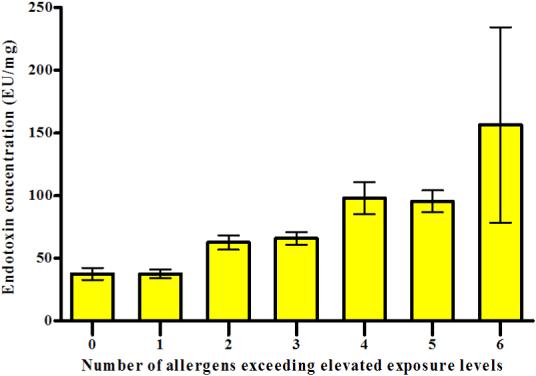
Relationship between allergen burden and endotoxin levels. The bar graph displays the geometric mean concentration of endotoxin (the mean of all sampling location concentrations) across the levels of allergen burden (± GSE).
Table III demonstrates interrelationships between the allergens and endotoxin in more detail. Elevated levels of cat (Fel d 1), dog (Can f 1), and dust mite (Der f 1) allergens were inversely associated with elevated cockroach allergen levels. Increased levels of all other allergens, except cockroach, were positively associated with elevated Alternaria levels. Although concentrations of Der f 1 and Der p 1 were interrelated, they appeared to have distinct associations with other allergens, reflecting perhaps biological and ecological differences between the two mite species. Elevated cat and dog allergen levels were significantly associated with each other, and elevated mouse allergen was most strongly associated with elevated cockroach and Alternaria levels. Of the measured allergens, elevated Alternaria, cockroach and mouse allergens were also associated with elevated endotoxin levels.
TABLE III.
Odds ratios (95% CI) for bivariate associations between elevated levels of allergens and endotoxin*
| Alternaria OR (95% CI) | Bla g 1 OR (95% CI) | Can f 1 OR (95% CI) | Der f 1 OR (95% CI) | Der p 1 OR (95% CI) | Fel d 1 OR (95% CI) | MUP OR (95% CI) | Endotoxin OR (95% CI) | |
|---|---|---|---|---|---|---|---|---|
| Alternaria | NA | 1.40 (0.78, 2.51) | 1.63 (1.07, 2.50) | 1.79 (1.17, 2.72) | 2.87 (1.72, 4.79) | 1.79 (1.25, 2.56) | 2.54 (1.57, 4.10) | 2.21 (1.56, 3.14) |
| Bla g 1 | NA | 0.56 (0.32, 0.97) | 0.47 (0.27, 0.83) | 1.73 (1.03, 2.91) | 0.42 (0.25, 0.71) | 3.00 (1.85, 4.87) | 2.44 (1.49, 3.98) | |
| Can f 1 | NA | 0.75 (0.56, 1.01) | 1.26 (0.85, 1.87) | 2.01 (1.39, 2.90) | 0.95 (0.70, 1.27) | 1.24 (0.80,1.91) | ||
| Der f 1 | NA | 1.81 (1.18, 2.77) | 0.93 (0.71, 1.21) | 0.99 (0.65, 1.52) | 1.00 (0.79, 1.27) | |||
| Der p 1 | NA | 1.53 (1.10, 2.13) | 1.38 (0.93, 2.05) | 1.43 (0.88, 2.33) | ||||
| Fel d 1 | NA | 1.09 (0.75, 1.57) | 1.26 (0.92, 1.72) | |||||
| MUP | NA | 1.65 (1.17, 2.32) | ||||||
| Endotoxin | NA |
The unadjusted odds ratios are calculated using dichotomous allergen/endotoxin levels (elevated level: yes vs. no). Cut points for elevated allergen levels: 10 μg/g for Der f 1, Derp 1, and Can f 1; 8 μg/g for Fel d 1; 8 U/g Bla g 1; 1.6 μg/g for MUP; and 7 μg/g for Alternaria; for endotoxin the cut-off value was 107 EU/mg (75th percentile of the average endotoxin concentration in the household)
Statistically significant associations (P<0.05) are shown in bold
NA, not applicable
Asthma and exposure to multiple allergens
Of the surveyed homes, 25.0% (SE=2.3) had at least one resident who had been diagnosed with asthma. Four or more allergens in elevated levels were present in 23.4% of asthmatic homes compared with 16.2% of non-asthmatic homes (P=0.03 for difference), indicating that homes of asthmatics were more likely to have a greater number of allergens exceeding elevated levels than homes where no asthmatic individuals resided.
Among the study participants, lifetime prevalence of doctor-diagnosed asthma was 11.2%, and 6.9% of the study subjects reported active asthma symptoms in the past 12 months. The majority of the current asthmatics (77%) reported doctor-diagnosed allergies. We examined whether increased burden of exposure to multiple allergens was associated with the prevalence of current symptomatic asthma. Table IV shows separate odds ratios for atopic and non-atopic individuals because the observed effect was modified by atopic status. After adjusting for potential confounders, high exposure burden significantly increased the odds of having asthma symptoms in the past year (OR = 1.81, 95% CI: 1.04-3.15) among atopic individuals. This association was not seen in non-atopic individuals. Reported wheezing was not associated with high allergen burden (data not shown). The majority (69.9%) of those who reported wheezing in the past year did not report asthma symptoms. Since wheezing was not restricted to asthma, diseases other than asthma may have contributed to wheezing. Of the current asthmatics, 71.2% used asthma medication. In atopic individuals, high allergen burden was associated with asthma symptoms irrespective of medication use; among atopics, the odds ratio (unadjusted) was 1.91, 95% CI 1.15 to 3.17 for asthmatics who used medication, and 2.04, 95% CI 0.95 to 4.38 for those who did not use medication.
TABLE IV.
Current asthma in relation to high allergen burden (4 or more allergens exceeding elevated levels in the home), stratified by atopic status
| Logistic models | Current asthma OR (95% CI) | p-value for interaction |
|---|---|---|
| Unadjusted model | ||
| All subjects | 1.57 (0.99, 2.50) | |
| Diagnosed allergies* | 0.03 | |
| No | 0.65 (0.25, 1.69) | |
| Yes | 2.18 (1.28, 3.69) | |
| Adjusted model† | ||
| All subjects | 1.39 (0.91, 2.14) | |
| Diagnosed allergies* | 0.07 | |
| No | 0.62 (0.24, 1.60) | |
| Yes | 1.81 (1.04, 3.15) |
Atopy assessed by reported doctor-diagnosed allergies
Adjusted for age, gender, race, education, smoking, season, and endotoxin levels; (current asthma/no current asthma [n/N] = 165/1788)
DISCUSSION
Exposure to multiple indoor allergens in US homes is common; over half of the surveyed homes had detectable levels of all studied allergens (dust mite, dog, cat, cockroach, mouse, and Alternaria) and most homes had 2-3 allergens in elevated levels. Occupants’ race, income level, housing type, absence of children, and presence of smokers, pets, cockroaches, rodents and mold/moisture related problems contributed independently to high allergen burden in the home. Households with asthmatics were more likely to have a greater number of elevated allergens than households without asthmatics. Among atopic individuals, high allergen burden in the home significantly increased the odds of having asthma symptoms.
The NSLAH was the first study to characterize how indoor allergen exposures vary in homes throughout the US. Of the measured allergens, Alternaria, cat, and dog allergens were the most commonly detected and they were also the ones that were most often found in elevated levels. Individual allergen levels were strongly associated with regional, ethnic, and socioeconomic factors, but each allergen appeared to have a distinct set of predictors.15-19 Consistent with previous studies,9, 28, 29 allergen levels in homes varied by location in the home.
Beyond individual allergen exposures, it is important to characterize which factors contribute to total allergen burden in homes. The NSLAH data suggested that one of the strongest predictors of high allergen burden was race; burden of exposure was significantly higher among Whites than non-White residents. White households were more likely to have elevated levels of Alternaria, cat, dog, and dust mite (Der f 1) allergens than non-White households, whereas the presence of cockroach and mouse allergens in elevated levels was significantly more prevalent in non-White households.
Family income influenced allergen burden significantly; households with lower income (<$40,000) were more likely to have high allergen burden than households with higher income levels (23.3% vs. 11.9%, p < 0.01 for difference). The prevalence of elevated levels of cockroach, mouse and dust mite (Der p 1) allergens was significantly higher in homes with lower income. Although elevated cat and dog allergen levels were strongly associated with higher income levels, the majority of the homes with high allergen burden and lower income (<$40,000) had elevated cat and dog allergen levels (73.0% and 74.5%, respectively). Living in a single family home was a strong predictor of high allergen burden. Except for cockroach and mouse allergens, elevated allergen levels were more prevalent in single family homes than in multi-family homes; differences were statistically significant for Alternaria, dog, and dust mite (Der p 1) allergens. Consistent with published literature, the presence of elevated cockroach allergen was significantly higher in multi-family homes.10, 30 Previous studies suggest that allergen levels are not only associated with socioeconomic factors and ethnicity, but are also influenced by environmental factors that tend to differ between housing types (e.g., temperature and humidity levels, differences in likelihood of having pets).9, 10, 30
Smoking is typically associated with socio-economic factors,31 but the presence of smokers remained an independent predictor of high allergen burden in our multiple regression models. In particular, elevated levels of cockroach and dog allergen levels were more frequently detected in homes of smokers than in homes of non-smokers. Interestingly, homes with children were less likely to have high allergen burden. It is possible that cleaning frequency is higher in homes where children reside. Indeed, presence of smokers and less frequent cleaning have been found to contribute elevated dust weight levels in homes.32
As expected, the presence of pets, cockroaches and rodents in the home predicted high allergen burden. The presence of pets was the strongest predictor of allergen burden; pets in the home, particularly cats and dogs, increased the odds of having high allergen burden by 3-fold. Other recent studies have also shown that signs of roach and rodent activities in the home tend to predict elevated levels of cockroach and mouse allergens.33, 34 The reported presence of roaches and rodents contributed significantly to elevated cockroach and mouse allergen levels, whereas the presence of household pests tended to be inversely associated with elevated levels of cat, dog, and dust mite (Der f 1) allergens, which is consistent with previous findings.9, 10 Mold and moisture related problems were not only associated with elevated fungal (Alternaria) levels but also with elevated levels of several other allergens, including dust mite (Der p 1), cockroach, cat, and mouse allergens, in agreement with published work.35
Although regional factors can influence allergen-specific levels significantly,8 census region and level of urbanization (MSA) did not remain significant predictors of high allergen burden in US homes. The relative importance of different allergens may vary regionally. For example, Alternaria, cat, and dust mite levels differed significantly by census region; and concentrations of Alternaria and cockroach allergen were strongly associated with level of urbanization.15-17,19 Nevertheless, geographic and climatic factors seemed to play a less significant role in overall exposure burden. Racial and socioeconomic factors are strongly associated with the exposure burden and types of allergens that are present in elevated levels. However, high exposure burden to multiple allergens is not limited to populations that have been found to be at disproportionately high risk for adverse asthma outcomes (e.g., children in inner-city neighborhoods of low socio-economic status and high minority representation).36
Our analyses showed that allergens tend to cluster together in high levels. We found strongest positive associations between the following allergens: mouse and cockroach, Alternaria and dust mite (Der p 1), Alternaria and mouse, and cat and dog allergens. On the contrary, elevated concentrations of cockroach allergen were inversely associated with elevated levels of cat, dog, and dust mite (Der f 1) allergens. It is likely that both socio-demographic and environmental factors contribute to the observed patterns.
We found that endotoxin levels increased with increasing allergen burden. Our results suggest that residents who have high exposure burden to allergens are also apt to be exposed to elevated levels of endotoxin in their home environment. Elevated endotoxin levels were particularly associated with elevated Alternaria, cockroach and mouse allergen levels. Thorne and coworkers have previously shown that household endotoxin exposure is associated with asthma-related outcomes in this population.13
Many studies have shown that exposure to allergens contributes to exacerbation of allergic asthma and persistence of symptoms.4, 6, 37 Our results reinforce the important role of indoor allergen exposures in asthma exacerbations. Among atopic individuals, high allergen burden in the home was significantly associated with current asthma. Atopy per se, however, was not associated with high allergen burden. We did not have detailed information on subjects’ asthma severity, but high allergen burden was associated with asthma symptoms among atopics irrespective of medication use. Although allergen exposure and sensitization have been predominantly linked to asthma morbidity among children, it has been shown that this relationship also persists in older populations.38, 39 We did not find strong evidence that the observed effect differed significantly by age, although the point estimate was higher among children than adults (data not shown). The association between asthma symptoms and high burden of allergens remained consistent after adjusting for potential confounders, including exposure to endotoxin.
Temporal relationships may be difficult to determine in cross-sectional studies. To reduce bias due to temporal changes over time, we focused primarily on asthma symptoms in the past year. We were not able to ascertain allergen-specific sensitization among the participants but assessed atopy based on self-reported physician-diagnosed allergies. We used the reservoir concentration as a surrogate measure of recent exposure, which may not necessarily reflect personal exposure levels. For example, activity levels of subjects, occupant density, air exchange rates, and air movement within the indoor environment can affect individual exposure levels. While airborne concentrations are considered more relevant measures of exposure, single time point air sampling for aeroallergens and endotoxin is usually a weak exposure measure because of large within-subject variance due to temporal, spatial, and activity-related effects. In general, using allergen concentrations in dust as a proxy of exposure is an accepted and widely used method to assess indoor allergen exposures, particularly in large-scale epidemiological studies. To characterize the exposures in detail, we assessed exposure levels across multiple sampling locations. Although we were not able to assess seasonal variability in allergen levels in individual homes, sampling in the survey was conducted throughout summer, fall, and winter months in each geographic region to capture seasonal variation in the data. We acknowledge that the literature-derived cut points used to assess the allergen burden are somewhat arbitrary, and need to be interpreted with caution. The thresholds may be influenced by host factors and are not well established for all allergens. For example, clinically relevant exposure levels for Alternaria remain unknown because immunoassays to assess fungal exposures (antigens and allergens) have not yet attained the same reliability as have similar assays for other allergens. The possibility of fungal cross-reactivity cannot be excluded in the current study, but exposure to Alternaria was estimated with the best available assay that minimizes cross-reactivity between genera.20 Despite the limitations, this study provides valuable information about allergen burden and variability across the US housing stock.
One of the greatest strengths of this study is that the weighted characteristics of the survey sample, including distributions of housing characteristics, socioeconomic, and demographic factors, were very similar to characteristics obtained from other national surveys.14 Moreover, the prevalence of asthma in this population was comparable to other national prevalence estimates.2, 40
This study demonstrated that exposure to multiple indoor allergens in US homes is common. Residential allergen burden and the variability of allergens that are present in elevated levels were strongly affected by sociodemographic factors and the presence of apparent sources of allergens in the home. Allergen burden was also strongly associated with endotoxin levels in the home. Current asthma was positively associated high allergen burden among atopic individuals, suggesting that atopic asthmatics may achieve better asthma control by reducing allergen burden at home. Our results highlight the importance of exposure reduction as a fundamental part of asthma management.
AKNOWLEDGEMENTS
We thank all study participants and Westat Inc., who assisted in the conduction of the survey. We acknowledge Drs. Stephanie London and Donna Baird for their helpful comments during the preparation of this manuscript.
This research was supported in part by the Intramural Research Program of the NIH, National Institute of Environmental Health Sciences and by the US Department of Housing and Urban Development.
Abbreviations
- ANOVA
Analysis of variance
- Bla g 1
Blattella germanica 1 (Roach allergen)
- Can f 1
Canis familiaris 1 (Dog allergen)
- CI
Confidence interval
- Der f 1
Dermatophagoides farinae 1 (Dust mite allergen)
- Der p 1
Dermatophagoides pteronyssinus (Dust mite allergen)
- Fel d 1
Felis domesticus 1 (Cat allergen)
- MSA
Metropolitan statistical area
- MUP
Mouse urinary protein (Mouse allergen)
- NIEHS
National Institute of Environmental Health Sciences
- NSLAH
National Survey of Lead and Allergens in Housing
- OR
Odds ratio
Footnotes
Capsule summary
In a nationally representative survey sample of US households, exposure to multiple allergens was common. Among atopic individuals, high allergen burden in the home was associated with asthma symptoms.
REFERENCES
- 1.Gergen PJ. Understanding the economic burden of asthma. J Allergy Clin Immunol. 2001;107:S445–8. doi: 10.1067/mai.2001.114992. [DOI] [PubMed] [Google Scholar]
- 2.Center for Disease Control and Prevention . Asthma: National Health Interview Survey (NHIS) Data. Atlanta, GA: 2006. [Cited 2007 April 9.] Available from http://www.cdc.gov/asthma/nhis/default.htm. [Google Scholar]
- 3.Leech JA, Nelson WC, Burnett RT, Aaron S, Raizenne ME. It’s about time: a comparison of Canadian and American time-activity patterns. J Expo Anal Environ Epidemiol. 2002;12:427–32. doi: 10.1038/sj.jea.7500244. [DOI] [PubMed] [Google Scholar]
- 4.Committee on the Assessment of Asthma. Indoor Air, Division of Health Promotion. Disease Prevention, Institute of Medicine . Clearing the air: asthma and indoor exposures. National Academy Press; Washington (DC): 2000. [Google Scholar]
- 5.Platts-Mills TA, Vervloet D, Thomas WR, Aalberse RC, Chapman MD. Indoor allergens and asthma: report of the Third International Workshop. J Allergy Clin Immunol. 1997;100:S2–24. doi: 10.1016/s0091-6749(97)70292-6. [DOI] [PubMed] [Google Scholar]
- 6.Langley SJ, Goldthorpe S, Craven M, Morris J, Woodcock A, Custovic A. Exposure and sensitization to indoor allergens: association with lung function, bronchial reactivity, and exhaled nitric oxide measures in asthma. J Allergy Clin Immunol. 2003;112:362–8. doi: 10.1067/mai.2003.1654. [DOI] [PubMed] [Google Scholar]
- 7.Crain EF, Walter M, O’Connor GT, Mitchell H, Gruchalla RS, Kattan M, et al. Home and allergic characteristics of children with asthma in seven U.S. urban communities and design of an environmental intervention: the Inner-City Asthma Study. Environ Health Perspect. 2002;110:939–45. doi: 10.1289/ehp.02110939. [DOI] [PMC free article] [PubMed] [Google Scholar]
- 8.Gruchalla RS, Pongracic J, Plaut M, Evans R, 3rd, Visness CM, Walter M, et al. Inner City Asthma Study: relationships among sensitivity, allergen exposure, and asthma morbidity. J Allergy Clin Immunol. 2005;115:478–85. doi: 10.1016/j.jaci.2004.12.006. [DOI] [PubMed] [Google Scholar]
- 9.Kitch BT, Chew G, Burge HA, Muilenberg ML, Weiss ST, Platts-Mills TA, et al. Socioeconomic predictors of high allergen levels in homes in the greater Boston area. Environ Health Perspect. 2000;108:301–7. doi: 10.1289/ehp.00108301. [DOI] [PMC free article] [PubMed] [Google Scholar]
- 10.Leaderer BP, Belanger K, Triche E, Holford T, Gold DR, Kim Y, et al. Dust mite, cockroach, cat, and dog allergen concentrations in homes of asthmatic children in the northeastern United States: impact of socioeconomic factors and population density. Environ Health Perspect. 2002;110:419–25. doi: 10.1289/ehp.02110419. [DOI] [PMC free article] [PubMed] [Google Scholar]
- 11.Morgan WJ, Crain EF, Gruchalla RS, O’Connor GT, Kattan M, Evans R, 3rd, et al. Results of a home-based environmental intervention among urban children with asthma. N Engl J Med. 2004;351:1068–80. doi: 10.1056/NEJMoa032097. [DOI] [PubMed] [Google Scholar]
- 12.Peters JL, Levy JI, Rogers CA, Burge HA, Spengler JD. Determinants of allergen concentrations in apartments of asthmatic children living in public housing. J Urban Health. 2007;84:185–97. doi: 10.1007/s11524-006-9146-2. [DOI] [PMC free article] [PubMed] [Google Scholar]
- 13.Thorne PS, Kulhankova K, Yin M, Cohn R, Arbes SJ, Jr., Zeldin DC. Endotoxin exposure is a risk factor for asthma: the national survey of endotoxin in United States housing. Am J Respir Crit Care Med. 2005;172:1371–7. doi: 10.1164/rccm.200505-758OC. [DOI] [PMC free article] [PubMed] [Google Scholar]
- 14.Vojta PJ, Friedman W, Marker DA, Clickner R, Rogers JW, Viet SM, et al. First National Survey of Lead and Allergens in Housing: survey design and methods for the allergen and endotoxin components. Environ Health Perspect. 2002;110:527–32. doi: 10.1289/ehp.02110527. [DOI] [PMC free article] [PubMed] [Google Scholar]
- 15.Arbes SJ, Jr., Cohn RD, Yin M, Muilenberg ML, Burge HA, Friedman W, et al. House dust mite allergen in US beds: results from the First National Survey of Lead and Allergens in Housing. J Allergy Clin Immunol. 2003;111:408–14. doi: 10.1067/mai.2003.16. [DOI] [PubMed] [Google Scholar]
- 16.Arbes SJ, Jr., Cohn RD, Yin M, Muilenberg ML, Friedman W, Zeldin DC. Dog allergen (Can f 1) and cat allergen (Fel d 1) in US homes: results from the National Survey of Lead and Allergens in Housing. J Allergy Clin Immunol. 2004;114:111–7. doi: 10.1016/j.jaci.2004.04.036. [DOI] [PubMed] [Google Scholar]
- 17.Cohn RD, Arbes SJ, Jr., Jaramillo R, Reid LH, Zeldin DC. National prevalence and exposure risk for cockroach allergen in U.S. households. Environ Health Perspect. 2006;114:522–6. doi: 10.1289/ehp.8561. [DOI] [PMC free article] [PubMed] [Google Scholar]
- 18.Cohn RD, Arbes SJ, Jr., Yin M, Jaramillo R, Zeldin DC. National prevalence and exposure risk for mouse allergen in US households. J Allergy Clin Immunol. 2004;113:1167–71. doi: 10.1016/j.jaci.2003.12.592. [DOI] [PubMed] [Google Scholar]
- 19.Salo PM, Yin M, Arbes SJ, Jr., Cohn RD, Sever M, Muilenberg M, et al. Dustborne Alternaria alternata antigens in US homes: results from the National Survey of Lead and Allergens in Housing. J Allergy Clin Immunol. 2005;116:623–9. doi: 10.1016/j.jaci.2005.05.030. [DOI] [PMC free article] [PubMed] [Google Scholar]
- 20.Barnes C, Portnoy J, Sever M, Arbes S, Jr., Vaughn B, Zeldin DC. Comparison of enzyme immunoassay-based assays for environmental Alternaria alternata. Ann Allergy Asthma Immunol. 2006;97:350–6. doi: 10.1016/S1081-1206(10)60800-9. [DOI] [PMC free article] [PubMed] [Google Scholar]
- 21.Custovic A, Fletcher A, Pickering CA, Francis HC, Green R, Smith A, et al. Domestic allergens in public places III: house dust mite, cat, dog and cockroach allergens in British hospitals. Clin Exp Allergy. 1998;28:53–9. doi: 10.1046/j.1365-2222.1998.00183.x. [DOI] [PubMed] [Google Scholar]
- 22.Huss K, Adkinson NF, Jr., Eggleston PA, Dawson C, Van Natta ML, Hamilton RG. House dust mite and cockroach exposure are strong risk factors for positive allergy skin test responses in the Childhood Asthma Management Program. J Allergy Clin Immunol. 2001;107:48–54. doi: 10.1067/mai.2001.111146. [DOI] [PubMed] [Google Scholar]
- 23.Ingram JM, Sporik R, Rose G, Honsinger R, Chapman MD, Platts-Mills TA. Quantitative assessment of exposure to dog (Can f 1) and cat (Fel d 1) allergens: relation to sensitization and asthma among children living in Los Alamos, New Mexico. J Allergy Clin Immunol. 1995;96:449–56. doi: 10.1016/s0091-6749(95)70286-5. [DOI] [PubMed] [Google Scholar]
- 24.Rosenstreich DL, Eggleston P, Kattan M, Baker D, Slavin RG, Gergen P, et al. The role of cockroach allergy and exposure to cockroach allergen in causing morbidity among inner-city children with asthma. N Engl J Med. 1997;336:1356–63. doi: 10.1056/NEJM199705083361904. [DOI] [PubMed] [Google Scholar]
- 25.Sporik R, Holgate ST, Platts-Mills TA, Cogswell JJ. Exposure to house-dust mite allergen (Der p I) and the development of asthma in childhood. A prospective study. N Engl J Med. 1990;323:502–7. doi: 10.1056/NEJM199008233230802. [DOI] [PubMed] [Google Scholar]
- 26.Phipatanakul W, Eggleston PA, Wright EC, Wood RA. Mouse allergen. II. The relationship of mouse allergen exposure to mouse sensitization and asthma morbidity in inner-city children with asthma. J Allergy Clin Immunol. 2000;106:1075–80. doi: 10.1067/mai.2000.110795. [DOI] [PubMed] [Google Scholar]
- 27.Salo PM, Arbes SJ, Jr., Sever M, Jaramillo R, Cohn RD, London SJ, et al. Exposure to Alternaria alternata in US homes is associated with asthma symptoms. J Allergy Clin Immunol. 2006;118:892–8. doi: 10.1016/j.jaci.2006.07.037. [DOI] [PMC free article] [PubMed] [Google Scholar]
- 28.Breysse PN, Buckley TJ, Williams D, Beck CM, Jo SJ, Merriman B, et al. Indoor exposures to air pollutants and allergens in the homes of asthmatic children in inner-city Baltimore. Environ Res. 2005;98:167–76. doi: 10.1016/j.envres.2004.07.018. [DOI] [PubMed] [Google Scholar]
- 29.Perry TT, Wood RA, Matsui EC, Curtin-Brosnan J, Rand C, Eggleston PA. Room-specific characteristics of suburban homes as predictors of indoor allergen concentrations. Ann Allergy Asthma Immunol. 2006;97:628–35. doi: 10.1016/S1081-1206(10)61092-7. [DOI] [PubMed] [Google Scholar]
- 30.Chew GL, Higgins KM, Gold DR, Muilenberg ML, Burge HA. Monthly measurements of indoor allergens and the influence of housing type in a northeastern US city. Allergy. 1999;54:1058–66. doi: 10.1034/j.1398-9995.1999.00003.x. [DOI] [PubMed] [Google Scholar]
- 31.Center for Disease Control and Prevention . Tobacco Use Among Adults --- United States, 2005. Atlanta, GA: 2000. [Cited 2007 June 5.] Available from http://www.cdc.gov/mmwr/preview/mmwrhtml/mm5542a1.htm. [Google Scholar]
- 32.Elliott L, Arbes SJ, Harvey ES, Lee RC, Salo PM, Cohn RD, et al. Dust weight and asthma prevalence in the National Survey of Lead and Allergens in Housing (NSLAH) Environ Health Perspect. 2007;115:215–20. doi: 10.1289/ehp.9412. [DOI] [PMC free article] [PubMed] [Google Scholar]
- 33.Cho SH, Reponen T, Bernstein DI, Olds R, Levin L, Liu X, et al. The effect of home characteristics on dust antigen concentrations and loads in homes. Sci Total Environ. 2006;371:31–43. doi: 10.1016/j.scitotenv.2006.09.001. [DOI] [PMC free article] [PubMed] [Google Scholar]
- 34.Phipatanakul W, Eggleston PA, Wright EC, Wood RA. Mouse allergen. I. The prevalence of mouse allergen in inner-city homes. The National Cooperative Inner-City Asthma Study. J Allergy Clin Immunol. 2000;106:1070–4. doi: 10.1067/mai.2000.110796. [DOI] [PubMed] [Google Scholar]
- 35.Committee on Damp Indoor Spaces and Health . Damp Indoor Spaces and Health. National Academies Press; Washington (DC): 2004. [PubMed] [Google Scholar]
- 36.Gold DR, Wright R. Population disparities in asthma. Annu Rev Public Health. 2005;26:89–113. doi: 10.1146/annurev.publhealth.26.021304.144528. [DOI] [PubMed] [Google Scholar]
- 37.Illi S, von Mutius E, Lau S, Niggemann B, Gruber C, Wahn U. Perennial allergen sensitisation early in life and chronic asthma in children: a birth cohort study. Lancet. 2006;368:763–70. doi: 10.1016/S0140-6736(06)69286-6. [DOI] [PubMed] [Google Scholar]
- 38.Nelson HS. The importance of allergens in the development of asthma and the persistence of symptoms. J Allergy Clin Immunol. 2000;105:S628–32. doi: 10.1067/mai.2000.106154. [DOI] [PubMed] [Google Scholar]
- 39.Rogers L, Cassino C, Berger KI, Goldring RM, Norman RG, Klugh T, et al. Asthma in the elderly: cockroach sensitization and severity of airway obstruction in elderly nonsmokers. Chest. 2002;122:1580–6. doi: 10.1378/chest.122.5.1580. [DOI] [PubMed] [Google Scholar]
- 40.Self-Reported Asthma Prevalence Among Adults --- United States . Center for Disease Control and Prevention; Atlanta, GA: 2000. 2000. [Cited 2007 May 4.] Available from http://www.cdc.gov/mmwr/preview/mmwrhtml/mm5032a3.htm. [Google Scholar]