Abstract
Retinal blood flow in human diabetics has been reported to follow a biphasic time course in which an initial period of reduced flow and ischemia is often followed by a hyperemic and angiogenic phase in which flow can exceed normal levels. The purpose of the present study is to investigate the mechanisms of the initial decrease in flow, since early interventions could provide the most effective treatment strategies. C57BL/6 mice were injected with streptozotocin (STZ) at 12 weeks of age and remained hyperglycemic until data were gathered 4 or 8 weeks later. Experimental measurements included retinal arteriolar red blood cell velocity and arteriolar diameters, with the diameters measured prior to and following an intravenous injection of the thromboxane synthase inhibitor ozagrel (100 mg/kg). Arterioles leading out of the optic disk constricted significantly at 4 weeks post-STZ (p<0.001) compared to age-matched controls, but not at 8 weeks post-STZ. Calculations of retinal blood flow indicated a 45% decrease at 4 weeks post-STZ, but only a 26% decrease by 8 weeks. Not all arterioles constricted equally in response to STZ; the most substantial constrictions were present in arterioles that were more closely arranged with countercurrent venules leading back into the optic disk. Injection of ozagrel provided significant dilation of constricted retinal arterioles. In addition, the pattern of dilation was consistent with the sites of the most severe constriction, i.e., ozagrel-induced dilation in the STZ mice occurred to the greatest extent in the arterioles more closely paired with the venules draining the microvascular bed. In summary, STZ induces a biphasic alteration in retinal blood flow in mice, in which thromboxane contributes to the initial reduction in blood flow at 4 weeks. Moreover, the thromboxane-induced arteriolar constriction is dependent on the proximity of the retinal arterioles to countercurrent venules.
Keywords: Ozagrel, Thromboxane Synthase, Streptozotocin, Mouse, Diabetes, Retina, Microcirculation
Introduction
Diabetic retinopathy (DR) affects hundreds of thousands of Americans over the age of 18 with Type 1 diabetes mellitus (Roy et al., 2004). Human DR often proceeds to proliferative diabetic retinopathy in which new blood vessel growth occurs on the surface of the retina (Fong et al., 2003; Yam and Kwok, A. K., 2007), which can interfere with vision. Few symptoms appear prior to the proliferative phase (Yam and Kwok, A. K., 2007); however, early treatment is critical to slowing the progression of DR (1995; Yam and Kwok, A. K., 2007). In early stages of DR, retinal blood flow is reduced substantially (Clermont et al., 1997), and areas of ischemia develop. The contribution of reduced blood flow and ischemia to the eventual disease progression needs further investigation, with the possibility that ischemia could lead to the production of potentially pathological mediators such as vascular endothelial growth factor. As the disease progresses, retinal blood flow increases toward control levels and even exceeds controls when the severity of retinopathy extends beyond microaneurysms only (Clermont et al., 1997).
Animal models of diabetes are used to study the early retinal consequences of hyperglycemia. Diabetic retinopathy is known as a microvascular pathology, and therefore several investigations in diabetic animals have focused on events such as microvascular accumulation of leukocytes and platelets, capillary dropout, altered retinal perfusion, and hypoxia (de Gooyer et al., 2006; De La Cruz et al., 1998; De La Cruz et al., 2000; Joussen et al., 2001; Linsenmeier et al., 1998; Moreno et al., 1995; Yamashiro et al., 2003). However, the mechanisms of early reductions in blood flow in animal models have not established the molecular mediators involved. One such potential mediator is the potent vasoconstrictor thromboxane, which has been implicated in the reduced capillary density found in the streptozotocin-induced rat model of type I diabetes (De La Cruz et al., 1998; De La Cruz et al., 2000; De La et al., 2002; Moreno et al., 1995).
Thromboxane-induced vasoconstriction has been investigated in other animal models of inflammation, including ischemia-reperfusion (Mazolewski et al., 1999) and dextran sodium sulfate-induced intestinal inflammation (Harris et al., 2005). In these two models, the vasoactive influence of the constrictor appears to be dependent on the physical arrangement of arterioles and venules in the microvascular bed: thromboxane-induced vasoconstriction of arterioles depends on the proximity of the arteriole to the inflamed venules in which platelets and leukocytes accumulate.
In most microvascular beds of the body, arterioles and venules are found in a close, countercurrent pairing, which can be utilized in feedback regulation of blood flow. This regulation can take the form of venule-induced dilation, for example, in the functional hyperemia that delivers more blood flow upon demand (Hester and Hammer, L. W., 2002). In contrast, venule-dependent arteriolar constriction has been reported to occur with inflammatory conditions such as ischemia-reperfusion and hypercholesterolemia (Harris, 1999; Kim et al., 2007; Zamboni et al., 1993). In the retina, alternating arterioles and venules extend from (and into, respectively) the optic disk, and therefore, it could be expected that venule-dependent modulation of arteriolar flow could be enhanced in the arterioles that are more closely paired with the draining venules.
Therefore, the aims of the present study were to 1) investigate the extent of arteriolar constriction and retinal blood flow at early time points following induction of hyperglycemia (4 and 8 weeks), 2) determine whether the constriction of arterioles is mediated by thromboxane, and if so, 3) determine whether the thromboxane-dependent arteriolar constriction is more severe in arterioles that are more closely paired with draining venules.
Materials and methods
2.1. Animals
Animals were treated in accordance with the ARVO Statement for the Use of Animals in Ophthalmic and Vision Research. C57BL/6 mice (Jackson Laboratories), twelve weeks old, were randomly chosen for intraperitoneal (i.p.) injection of streptozotocin (STZ; Sigma, St. Louis, MO; 200 mg/kg dissolved in pH 4.5 sodium citrate buffer) or sodium citrate buffer alone. Animals were injected within 15 minutes of mixing STZ into solution. Separate experimental groups were used for measurements of red blood cell velocity, mean arterial pressure, intraocular pressure, diameters (arteriolar and venular), and capillary density. Analysis of mean circulation time was completed in the same group of animals used for diameter measurements. The preceding measurements were obtained four weeks or eight weeks after injection of STZ or buffer alone. Blood glucose was checked using a One Touch Ultra Glucometer (Milpitas, CA) on the sixth day following STZ injection and on the day of the experimental measurements. Mice injected with STZ were included in the study if non-fasting blood glucose exceeded 250 mg/dl on day six following injection and on the day of the experiment.
Mice injected with STZ were injected subcutaneously with insulin (Eli Lilly & Co., Indianapolis, IN; 1 unit/kg) starting on day six and twice per week thereafter. Insulin was stopped at least 48 hours prior to the experimental measurements. All mice were given access to standard chow and drinking water; body weight was recorded twice per week. On the day of the experiment mice were anesthetized by an intramuscular (i.m.) injection of 50 mg/kg Nembutal sodium (pentobarbital) solution, followed 4 min later by an i.m. injection of 50 mg/kg ketamine. At the conclusion of the experiment, mice were killed with a pentobarbital overdose (150 mg/kg).
2.2. Arteriolar and Venular Diameter
After mice were anesthetized, the femoral vein was cannulated. Mice were placed on the left side of the body with gauze sponges under the head for positioning under the microscope. Next, the right eye was dilated with 1 drop of Tropicamide Ophthalmic Solution USP 1% (Falcon Pharmaceuticals Ltd., Ft. Worth, TX) followed with 1 drop of Gonak™ Hypromellose Ophthalmic Demulcent Solution, 2.5% (Akron Inc., Buffalo Grove, IL). A 5-mm glass cover slide was placed over the right eye. The optic disk was located under the microscope and placed in the center of the field of view. A 40-60 µl bolus of 4.5 mg/kg FITC-dextran (MW 2,000,000) was injected while images were being recorded to determine the vessel type (arteriole vs venule), followed by sequential focusing on each of the alternating arterioles and venules. Vessels were visualized using a Nikon Eclipse E600FN with an attached CoolSNAP ES camera (Photometrics, Tucson, AZ). Images were captured using a 10x objective through a Nikon B-2E/C filter. Images were captured and analyzed using NIS Elements Basic Research software version 2.1–2.3 (Nikon Instruments Inc., Melville, NY). Following capture of the baseline images, the specific thromboxane synthase inhibitor ozagrel (Sigma) was infused over 5–9 minutes into the femoral vein at a dose of 100 mg/kg (Harris et al., 2005). Retinal vessel images were recorded a second time, 25 min after beginning the infusion of ozagrel.
2.3. Velocity of Blood
Red blood cells (RBCs) were labeled as previously described in detail (Braun et al., 2002; Unthank et al., 1993). Briefly, RBCs were taken from age-matched donor mice and collected in a 1-ml syringe containing 100 µl of anticoagulant citrate dextrose (ACD; Sigma, St. Louis, MO). Whole blood was passed through a 5-ml syringe with 1 g of cotton and washed with 10 ml of phosphate buffered saline (PBS; Sigma, St. Louis, MO; pH 7.4). Whole blood was centrifuged, the supernatant removed and the pellets resuspended in 1 ml PBS. Pellets were then centrifuged and washed an additional 2x in PBS. Red blood cells were labeled with 1,1’-dioctadecyl-3,3,3’,3’-tetramethyl-indocarbocyanine perchlorate (DiI; Invitrogen Molecular Probes, Eugene, OR) and washed 5x in PBS. RBCs (100 µl DiI-labeled) were then resuspended in 1.1 ml PBS.
Using the same general methods described above, mice were prepared for intravital microscopy in separate experiments. Labeled RBCs were infused at a rate of 12 µl/min with an infusion pump (Harvard Apparatus, South Natick, MA) for 14 min. Images were captured using a 10x objective through a Nikon Y-2E/C TR filter (excitation wavelength 540–580 and emission wavelength 600–660). Images were captured and analyzed using NIS Elements Basic Research software version 2.1–2.3 (Nikon Instruments Inc., Melville, NY). With a video camera exposure time of 10 ms, DiI-labeled RBCs appeared as fluorescent streaks in the vessels, with the length of the streak proportional to the velocity of the RBC. RBC velocities were recorded in each vessel leading into or out of the optic disk for a minimum of 6 seconds per vessel. Velocities were measured within 600 µm of the optic disk. Ten consecutive RBC streaks were averaged per vessel, with the mean reported in mm/sec. To confirm whether a vessel was an arteriole or a venule, a 50–60 µl bolus of FITC dextran (2,000,000 MW), at a concentration of 4.5 mg/kg dissolved in saline, was injected i.v.: vessels in which FITC-dextran appeared first were considered arterioles.
2.4. Mean Arterial Pressure
For measurements of carotid arterial pressure, mice were anesthetized as stated above, the carotid artery was cannulated, and mean arterial pressure (MAP) was recorded immediately and repeated at 10, 20, 30, and 40 min following cannulation. Air temperature around the mice was kept at 34–36 C° throughout the pressure measurements, which were obtained with a Pressure Monitor BP-1 (World Precision Instruments, Sarasota, FL).
2.5. Intraocular Pressure
Intraocular pressure (IOP) was taken using methods previously reported (Reitsamer et al., 2004) with slight modifications. Briefly, IOP was taken using the TonoPen XL® (Mentor, Norwell, MA), without the latex cap. Calibration of the Tono-Pen® XL was completed according to the manufacture’s guidelines. Following anesthesia (as described above), 20 measurements were taken in the right eye, within 6 min of anesthesia. One drop of normal saline was placed on the eye following every three measurements to keep the eye moist. The Tonopen was cleaned between each measurement by gently wiping with an alcohol gauze pad. Use of the Tonopen has been reported to be an acceptable non-invasive method to measure IOP in mice; however, many readings must be taken and averaged together while eliminating readings that could be artifacts (Moore et al., 1993; Reitsamer et al., 2004). In our study, all measurements < 6 mmHg were excluded from analysis, as these readings could represent light touches of the cornea with the tip of the tonopen or readings generated when the tip breaks contact with the cornea (Moore et al., 1993).
2.6. Mean Circulation Time
Mean circulation time (MCT) was calculated in the same group of animals in which diameters were measured, using the vascular fluorescent intensity of the injected FITC-dextran during the baseline period. Retinal MCT was calculated based on methods previously described (Bulpitt and Dollery, C. T., 1971; MEIER and ZIERLER, K. L., 1954; Tomic et al., 2001). Vascular intensity measurements were taken in the middle of each vessel 150 to 250 µm from the center of the optic disk. Vessel intensity was quantified every 100 ms starting one to two frames prior to the arteriolar appearance of FITC-dextran continuing until the intensity of the arteriole and venule reached a new steady level. Data from a minimum of three arterioles and three venules were averaged to determine the intensity profile with respect to time. MCT was calculated as the arterio-venular difference in the sum of intensity × time, divided by the sum of intensities (Bulpitt and Dollery, C. T., 1971; MEIER and ZIERLER, K. L., 1954).
2.7. Capillary Density
Capillary density measurements were taken in a separate group of animals. Retinal flat mounts were performed using methods previously described with a slight modification (D'Amato et al., 1993; Spierer et al., 2005). Briefly, mice were anaesthetized as previously stated. The femoral vein was cannulated and a 40–60 µl bolus of 4.5 mg/kg FITC-dextran (MW 2,000,000) was injected and allowed to circulate for 2 min, followed by a second infusion of FITC-dextran (100 µl over 4 min). Mice were killed with overdose of pentobarbital. Eyes were enucleated and placed in Phosphate-buffered 4% paraformaldehyde (FD NeuroTechnologies Inc., Baltimore, MD) for 1 hour. The retina was separated from the lens, vitreous, and pigment epithelium then relaxed with 3–4 radial cuts and mounted with Vectashield® mounting medium (Vector Laboratories, Burlingame, CA). Images were collected in the central and peripheral retina using a 10x objective attached to a Nikon Eclipse E600FN microscope. Images were captured and analyzed using NIS Elements Basic Research software version 2.30 (Nikon Instruments Inc., Melville, NY). One image taken within 1200 µm of the optic disc and one within 1200 µm of the peripheral retina was analyzed. The image was displayed on the computer screen and the software was calibrated for distance based on pixel size. Lines were drawn over the vessels and the sum of all lengths of capillaries was determined. Total capillary length was normalized to area of retina analyzed. Images were focused in a manner which allowed all three capillary layers to be visualized and analyzed.
2.8. Arterio-venular pairing
In the retina, alternating arterioles and venules extend from (and to) the optic disk in an approximate radial fashion, with variable angles between each arteriole and the two nearest venules. If molecular diffusion occurs between the alternating vessels, the more closely paired vessels could be more influential, and therefore a weighted average of the two angles was calculated, with the weighting favoring the smaller of the two: 2 × smaller angle × larger angle / (smaller angle + larger angle), which for two similar angles, approximates the simple mean. When the less common pattern occurred of an arteriole between one neighboring arteriole and one neighboring venule, only the angle to the venule was considered.
2.9. Statistics
Results are expressed as mean ± standard error of the mean. Statistical analysis was performed with GraphPad Instat version 3.05 software. A p-value < 0.05 was considered statistically significant. ANOVA with Bonferroni correction was performed on multiple group comparisons. Unpaired T-tests were performed in comparisons of body weight between control vs diabetic mice.
Results
3.1. Animal Data
On the day of STZ injection, there was no difference in body weight between the four groups of mice (Table 1). After four weeks and eight weeks of hyperglycemia, body weight was statistically lower in STZ-injected animals compared with age-matched control animals on the day of experimental measurements. Streptozotocin induced an approximate 2–3 fold increase in non-fasting plasma glucose levels. The measurement range of the glucometer was limited to ≤ 600 mg/dl, and therefore we report median values (Table 1).
1.
Body weight and glucose values of mice injected with streptozotocin (STZ) or vehicle alone (Control) in the 4-week and 8-week protocols.
| Day of injection | Day 6 after injection | Day of experiment | |||||
|---|---|---|---|---|---|---|---|
| Group | Control | STZ | Control | STZ | Control | STZ | |
| Weight (g) | 4 week | 26.1 ± 0.3 | 26.1 ± 0.3 | 28.3 ± 0.5 | 21.6 ± 0.5***, † | ||
| 8 week | 25.8 ± 0.3 | 26.0 ± 0.3 | 28.6 ± 0.3 | 23.4 ± 0.4*** | |||
| Glucose (mg/dl) | 4 week | 160 | 451 | 176 | 506 | ||
| 8 week | 164 | 392 | 182 | 434 | |||
Glucose levels are reported as median values.
p<0.05: 4 week STZ vs 8 week STZ
p<0.001: STZ vs Control.
3.2. Retinal Vascular Diameters
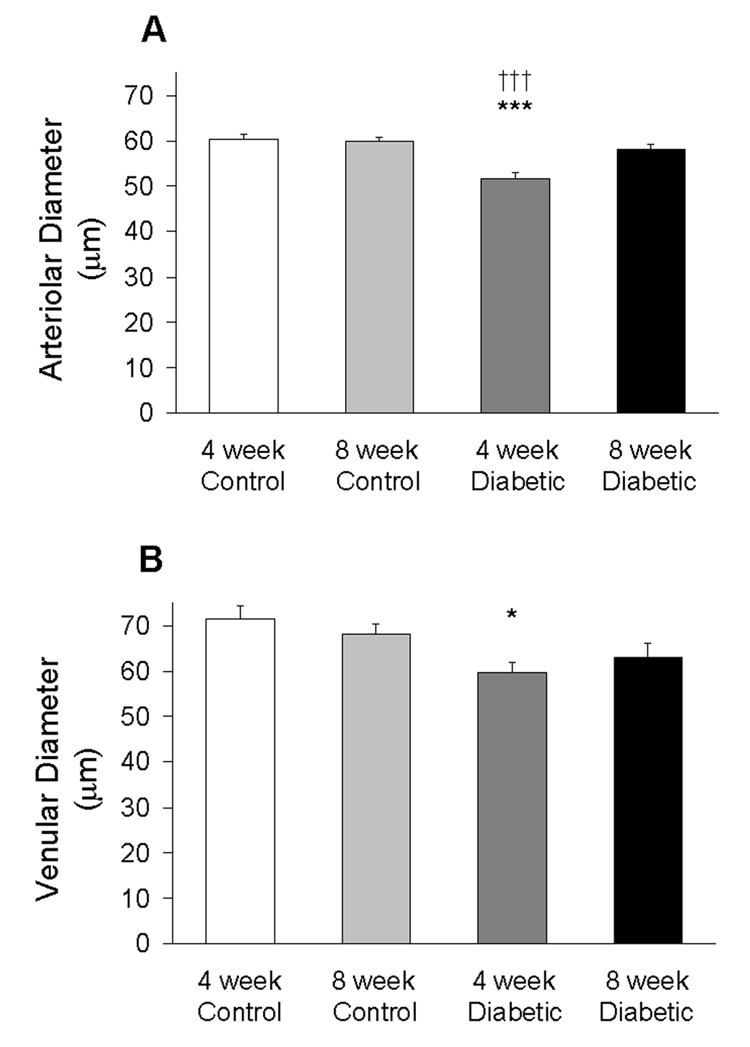
Vascular diameters were measured at three separate distances, 50–75 µm apart, along the length of the vessel. The three measurements were then averaged for analysis. As shown in Figure 1A, there was a significant decrease in arteriolar diameter in the 4-week STZ-injected animals compared to age-matched controls, 51.6 ± 1.6 µm vs 60.4 ± 1.1 µm, respectively (p<0.001). There was no difference in arteriolar diameters in 8-week STZ-injected animals compared to age-matched controls, 58.1 ± 1.2 µm vs 59.9 ± 0.9 µm, respectively. Arteriolar diameters at 4 weeks of STZ were significantly smaller than at 8 weeks of STZ (p<0.001).
1.
Retinal arteriolar (A) and venular (B) diameter in the four groups of mice. Data were obtained from N=41–50 arterioles and N=37–49 venules using 7–9 mice per group. *p<0.05 vs 4-week Control; ***p<0.001 vs 4-week Control; †††p<0.001 vs 8-week Diabetic.
As shown in Figure 1B, there was a significant decrease in venular diameter in the 4-week STZ-injected animals compared to age-matched controls, 59.7 ± 2.3 µm vs 71.4 ± 2.9 µm, respectively (p<0.05). The tendency for smaller venular diameters in 8-week STZ-injected animals (63.1 ± 3.0 µm) compared to age-matched controls (68.1 ± 2.4 µm) was not determined to be statistically different.
3.3. Retinal Red Blood Cell Velocity
Red blood cell velocities were measured from each arteriole leaving the optic disk, using an average of 10 cells per vessel. In control animals, arteriolar red blood cell velocity averaged 23.0 ± 0.5 mm/sec (4-week controls) and 22.5 ± 0.4 mm/sec (8-week controls). However, as shown in Table 2, arteriolar velocities were significantly lower (p<0.001 vs time-matched controls) in the 4-week (17.6 ± 0.4) and 8-week (17.7 ± 0.4) STZ mice.
2.
Retinal arteriolar velocity, mean circulation time, and pressure data.
| Group | Control | STZ-injected | |
|---|---|---|---|
| Retinal arteriolar velocity (mm/s) | 4 week | 23.0 ± 0.5 | 17.6 ± 0.4*** |
| 8 week | 22.5 ± 0.4 | 17.7 ± 0.4*** | |
| Mean Arterial Pressure (mmHg) | 4 week | 68.2 ± 2.0 | 68.2 ± 2.0 |
| 8 week | 66.9 ± 2.9 | 82.2 ± 3.2**, † | |
| Intraocular Pressure (mmHg) | 4 week | 11.6 ± 0.4 | 11.7 ± 0.8 |
| 8 week | 12.6 ± 0.3 | 11.3 ± 0.9 | |
| Mean Circulation Time (ms) | 4 week | 969 ± 111 | 1191 ± 193 |
| 8 week | 927 ± 170 | 1066 ± 90 |
Velocity data were obtained from N=27–71 arterioles using 5–13 mice per group. Mean arterial pressure (N=4–7 mice per group); Intraocular pressure (N=5–8 mice per group); Mean circulation time (N=5–9 mice per group).
p<0.001: STZ vs Control
p<0.01: STZ vs Control
p<0.05: 8 week STZ vs 4 week STZ.
3.4. Mean Arterial and Intraocular Pressures
Mean arterial pressure (MAP) was measured and averaged over five time points during a 40-min span. As shown in Table 2, there was no difference in MAP between 4-week control and 4-week STZ-injected animals; 68.2 ± 2.0 mm/Hg vs 68.2 ± 2.0 mm/Hg, respectively. However, there was an increase in MAP in 8-week STZ-injected animals compared to 8-week control, 82.2 ± 3.2 mm/Hg vs 66.9 ± 2.9 mm/Hg, respectively (p<0.01). MAP also was significantly higher in 8-week STZ-injected animals compared to 4-week STZ-injected animals (p<0.05). There was no statistically significant difference in intraocular pressure between any groups, with pressures averaging between 11.3–12.6 mmHg (Table 2).
3.5. Mean Circulation Time
Mean retinal circulation time was measured in the same group of animals in whom arteriolar diameter was measured, except in a few mice in which the clarity of the image prevented analysis at the time the dye was entering and/or leaving the retinal microcirculation. The mean circulation times are given in Table 2: the STZ-induced tendencies for a 23% increase at 4 weeks, and 15% increase at 8 weeks, were not determined to be statistically significant.
3.6. Capillary Density
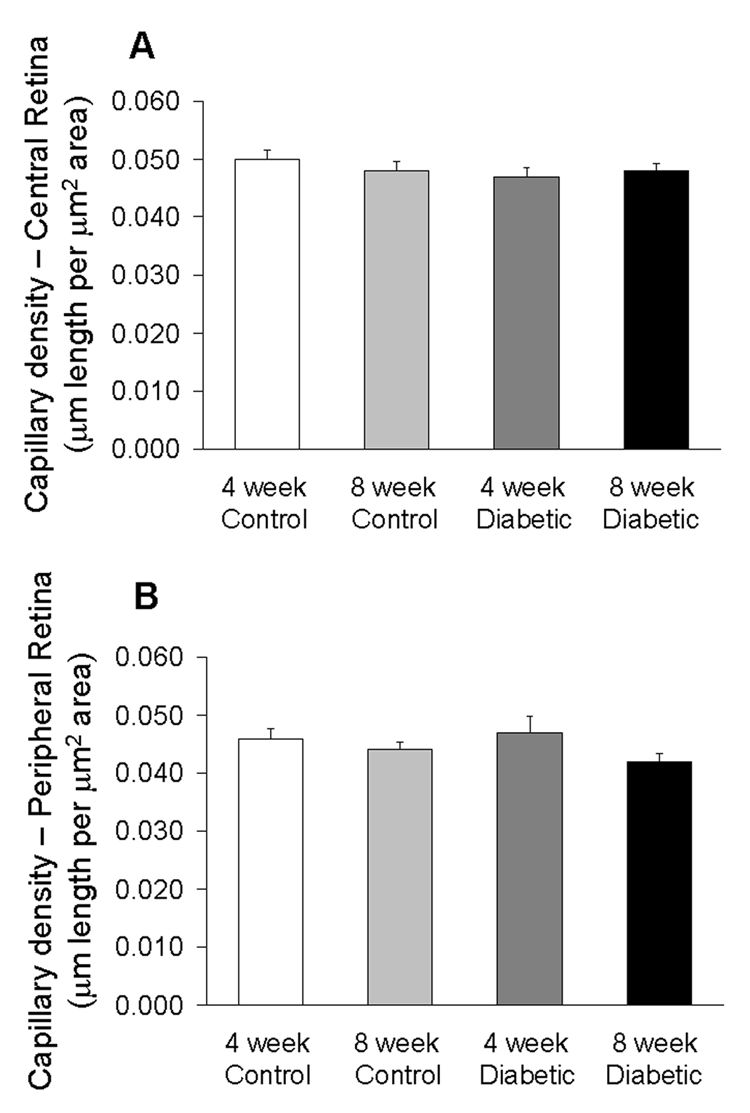
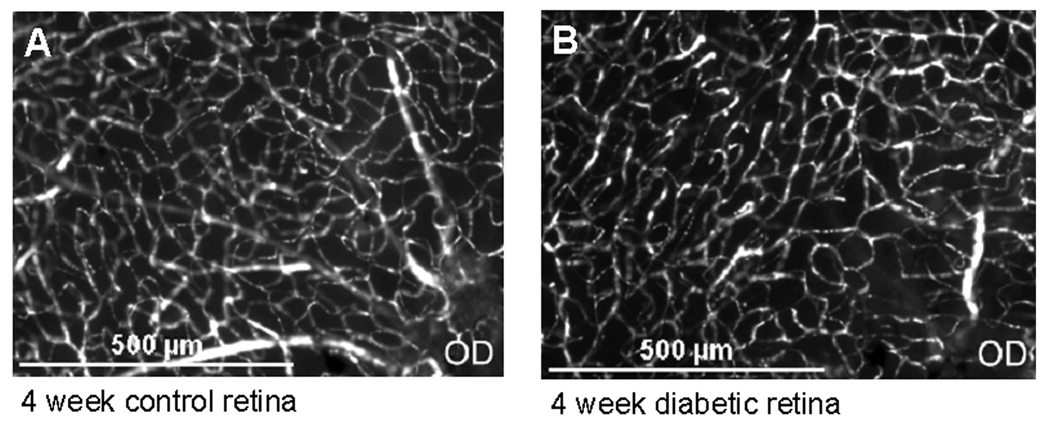
Capillary density was measured and quantified as the length of capillaries (µm) per area of tissue (µm2). There was no difference in capillary density in either the central retina or in the peripheral retina among the four groups as shown in Figure 2. Figure 3 shows representative images of the central retinas in control and diabetic mice.
2.
Capillary density near the optic disk (central retina, A) and near the retinal periphery (B) in the four groups of mice. Data were obtained from N=5–7 mice per group.
3.
Microscopic image of capillaries in the central retina. (A) control mouse, and (B) mouse injected 4 weeks earlier with streptozotocin. OD = Optic disc.
3.7. Arterio-Venular Pairing Angle Distribution
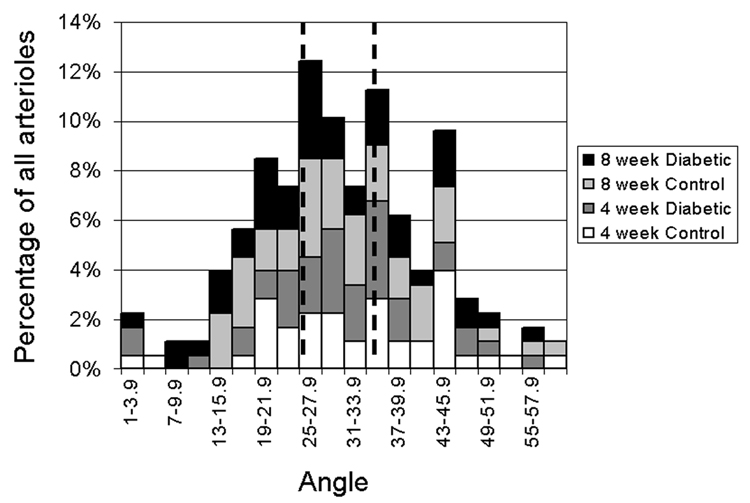
Retinal arterioles are found in an alternating arrangement with venules, with variable angles between the arterioles and venules. The two venular angles for each arteriole were averaged (weighted toward the smaller angle as described in the Methods), with the distribution in all groups shown in Figure 4. Arterioles then were segregated into groups of 1/3 of the distribution each: closer (<25.1°); intermediate (25.1–35.1°), and more distant (>35.1°) pairing. The median weighted angle was 29.6°.
4.
Distribution of arterio-venular pairing angles near the optic disk in the four groups of mice. Data were divided into three equal tertiles of smallest (<25.1°), intermediate (25.1–35.1°), and largest (>35.1°) angles. The angles represent a weighted average of the angles between the arteriole and the two neighboring venules as described in the text.
3.8. Arteriole Diameter - Ozagrel
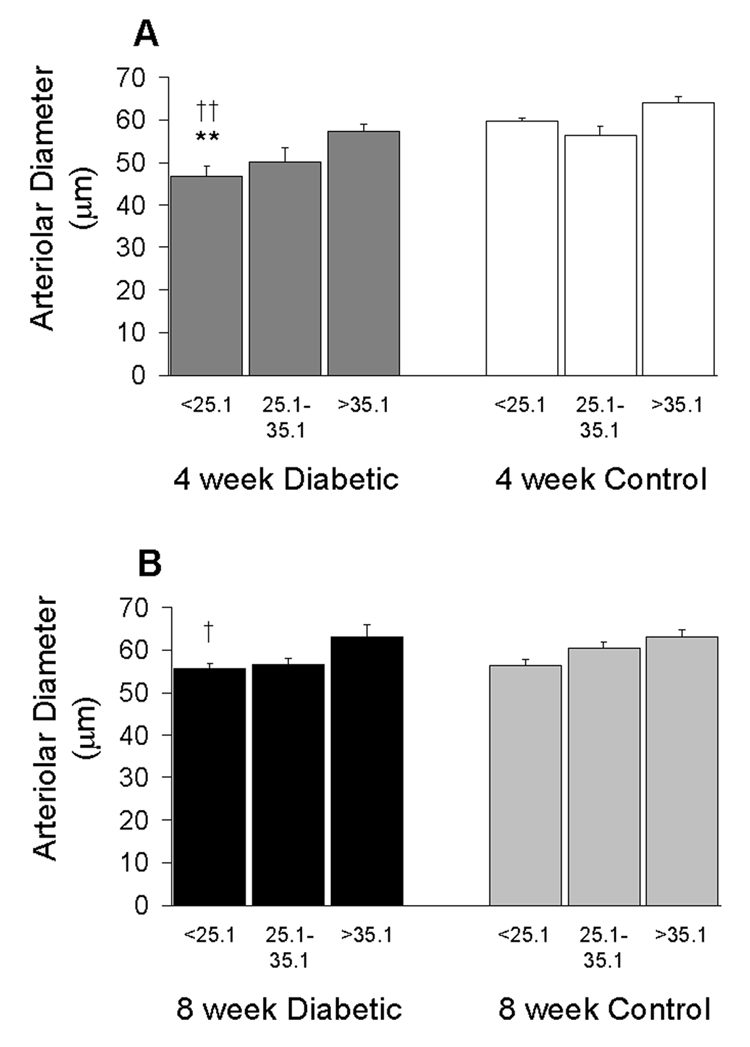
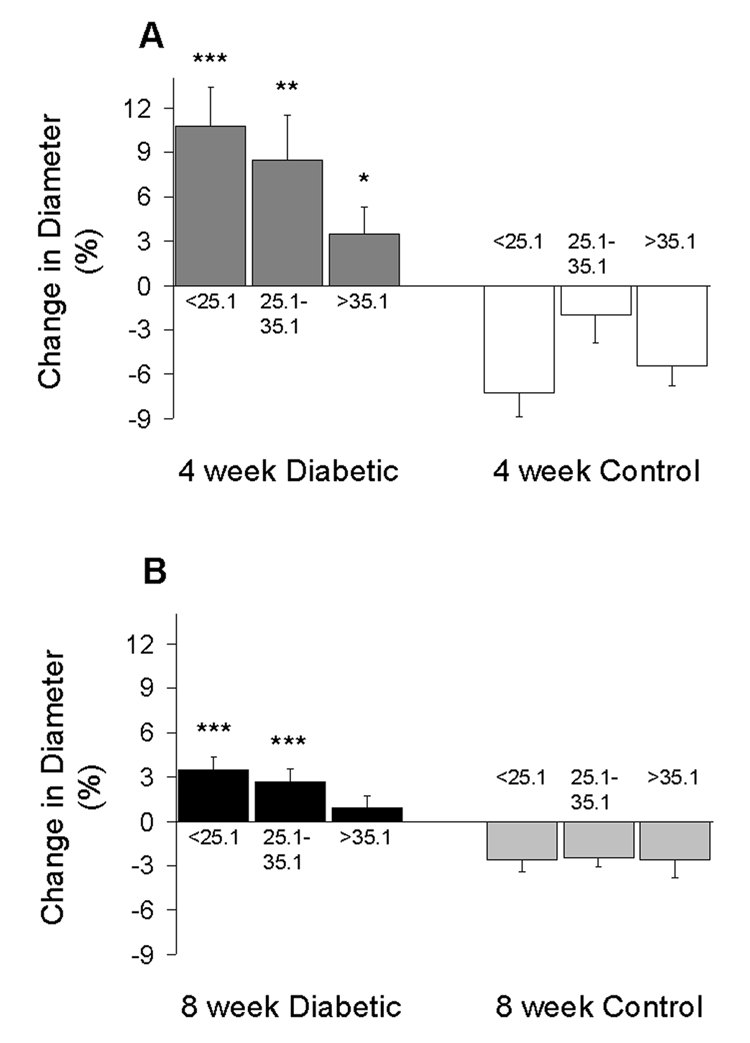
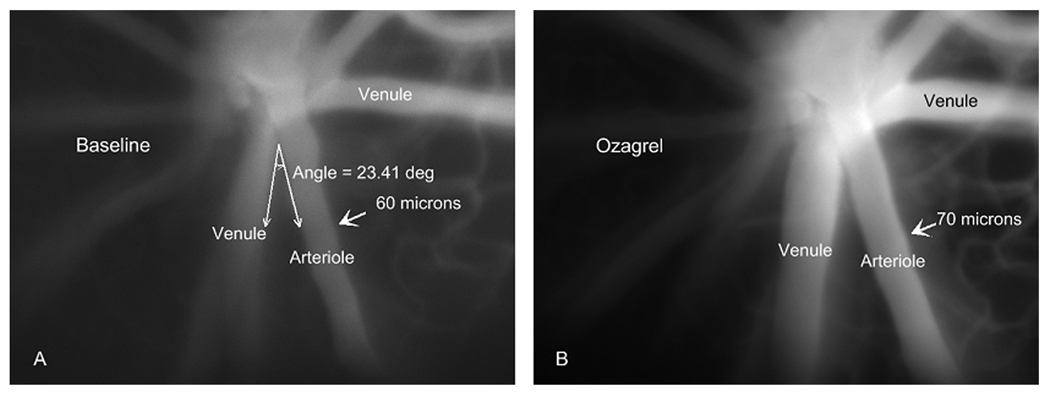
In the diabetic mice, the smallest baseline diameters were found in the more closely venule-paired arterioles, as shown in Figure 5. The constriction of the more closely paired arterioles was most dramatic 4 weeks following the injection of STZ, with an average diameter of 46.7 ± 2.5 µm compared to 59.7 ± 0.7 µm in the age-matched controls (p<0.01). The degree of constriction in the diabetic mice correlated very closely with the change in diameter following infusion of the thromboxane synthase inhibitor, ozagrel, as shown in Figure 6. Following ozagrel, the largest dilations occurred in the most closely paired arterioles (which were the most constricted during the baseline period) in the diabetic mice; and moreover, dilation occurred only in the diabetic mice, not in the controls. The percentage change in vessel diameter in 4-week STZ-injected animals was 10.8 ± 2.6%, 8.5 ± 3.0%, and 3.5 ± 1.8% for close, intermediate, and more distantly paired arterioles, respectively. Ozagrel-induced dilation was less prominent in the 8-week diabetic mice, with the increase in diameter near or even below the optical resolution of our intravital microscope. Figure 7 shows an example of the ozagrel-induced dilation in a 4-week STZ-injected mouse.
5.
Retinal arteriolar diameters in the 4-week (A) and 8-week (B) groups of mice. Subsets of data are segregated by arterio-venular pairing angles and consist of N=11–19 arterioles per column. †p<0.05 and ††p<0.01 vs the larger angle subset in the same group of mice; **p<0.01 vs the same angle subset in the age-matched controls.
6.
Ozagrel-induced changes in retinal arteriolar diameters in the 4-week (A) and 8-week (B) groups of mice. Subsets of data are segregated by arterio-venular pairing angles and consist of N=11–19 arterioles per column. *p<0.05, **p<0.01, and ***p<0.001 vs the same angle subset in the age-matched controls.
7.
Intravital microscopic image of arterioles and venules near the optic disk in a diabetic mouse injected 4 weeks earlier with streptozotocin. Images are from a baseline period (A) and 25 min following injection of ozagrel (B). The indicated arteriole was in close proximity to one venule (smaller angle), but more distantly paired with the venule on the other side.
Discussion
Retinal blood flow in human diabetics follows a biphasic time course of a substantial reduction followed by a later restoration and even increase (Bursell et al., 1996; Clermont et al., 1997). The mechanisms of the initial decrease in flow need to be elucidated, inasmuch as the resulting ischemia could lead to the production of inflammatory and angiogenic mediators such as vascular endothelial growth factor (de Gooyer et al., 2006). The present study demonstrates a biphasic time course of retinal blood flow in the streptozotocin model of diabetes in mice. Furthermore, the study presents new details of the initial decrease in flow; i.e., that the thromboxane-mediated vasoconstriction is more severe in arterioles that are more closely arranged with venules draining the retinal microcirculation. This mechanism could be important in the human retina, where parallel pairs of arterioles and venules extend for a long distance around both the upper and lower sides of the macula: close arterio-venular pairing could potentially facilitate the transport of venule-derived constrictors along an extended length of arteriole.
Data from experimental models of diabetes have shown increases as well as decreases in retinal blood flow, with the variability possibly due to the variety of animal models, flow measurement techniques, and duration of diabetes. Retinal blood flow has been found to be decreased in alloxan-injected dogs (5 months of hyperglycemia), with flow measured using radionuclide-labeled microspheres (Small et al., 1987). Using this same technique, flow was found to be decreased after three weeks of hyperglycemia in rats injected with STZ; however, the decrease was not statistically significant (Granstam and Granstam, S. O., 1999). In contrast, blood flow was shown to increase in STZ-injected rats after six weeks of hyperglycemia using the microsphere technique (Tilton et al., 1989). Using the video fluorescein angiography method, it was shown that flow decreased after only one week of diabetes in STZ-injected rats (Bursell et al., 1992; Clermont et al., 1994). Finally, in a STZ-induced diabetic rat model flow was increased after 5–6 weeks duration of hyperglycemia when measured with the hydrogen clearance method (Cringle et al., 1993).
Our results demonstrate an early and substantial decrease in flow in a mouse model of STZ-induced diabetes. In the first four weeks following streptozotocin injection, we found that retinal arteriolar velocity decreased to ~76% of controls and arteriolar diameter decreased to ~85% of controls. Given that flow = velocity × cross-sectional area (velocity × π × diameter2 / 4), retinal flow can be estimated to decrease by 45% at this early time point (0.76 × 0.852 = 0.55). By eight weeks, flow tended to return toward controls (within 26%), with velocity 79% of controls and diameter 97% of controls (0.79 × 0.972 = 0.74). This biphasic pattern could represent a significantly condensed time course compared to human diabetics, in whom the period of reduced flow could last several years (Bursell et al., 1996; Clermont et al., 1997), and in whom the consequences of the extended hypoperfusion period could be severe.
The calculation of a 45% decrease in retinal blood flow at 4 weeks of diabetes corresponds closely to the 42% decrease calculated from the mean circulation time and diameters: [(arteriolar diameter)2 + (venular diameter)2] / MCT (Bulpitt and Dollery, C. T., 1971). Inserting our values into this calculation for the 4 week diabetic mice yields [(51.6 µm)2 + (59.7 µm)2]/(1191 ms) = 5.23 µm2/ms, which is 42% lower than for the 4 week controls: [(60.4 µm)2 + (71.4 µm)2]/(969 ms) = 9.03 µm2/ms. Similarly, the 26% decrease in retinal blood flow at 8 weeks of diabetes calculated above corresponds closely to a 22% decrease predicted from the MCT equation. The 22–26% decrease in flow occurred despite only marginal decreases in arteriolar and venular diameters at 8 weeks STZ; although speculative, the decrease in flow could be influenced by a diminished cardiac function in the diabetic animals.
Resistance to flow in a cylindrical vessel of uniform diameter is inversely proportional to the fourth power of diameter. Therefore, for a given driving pressure, flow would be predicted to decrease by 48% at 4 weeks of STZ-induced diabetes given our observed 15% arteriolar constriction: 0.854 = 0.52. The predicted 48% decrease in flow is similar to the 42–45% decrease that we observed. However, another factor that can influence retinal flow is the ocular perfusion pressure (OPP), which is defined as the mean arterial pressure minus the intraocular pressure. Using our measured values of MAP and IOP for 4-week controls (68.2 and 11.6 mmHg, respectively) and 4-week diabetics (68.2 and 11.8 mmHg, respectively), OPP is essentially identical in the two groups at ~56 mmHg. Therefore, the decrease in arteriolar flow that we observed at 4 weeks of STZ is unlikely to be a result of altered OPP.
Consistent with our data, reports of MAP and IOP in rat models of STZ-induced diabetes do not show changes through 4 weeks (MAP) and 12 weeks (IOP) following STZ injection (Horio et al., 2004; Kanamori et al., 2004). However, at 8 weeks of STZ in our experiments, MAP increased significantly to a value of 82 mmHg, consistent with an increase observed in type I diabetic patients compared to controls (Kawagishi et al., 1995). Whether or not this increase in MAP (and OPP, to 71 mmHg) could increase retinal flow is not clear, given the report that autoregulatory mechanisms maintain constant retinal blood flow in the range of 30–75 mmHg OPP in the newborn piglet (Hardy et al., 1994).
Reports in the rat model of STZ have described a substantial decrease in retinal capillary density, with the decrease mediated by thromboxane (De La Cruz et al., 1998; De La Cruz et al., 2000). Although we did not see a change in capillary density in our mouse model, our data also implicate thromboxane in the arteriolar constriction that limits flow, although the effects of the vasoconstrictor were more substantial in the arterioles more closely paired with venules. Although not addressed in this study, this pattern potentially could offer some clues as to the source of thromboxane. In a model of ischemia-reperfusion, Zamboni et al. (Mazolewski et al., 1999; Zamboni et al., 1993; Zamboni et al., 1997) found arteriolar constriction, but only in the arterioles more closely paired with venules. The constriction could be inhibited by strategies targeting thromboxane receptor binding and blocking venular accumulation of inflammatory cells. Therefore, it is possible that inflammatory cells (including granulocytes, macrophages, and platelets) that accumulate in and around the retinal microcirculation in diabetes (Esser et al., 1993; Schroder et al., 1991; Yamashiro et al., 2003) could produce the thromboxane that may diffuse from the draining venules to closely paired, countercurrent arterioles.
In summary, we have found that the initial 45% decrease in retinal blood flow (occurring at the four week time point) in the mouse model of streptozotocin-induced diabetes is 1) due primarily to arteriolar vasoconstriction (rather than a decrease in ocular perfusion pressure), 2) dependent on the proximity of arterioles to countercurrent venules, and 3) attenuated by the thromboxane synthase inhibitor ozagrel. Future studies might elucidate whether targeting the thromboxane-dependent vasoconstriction could attenuate the potentially deleterious consequences of early ischemia in the diabetic retina.
Acknowledgments
This study was funded by the Juvenile Diabetes Research Foundation (1-2003-159) and by the National Institutes of Health (EY017599).
Footnotes
Publisher's Disclaimer: This is a PDF file of an unedited manuscript that has been accepted for publication. As a service to our customers we are providing this early version of the manuscript. The manuscript will undergo copyediting, typesetting, and review of the resulting proof before it is published in its final citable form. Please note that during the production process errors may be discovered which could affect the content, and all legal disclaimers that apply to the journal pertain.
Reference List
- Anonymous. The effect of intensive diabetes treatment on the progression of diabetic retinopathy in insulin-dependent diabetes mellitus. The Diabetes Control and Complications Trial. Arch.Ophthalmol. 1995;113:36–51. doi: 10.1001/archopht.1995.01100010038019. [DOI] [PubMed] [Google Scholar]
- Braun RD, Abbas A, Bukhari SO, Wilson W., III Hemodynamic parameters in blood vessels in choroidal melanoma xenografts and rat choroid. Invest Ophthalmol.Vis.Sci. 2002;43:3045–3052. [PMC free article] [PubMed] [Google Scholar]
- Bulpitt CJ, Dollery CT. Estimation of retinal blood flow by measurement of the mean circulation time. Cardiovasc.Res. 1971;5:406–412. doi: 10.1093/cvr/5.3.406. [DOI] [PubMed] [Google Scholar]
- Bursell SE, Clermont AC, Kinsley BT, Simonson DC, Aiello LM, Wolpert HA. Retinal blood flow changes in patients with insulin-dependent diabetes mellitus and no diabetic retinopathy. Invest Ophthalmol.Vis.Sci. 1996;37:886–897. [PubMed] [Google Scholar]
- Bursell SE, Clermont AC, Shiba T, King GL. Evaluating retinal circulation using video fluorescein angiography in control and diabetic rats. Curr.Eye Res. 1992;11:287–295. doi: 10.3109/02713689209001782. [DOI] [PubMed] [Google Scholar]
- Clermont AC, Aiello LP, Mori F, Aiello LM, Bursell SE. Vascular endothelial growth factor and severity of nonproliferative diabetic retinopathy mediate retinal hemodynamics in vivo: a potential role for vascular endothelial growth factor in the progression of nonproliferative diabetic retinopathy. Am.J.Ophthalmol. 1997;124:433–446. doi: 10.1016/s0002-9394(14)70860-8. [DOI] [PubMed] [Google Scholar]
- Clermont AC, Brittis M, Shiba T, McGovern T, King GL, Bursell SE. Normalization of retinal blood flow in diabetic rats with primary intervention using insulin pumps. Invest Ophthalmol.Vis.Sci. 1994;35:981–990. [PubMed] [Google Scholar]
- Cringle SJ, Yu DY, Alder VA, Su EN. Retinal blood flow by hydrogen clearance polarography in the streptozotocin-induced diabetic rat. Invest Ophthalmol.Vis.Sci. 1993;34:1716–1721. [PubMed] [Google Scholar]
- D'Amato R, Wesolowski E, Smith LE. Microscopic visualization of the retina by angiography with high-molecular-weight fluorescein-labeled dextrans in the mouse. Microvasc.Res. 1993;46:135–142. doi: 10.1006/mvre.1993.1042. [DOI] [PubMed] [Google Scholar]
- de Gooyer TE, Stevenson KA, Humphries P, Simpson DA, Gardiner TA, Stitt AW. Retinopathy Is Reduced during Experimental Diabetes in a Mouse Model of Outer Retinal Degeneration. Invest Ophthalmol.Vis.Sci. 2006;47:5561–5568. doi: 10.1167/iovs.06-0647. [DOI] [PubMed] [Google Scholar]
- De La Cruz JP, Moreno A, Ruiz-Ruiz MI, Garcia CJ, Sanchez dlC. Effect of camonagrel, a selective thromboxane synthase inhibitor, on retinal vascularization in experimental diabetes. Eur.J.Pharmacol. 1998;350:81–85. doi: 10.1016/s0014-2999(98)00233-7. [DOI] [PubMed] [Google Scholar]
- De La Cruz JP, Moreno A, Ruiz-Ruiz MI, Sanchez dlC. Effect of DT-TX 30, a combined thromboxane synthase inhibitor and thromboxane receptor antagonist, on retinal vascularity in experimental diabetes mellitus. Thromb.Res. 2000;97:125–131. doi: 10.1016/s0049-3848(99)00173-5. [DOI] [PubMed] [Google Scholar]
- De La CP, Guerrero A, Paniego J, Arranz I, Moreno A, Sanchez dlC. Effect of aspirin on prostanoids and nitric oxide production in streptozotocin-diabetic rats with ischemic retinopathy. Naunyn Schmiedebergs Arch.Pharmacol. 2002;365:96–101. doi: 10.1007/s00210-001-0507-9. [DOI] [PubMed] [Google Scholar]
- Esser P, Heimann K, Wiedemann P. Macrophages in proliferative vitreoretinopathy and proliferative diabetic retinopathy: differentiation of subpopulations. Br.J.Ophthalmol. 1993;77:731–733. doi: 10.1136/bjo.77.11.731. [DOI] [PMC free article] [PubMed] [Google Scholar]
- Fong DS, Aiello L, Gardner TW, King GL, Blankenship G, Cavallerano JD, Ferris FL, III, Klein R. Diabetic retinopathy. Diabetes Care. 2003;26:226–229. doi: 10.2337/diacare.26.1.226. [DOI] [PubMed] [Google Scholar]
- Granstam E, Granstam SO. Regulation of uveal and retinal blood flow in STZ-diabetic and non-diabetic rats; involvement of nitric oxide. Curr.Eye Res. 1999;19:330–337. doi: 10.1076/ceyr.19.4.330.5300. [DOI] [PubMed] [Google Scholar]
- Hardy P, Abran D, Li DY, Fernandez H, Varma DR, Chemtob S. Free radicals in retinal and choroidal blood flow autoregulation in the piglet: interaction with prostaglandins. Invest Ophthalmol.Vis.Sci. 1994;35:580–591. [PubMed] [Google Scholar]
- Harris NR. Reperfusion-induced changes in capillary perfusion and filtration: effects of hypercholesterolemia. Am.J.Physiol. 1999;277:H669–H675. doi: 10.1152/ajpheart.1999.277.2.H669. [DOI] [PubMed] [Google Scholar]
- Harris NR, Whatley JR, Carter PR, Specian RD. Venular constriction of submucosal arterioles induced by dextran sodium sulfate. Inflamm.Bowel.Dis. 2005;11:806–813. doi: 10.1097/01.mib.0000178262.95980.65. [DOI] [PubMed] [Google Scholar]
- Hester RL, Hammer LW. Venular-arteriolar communication in the regulation of blood flow. Am.J.Physiol Regul.Integr.Comp Physiol. 2002;282:R1280–R1285. doi: 10.1152/ajpregu.00744.2001. [DOI] [PubMed] [Google Scholar]
- Horio N, Clermont AC, Abiko A, Abiko T, Shoelson BD, Bursell SE, Feener EP. Angiotensin AT(1) receptor antagonism normalizes retinal blood flow and acetylcholine-induced vasodilatation in normotensive diabetic rats. Diabetologia. 2004;47:113–123. doi: 10.1007/s00125-003-1262-x. [DOI] [PubMed] [Google Scholar]
- Joussen AM, Murata T, Tsujikawa A, Kirchhof B, Bursell SE, Adamis AP. Leukocyte-mediated endothelial cell injury and death in the diabetic retina. Am.J.Pathol. 2001;158:147–152. doi: 10.1016/S0002-9440(10)63952-1. [DOI] [PMC free article] [PubMed] [Google Scholar]
- Kanamori A, Nakamura M, Mukuno H, Maeda H, Negi A. Diabetes has an additive effect on neural apoptosis in rat retina with chronically elevated intraocular pressure. Curr.Eye Res. 2004;28:47–54. doi: 10.1076/ceyr.28.1.47.23487. [DOI] [PubMed] [Google Scholar]
- Kawagishi T, Nishizawa Y, Emoto M, Konishi T, Maekawa K, Hagiwara S, Okuno Y, Inada H, Isshiki G, Morii H. Impaired retinal artery blood flow in IDDM patients before clinical manifestations of diabetic retinopathy. Diabetes Care. 1995;18:1544–1549. doi: 10.2337/diacare.18.12.1544. [DOI] [PubMed] [Google Scholar]
- Kim MH, Granger DN, Harris NR. Mediators of CD18/P-selectin-dependent constriction of venule-paired arterioles in hypercholesterolemia. Microvasc.Res. 2007;73:150–155. doi: 10.1016/j.mvr.2006.10.002. [DOI] [PMC free article] [PubMed] [Google Scholar]
- Linsenmeier RA, Braun RD, McRipley MA, Padnick LB, Ahmed J, Hatchell DL, McLeod DS, Lutty GA. Retinal hypoxia in long-term diabetic cats. Invest Ophthalmol.Vis.Sci. 1998;39:1647–1657. [PubMed] [Google Scholar]
- Mazolewski PJ, Roth AC, Suchy H, Stephenson LL, Zamboni WA. Role of the thromboxane A2 receptor in the vasoactive response to ischemia-reperfusion injury. Plast.Reconstr.Surg. 1999;104:1393–1396. doi: 10.1097/00006534-199910000-00023. [DOI] [PubMed] [Google Scholar]
- MEIER P, ZIERLER KL. On the theory of the indicator-dilution method for measurement of blood flow and volume. J.Appl.Physiol. 1954;6:731–744. doi: 10.1152/jappl.1954.6.12.731. [DOI] [PubMed] [Google Scholar]
- Moore CG, Milne ST, Morrison JC. Noninvasive measurement of rat intraocular pressure with the Tono-Pen. Invest Ophthalmol.Vis.Sci. 1993;34:363–369. [PubMed] [Google Scholar]
- Moreno A, De La Cruz JP, Garcia CJ, Sanchez dlC. Prostacyclin-thromboxane balance and retinal vascular pattern in rats with experimentally induced diabetes. Can.J.Ophthalmol. 1995;30:117–123. [PubMed] [Google Scholar]
- Reitsamer HA, Kiel JW, Harrison JM, Ransom NL, McKinnon SJ. Tonopen measurement of intraocular pressure in mice. Exp.Eye Res. 2004;78:799–804. doi: 10.1016/j.exer.2003.11.018. [DOI] [PubMed] [Google Scholar]
- Roy MS, Klein R, O'Colmain BJ, Klein BE, Moss SE, Kempen JH. The prevalence of diabetic retinopathy among adult type 1 diabetic persons in the United States. Arch.Ophthalmol. 2004;122:546–551. doi: 10.1001/archopht.122.4.546. [DOI] [PubMed] [Google Scholar]
- Schroder S, Palinski W, Schmid-Schonbein GW. Activated monocytes and granulocytes, capillary nonperfusion, and neovascularization in diabetic retinopathy. Am.J.Pathol. 1991;139:81–100. [PMC free article] [PubMed] [Google Scholar]
- Small KW, Stefansson E, Hatchell DL. Retinal blood flow in normal and diabetic dogs. Invest Ophthalmol.Vis.Sci. 1987;28:672–675. [PubMed] [Google Scholar]
- Spierer A, Rabinowitz R, Pri-Chen S, Rosner M. An increase in superoxide dismutase ameliorates oxygen-induced retinopathy. Eye. 2005;19:86–91. doi: 10.1038/sj.eye.6701424. [DOI] [PubMed] [Google Scholar]
- Tilton RG, Chang K, Pugliese G, Eades DM, Province MA, Sherman WR, Kilo C, Williamson JR. Prevention of hemodynamic and vascular albumin filtration changes in diabetic rats by aldose reductase inhibitors. Diabetes. 1989;38:1258–1270. doi: 10.2337/diab.38.10.1258. [DOI] [PubMed] [Google Scholar]
- Tomic L, Maepea O, Sperber GO, Alm A. Comparison of retinal transit times and retinal blood flow: a study in monkeys. Invest Ophthalmol.Vis.Sci. 2001;42:752–755. [PubMed] [Google Scholar]
- Unthank JL, Lash JM, Nixon JC, Sidner RA, Bohlen HG. Evaluation of carbocyanine-labeled erythrocytes for microvascular measurements. Microvasc.Res. 1993;45:193–210. doi: 10.1006/mvre.1993.1018. [DOI] [PubMed] [Google Scholar]
- Yam JC, Kwok AK. Update on the treatment of diabetic retinopathy. Hong.Kong.Med.J. 2007;13:46–60. [PubMed] [Google Scholar]
- Yamashiro K, Tsujikawa A, Ishida S, Usui T, Kaji Y, Honda Y, Ogura Y, Adamis AP. Platelets accumulate in the diabetic retinal vasculature following endothelial death and suppress blood-retinal barrier breakdown. Am.J.Pathol. 2003;163:253–259. doi: 10.1016/S0002-9440(10)63648-6. [DOI] [PMC free article] [PubMed] [Google Scholar]
- Zamboni WA, Roth AC, Russell RC, Graham B, Suchy H, Kucan JO. Morphologic analysis of the microcirculation during reperfusion of ischemic skeletal muscle and the effect of hyperbaric oxygen. Plast.Reconstr.Surg. 1993;91:1110–1123. doi: 10.1097/00006534-199305000-00022. [DOI] [PubMed] [Google Scholar]
- Zamboni WA, Stephenson LL, Roth AC, Suchy H, Russell RC. Ischemia-reperfusion injury in skeletal muscle: CD 18-dependent neutrophil-endothelial adhesion and arteriolar vasoconstriction. Plast.Reconstr.Surg. 1997;99:2002–2007. doi: 10.1097/00006534-199706000-00028. [DOI] [PubMed] [Google Scholar]


