

Abstract
We monitored the occupancy of a functionally important non-coordinated water molecule in the distal heme pocket of sperm whale myoglobin over the pH range 4.3-9.4. Water occupancy was assessed by using time-resolved spectroscopy to detect the perturbation of the heme visible band absorption spectrum caused by water entry after CO photodissociation (Goldbeck, R. A., Bhaskaran, S., Ortega, C., Mendoza, J. L., Olson, J. S., Soman, J., Kliger, D. S., and Esquerra, R. M. (2006) Proc. Natl. Acad. Sci. U. S. A. 103 ,1254 -1259). We found that the water occupancy observed during the time interval between ligand photolysis and diffusive recombination decreased by nearly 20% as the pH was lowered below 6. This decrease accounted for most of the concomitant increase in the observed CO bimolecular recombination rate constant, as the lower water occupancy presented a smaller kinetic barrier to CO entry into the pocket at lower pH. These results were consistent with a model in which the distal histidine, which stabilizes the water molecule within the distal pocket by accepting a hydrogen bond, tends to swing out of the pocket upon protonation and destabilize the water occupancy at low pH. Extrapolation of this model to lower pH suggests that the additional increase in ligand association rate constant observed previously in stopped-flow studies at pH 3 may also be due in part to reduced distal water occupancy concomitant with further His64 protonation and coupled protein conformational change.
Myoglobin is a compact globular protein comprising eight α-helices cradling a heme group (iron (II) protoporphyrin IX). The iron atom within the porphyrin ring is coordinated to the protein through residue His93, the proximal histidine, on the F helix (F8), and to the porphyrin through four pyrrole nitrogens, leaving the sixth coordination position free to bind small molecule ligands. Positioned near the ligand binding site in the distal heme pocket is residue His64(E7), the distal histidine. There has been much interest in the role of the distal histidine in the mechanism by which myoglobin discriminates between the binding of its two most physiologically significant ligands, O2 and CO (the latter being produced by cellular catabolism and implicated recently in intracellular signaling) (1-6). The affinity of CO for a “free” heme in solution relative to that of O2 (KCO/KO2) is ∼20,000, much higher than the relative affinity of ∼25 found in sperm whale myoglobin. Because both ligands are apolar and of similar size, the usual shape-based mechanism of protein-ligand molecular recognition is not directly applicable. Instead, myoglobin achieves this selectivity primarily through a favorable electrostatic interaction between the ligand and the distal histidine, O2 forming a much stronger hydrogen bond to the latter than does CO.
A water molecule within the deoxy distal pocket plays an important role in this mechanism. By hydrogen bonding to the distal histidine in the absence of heme ligands, this (non-heme-coordinated) water presents a kinetic barrier to the entry of all ligands, thereby reducing their observed rate and equilibrium constants for binding (5, 7). In the case of CO, this suppression by water overwhelms the small stabilization in ligand binding provided by the weak His64-OC electrostatic interaction, whereas in the case of O2, the inhibition of ligand binding presented by water is small compared with the stabilization provided by the strong His64-O2 hydrogen bond. Thus, the presence of a histidine residue at position E7 in the native protein has the net effect in aqueous solution, relative to a mutant with an apolar E7 residue, of suppressing the binding of CO to heme while simultaneously enhancing the affinity of the protein for O2 (5). The His64-HOH complex found in the deoxy form of the protein is thus an important part of the mechanism through which myoglobin binds and discriminates between ligands.
Further understanding this mechanism may help in elucidating how other heme proteins selectively bind and sense ligands such as NO, CO, and O2 (8, 9). The α chains of the oxygen transport protein hemoglobin, for example, are known to contain a non-coordinated distal water molecule in the deoxy heme pocket that may modulate ligand affinities in a manner similar to that observed in myoglobin (10). Similarly, the human hemoglobin variant Hb Chico has a higher β-chain distal water occupancy than Hb A0, a factor that is thought to contribute to its lower oxygen affinity (11, 12). The access of water molecules to the distal heme pockets of hemoglobins from the invertebrate Lucina pectinata (13) and the mycobacterium Mycobacterium tuberculosis (14) also appears to modulate ligand binding function in those proteins. The heme pocket sequence alignment, deoxy absorption spectrum, and O2 affinity of HemAT-Bs, a protein controlling aerophilic response in the soil bacterium Bacillus subtilis, resemble those of myoglobin (15, 16). This resemblance suggests that the myoglobin ligand-binding and discrimination mechanisms discussed here may be particularly relevant to this oxygen sensor, which is one example of a broader class of recently discovered globin-coupled sensors (17).
Earlier kinetic studies of myoglobin found that the observed rate of CO binding increases as the pH is lowered below neutral (18-23), increasing in sperm whale Mb3 by more than a factor of 10 on going from pH 7 to 3 (23). (In contrast to the changes observed at low pH, Lambright et al. (24) measured CO binding kinetics in human myoglobin from pH 6.5 to 10 and found that the rates were independent of both pH and salt concentration.) Most of the increase in observed ligand binding rate constant occurs at pH values below 4 and has been attributed previously to protonation of the proximal histidine (pKa = 3.45), which disrupts the iron-His93 bond and converts deoxy-Mb to a tetracoordinated form (20, 23, 25). The tetra-coordinated iron remains in the plane of the porphyrin ring, unlike the penta-coordinated iron, which decreases the activation energy required for heme ligation.
A limitation on very low pH studies of MbCO photolysis kinetics is the unfolding of the protein that starts to occur below pH 4. Thus, to investigate the possibility that variations in distal heme pocket hydration with pH may present an additional mechanism for the modulation of ligand binding rates, the present study focused on the more modest changes in photolysis kinetics observed at pH values above 4, where the protein is expected to retain the proximal histidine-heme linkage and remain natively folded. This range is also reasonably expected to encompass the largest physiological pH excursions encountered within muscle cells, wherein the bulk pH drops as low as 6.6 and perhaps transiently lower for small volumes within the cell that are undergoing high oxidative metabolic activity.
We used a spectrokinetic assay in the present work to monitor the entry of the water molecule into the distal pocket of ferrous myoglobin after it has been emptied of ligand by photodissociation of the CO complex (26, 27). Unlike ferric Mb, in which the heme iron binds a water molecule, the water molecule that hydrates the heme pocket in ferrous Mb does not coordinate to the iron atom. Consequently, heme hydration does not significantly perturb the strongly allowed Soret band (about 350-450 nm). On the other hand, the Q-band transitions (about 500-650 nm) are symmetry forbidden and acquire intensity through electronic and vibronic coupling to the Soret band. Thus, they are more sensitive to changes in the heme pocket environment, in this case the change in polarity when a water molecule moves into and out of the pocket.
We used this spectral signature previously to monitor the kinetics of hydration following CO photolysis in wild type and mutant sperm whale myoglobin, determining activation energies from the temperature dependences of the hydration rate constants (26). In the earlier work, we found that mutations of the distal histidine altered the intrinsic rates of both water exit and entry, rates that together determined water occupancy in the pocket. Changes in this water occupancy were found to be the dominant factor modulating the observed bimolecular association rate constant for CO in the mutants studied.
We investigate in the present work the variation of heme pocket hydration with pH to: 1) determine the extent to which modulation of this kinetic barrier to CO entry contributes to the changes in the CO bimolecular rebinding rate constant induced by pH, and 2) investigate the role that protonation of the distal histidine in particular plays in modulating the kinetics of heme hydration and ligand association. We find a “drying” of the distal pocket at lower pH that appears to correlate with a previously reported protondriven protein conformational change rotating the His64-H2O complex away from the pocket. The resulting loss of water occupancy in this scenario would explain much of the faster rate of diffusive ligand rebinding to the heme iron atom that has been attributed to the low pH conformation (28-31). The implications of this finding for the larger perturbation of ligand binding kinetics observed previously at pH < 4 are discussed below.
EXPERIMENTAL PROCEDURES
Protein Expression, Purification, and Preparation—Wildtype sperm whale Mb was expressed and purified as described previously (31-34). Samples for photolysis experiments were prepared by equilibrating and anaerobically sealing a cuvette containing the protein under 1 atm of CO following reduction with sodium dithionite at a final concentration of about 1 mm. Variations in pH were obtained by preparing identical samples and dialyzing or titrating, using small aliquots of 0.5 m NaOH or 0.5 m phosphoric acid, to the appropriate pH. In the absence of salt, the protein precipitated above pH 9.4 and below pH 4.6 during the course of the experiments. The addition of 175 mm NaCl allowed pH 4.3 (0.1 m NaPi) to be reached before precipitation occurred. Each non-neutral pH sample was titrated back to pH 7.30 after the laser photolysis measurements and further laser experiments were performed to assure that irreversible sample changes were not occurring. Any precipitate formed during the titrations was removed before taking measurements by spinning the sample anaerobically for 2 min at 10,000 × g. For some samples, the pH was monitored anaerobically in the cuvette using a micro-pH syringe probe. The temperature was controlled at 20 °C by a thermoelectric system. The sealed anaerobic sample cuvettes were 0.4 × 1.0 cm (photolysis × probe dimension). This crossed beam geometry facilitated efficient sample photolysis while minimizing the collection of laser scatter at the detector.
Multichannel Laser Photolysis Measurements—Measurements were performed on instrumentation as described previously (26). A frequency-doubled Nd:YAG (yttrium aluminum garnet) laser produced 8-ns excitation pulses at 532 nm at a rate of 1 Hz, with a pulse energy of 60 mJ and a beam diameter of 10 mm. Light from a xenon flash lamp was focused at the sample and then focused through a 25-μm slit onto an imaging spectrograph (600 grooves/mm, 650 nm blaze grating). The dispersed light (475 to 675 nm) was detected using a 1024-channel charge coupled detector (DH520-18K-01, Andor). A delay/pulse generator controlled the firing of the flash lamp and the opening of the 15-ns detector gate with respect to the laser pulse. Magic angle polarization of the probe beam minimized distortion of the observed kinetics due to artifacts associated with photoselection and rotational diffusion (35). Photolysis difference spectra were collected at 41 logarithmically spaced time points from 20 ns to 20 ms after laser photolysis. Each of the 41 spectra collected represented the average of 480 separate measurements.
Global Fitting to a Sum of Exponential Decays—(The term global is used in this paper to mean fitting of kinetic data at all wavelengths simultaneously.) Each time-resolved spectral scan, comprising 420 wavelength points (∼0.3 nm spacing) between 510 and 640 nm, was smoothed using a 15-point Savitzky-Golay algorithm. The smoothed data were placed in an n × m matrix, A(λ, t), where n is the number of wave-lengths and m is the number of time points, and decomposed using the method of singular value decomposition (SVD) into three matrices,
 |
(Eq.1) |
where U is an n × m matrix (n ≥ m) containing m orthogonal basis spectra as columns, VT is an m × m matrix that is the transpose of V, each column of V giving the amplitude of the corresponding column of U at each time point, and S is an m × m diagonal matrix containing the singular values of A, that weight the contributions of the columns of U and V (36). In this decomposition, important spectral evolutions are associated with the largest singular values, whereas the singular values associated with noise are usually found to fall below a well defined cutoff value (35). For the data analyzed here, the cutoff was below the two largest singular values. If the number of singular values above the cutoff value is s, then the truncated and noise-filtered data matrix, As, is constructed from the matrix product of the first s columns of U, the s × s subset of S, and the first s rows of AT. This is the best least-squares representation of A, where the sum of squares difference between A and As is given by summing the squares of the discarded singular values (35).
The SVD-filtered data matrix was fit to a sum of exponentials using a
nonlinear least-squares simplex fitting procedure as a means to give a
model-independent examination of the data
(35), wherein the elements of
As were given
by,
where τi is the observed lifetime for the ith exponential process and bi(λ) is the wavelength-dependent amplitude associated with each lifetime. The root sum of squares of bi(λ), normalized to the total for all the spectra, was taken as the relative amplitude for that lifetime.
Microscopic Kinetic Modeling of Water Entry—The spectro-kinetic assay method of Goldbeck et al. (26) was applied to the MbCO photolysis data to obtain distal pocket water occupancy factors and microscopic rate constants for hydration as a function of pH. This (wavelength) global kinetic modeling procedure was similar to that described above for simple exponential fitting in its use of the temporal SVD component V of the photolysis data. However, in going beyond simple phenomenological modeling, it also used a spectral constraint (minimal spectral change with heme pocket hydration) and a kinetic constraint (CO bimolecular recombination rate no faster than diffusion controlled) to determine the 5 microscopic rate constants in the hydration model shown in Equations 3-5: k′inH2O, koutH2O, k′inCO, k′inCO, koutCO, and kFeCO, which represented heme pocket water entry and escape, and CO entry, escape, and geminate recombination, respectively. The water occupancy, nw, was calculated from nw =k′inH2O[H2O]/(k′inH2O[H2O] + koutH2O) = Kw[H2O]/(Kw [H2O] + 1) and the geminate recombination yield, ϕg, was calculated from ϕ = kFeCO/(kFeCO + koutCO). (See Ref. 37 for a description of the matrix methods used in the wavelength-global fitting of kinetic data to the firstorder microscopic kinetic model presented here.)
RESULTS
Visible Band Absorption Versus pH—Figs. 1 and 2 show the effect of pH on the visible absorption bands of carbonmonoxymyoglobin and deoxymyoglobin, respectively. There was little change in the visible band absorption spectra in the pH range of 6 to 9 for both deoxy-Mb and MbCO, as might be expected from the lack of changes in the corresponding crystal structures (29). The largest effect in the visible bands was seen in MbCO at low pH (Fig. 1). Compared with MbCO at pH 7.3, the β band (540 nm) showed little change at decreased pH, however, the α band (578 nm) showed a pronounced effect with decreasing pH. There was a sharp decrease in the peak intensity of the α band as it broadened and blue shifted from 578 to 574 nm. Similar spectral changes were reported by Fuchsman and Appleby (38). Smaller changes were observed in deoxymyoglobin, for which we report pH difference spectra in Fig. 2. The 555-nm deoxy band split at low pH into two spectral transitions as an additional peak appeared to the blue of 550 nm.
FIGURE 1.

Visible band absorption spectra of carbonmonoxymyoglobin as a function of pH. Arrow indicates the direction of β-band intensity change with decreasing pH values: 9.4, 8.4, 7.3, 6.0, 4.6, and 4.3. The sample preparation was as described in the text.
FIGURE 2.

Visible band absorption spectra of deoxymyoglobin (difference spectra relative to pH 7.3) as a function of pH: 4.3 (blue), 4.6 (green), 6.0 (red), 8.4 (cyan), and 9.4 (purple). Sample preparation was as described in the text.
The changes observed in the equilibrium deoxymyoglobin spectrum with pH were distinct from the spectral changes observed in our spectrokinetic assay for hydration (38), c.f. the second SVD component in Fig. 3 panels A-G. The equilibrium spectral changes at pH 4.3-4.6 were consistent in amplitude and shape to those expected from the small amount of proximal histidine protonation (∼5-10%) that occurs in this pH region and the perturbation of heme absorption caused by concomitant loss of the proximal His-heme linkage (23).
FIGURE 3.

First two SVD components of MbCO time-resolved photolysis difference spectra: U1 (—) and U2 (- -) (a-g), and V1/V1,1 (○) and V2S2/(V1,1S1) (▵) (h-n), at pH: 4.4 (a and h) (175 mm NaCl), 4.7 (b and i), 6.0 (c and j), 7.3 (d and k), 7.3 (e and l) (175 mm NaCl), 8.4 (f and m), and 9.4 (g and n). The solid and dashed lines in panels h-n show fits to the V1 and V2 data points, respectively, calculated from the hydration kinetic model of Goldbeck et al. (26) with the parameters shown in Table 2. The up arrows indicate the observed 1/e times for bimolecular recombination.
Geminate and Bimolecular Ligand Recombination and Distal Water Occupancy Reactions—The geminate ligand reactions of photolyzed MbCO, i.e. Fe-CO bond formation (back reaction in Equation 3), or escape from the pocket (forward reaction in Equation 4) by CO released into the distal heme pocket after photodissociation take place over the course of several hundred nanoseconds. The geminate ligand recombination yield, ϕg, of photolyzed MbCO is modest, due to the high electronic barrier for reformation of the bond between the heme iron atom and geminate CO. The geminate recombination rate constant kFeCO in Equation 3 is smaller than the rate constant for escape of geminate CO from the pocket, koutCO in Equation 4, by a factor of ∼20, yielding ϕg ≈ 5%. (Note that this amplitude was too small to be apparent in the time courses of ligand recombination presented below in Fig. 3.) The bimolecular re-entry of CO into the myoglobin heme pocket (back reaction in Equation 4) proceeds with a microscopic rate constant, k′inCO, which appears to be near diffusion controlled (26). Given the 1 mm concentration of CO, this implies a time constant of ∼10 μs, about 100 times faster than the observed bimolecular recombination of Fe-CO at ∼1 ms (see ligand recombination time courses in Fig. 3). Two factors act to slow the observed recombination from the microscopic rate with which CO enters the pocket. The first, ϕg, is well known. Only about 1 in 20 of the CO molecules that re-enter the pocket actually bind with iron before escaping again to solvent, a factor that slows the observed recombination rate correspondingly. The second factor, water occupancy/vacancy, has only recently become easily accessible experimentally (26), and is thus the novel aspect of the analysis presented here. The distal pocket water vacancy factor (1 - nw) is related to the ratio of the water entry and exit rates (forward and backward reactions, respectively, in Equation 5) as described above. Because of the reactions in Equation 5, only about 1 in 7 heme pockets is left vacant by water and thus available for ligand entry and binding to heme iron. The two factors, ϕg and (1 - nw), together account for the slowing of k′, the observed bimolecular rate constant, from k′inCO, as discussed further below (Equation 6).
The time course and amplitude of water entry versus pH was closely
reflected in the second SVD V components shown in
Fig. 3. The observed time scale
for water entry, which overlapped that of the geminate ligand reactions
mentioned above, was slightly slower at lower pH. As expected, the time scale
for decay of the water signal matched that of the bimolecular ligand
recombination, which decreased at lower pH. The water signal amplitudes
indicate a roughly 20% decrease in water occupancy at pH ∼ 4.5 relative to
that at neutral pH, corresponding (via Equation 6) roughly to a doubling in
the observed ligand rebinding rate. This correspondence between lowered water
occupancy and faster ligand rebinding at lower pH was the central experimental
result of the present
work.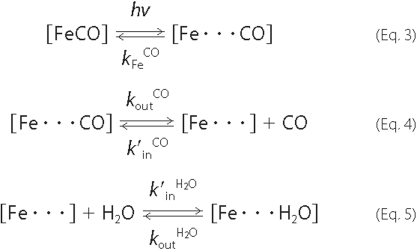
Effect of pH on Observed Geminate and Bimolecular Recombination Processes—Table 1 summarizes the changes in the observed kinetics as a function of pH in terms of a simple phenomenological analysis using two exponential decay processes. We assigned previously the first observed lifetime (process 1) in the deoxy photoproduct to a combination of the two microscopic processes, geminate recombination and heme hydration, and the second observed lifetime (process 2) to bimolecular recombination of CO (26, 27). The rate constant of process 1 decreased slightly at low pH, but it is not clear that this change was significant given the experimental uncertainties. The decrease in amplitude of process 1 on going from high (6.0 to 9.4) to low (4.3 to 4.6) pH was also small, but in this case appeared to be significant. This amplitude decrease was probably the net result of two opposing trends: an increase in amplitude arising from the increase in geminate recombination yield expected from the results of previous studies (31, 39), and a greater decrease in amplitude arising from the distal water spectral perturbation at lower pH. In contrast to process 1, the process 2 rate constant changed significantly when the pH was reduced. The CO-rebinding lifetime was more than halved on going from high to low pH, consistent with the results of previous pH studies of CO binding in myoglobin (23). Because process 1 in particular reflected the contributions of multiple microscopic processes, a deeper understanding of the photolysis kinetics required us to move beyond a phenomenological analysis. We thus turned to the microscopic model based on Equations 3-5 presented above, the results of which are discussed below.
TABLE 1.
Effect of pH on the observed ligand rebinding kinetics
Multi-wavelength photolysis data were fit to two exponentials as described in the text. T = 20 °C.
| pH | τ1 | Amp1 | τ2 | Amp2 |
|---|---|---|---|---|
| ns | % | μs | % | |
| 4.3 (0.175 mm NaCl) | 600 | 7.9 | 620 | 91.8 |
| 4.6 | 510 | 7.8 | 500 | 91.5 |
| 6.0 | 520 | 9.6 | 1630 | 88.8 |
| 7.3 | 490 | 9.7 | 1340 | 89.5 |
| 7.3 (0.175 mm NaCl) | 540 | 9.3 | 1580 | 90.4 |
| 8.4 | 510 | 9.8 | 1440 | 89.4 |
| 9.4 | 510 | 9.6 | 1210 | 89.4 |
| Lowa | 560 ± 60 | 7.8 ± 0.1 | 560 ± 60 | 91.6 ± 0.2 |
| Highb | 510 ± 20 | 9.6 ± 0.2 | 1400 ± 200 | 89.5 ± 0.6 |
Average of data for pH 4.3 (high salt) and 4.6.
Average of data for pH 6.0-9.4.
Water Occupancy Factors and Microscopic Rate Constants for Heme Hydration and Geminate CO Binding and Escape Versus pH—The first two SVD components of the photolysis data, which underlay the global-wavelength kinetic fitting procedures used in this study, are shown in Fig. 3. V1 corresponded closely to the time course of CO rebinding and U1 to the deoxy-Mb - MbCO difference spectrum, whereas U2 and V2 corresponded approximately to the distal pocket hydration difference spectrum and time course, respectively (26). (To permit comparisons between the hydration signal amplitudes at different pH values, the orthonormal Vi for each pH was weighted by its corresponding singular value Si and normalized to V1,1S1, a factor proportional to the prompt photolysis yield, where V1,1 is the earliest time element of V1.) The rise in V2 from a minimum toward its maximum value, starting ∼100 ns after photolysis, signaled the entry of a water molecule into the pocket. This water molecule reached its equilibrium occupancy by ∼1 μs and was eventually displaced by CO at ∼1 ms, the observed bimolecular recombination time constant (indicated by an up arrow in the decay of each V1 in Fig. 3). The ability of the microscopic hydration model to describe the photolysis kinetics at each pH using the parameter values shown in Table 2 was reflected in the good agreement between the SVD time courses and the calculated fits (see panels h-n).
TABLE 2.
Kinetic parameters for CO rebinding and distal pocket hydration as a function of pH
Rate constants and inverse lifetimes reported in μs−1; [CO] = 1.0 mm.
| pH | kFeCO | k′inCO[CO]a | koutCO | k′inH2O[H2O] | koutH2O | Kw[H2O] | nw | Φg | 1 - nw | k′[CO]b | τobs−1 |
|---|---|---|---|---|---|---|---|---|---|---|---|
| μs−1 | μs−1 | ||||||||||
| 4.3c | 0.11 | (0.08) | 1.5 | 55 | 23 | 2.4 | 0.70 | 0.068 | 0.30 | 0.0016 | 0.0016 |
| 4.6 | 0.12 | (0.08) | 1.5 | 21 | 10 | 2.1 | 0.68 | 0.077 | 0.32 | 0.0020 | 0.0020 |
| 6.0 | 0.10 | (0.08) | 1.9 | 16 | 2.8 | 5.7 | 0.86 | 0.051 | 0.14 | 0.00057 | 0.00061 |
| 7.3 | 0.12 | (0.08) | 2.0 | 15 | 2.8 | 5.4 | 0.84 | 0.058 | 0.16 | 0.00074 | 0.00074 |
| 7.3c | 0.12 | (0.08) | 2.1 | 9.2 | 1.6 | 5.8 | 0.85 | 0.052 | 0.15 | 0.00062 | 0.00063 |
| 8.4 | 0.12 | (0.08) | 2.0 | 13 | 2.3 | 5.6 | 0.85 | 0.057 | 0.15 | 0.00068 | 0.00069 |
| 9.4 | 0.12 | (0.08) | 1.9 | 18 | 3.6 | 5.0 | 0.83 | 0.060 | 0.17 | 0.00082 | 0.00083 |
| Lowd | 0.12 | (0.08) | 1.5 | 36 | 16 | 2.2 | 0.70 | 0.073 | 0.30 | 0.0018 | 0.0018 |
| Highe | 0.12 | (0.08) | 2.0 | 14 | 2.5 | 5.6 | 0.85 | 0.057 | 0.15 | 0.00068 | 0.00074 |
Constrained during fitting procedure to a maximum (diffusion controlled) value of 0.08 μs−1.
k′ ≡ (1 - nw)Φgk′inCO.
175 mm NaCl.
Simultaneous fit of pH 4.3 (+salt) and 4.6 photolysis data.
Simultaneous fit of pH 6.0, 7.3, 7.3 (+salt), 8.4 and 9.4 photolysis data.
Little difference is evident in the shape of the spectral components (panels a-g) with pH. (Note that the Ui amplitudes as displayed are arbitrary, being determined only by their band shapes and the number of wavelengths studied.) A small low - high pH difference (not shown) for the U1 basis spectra was consistent in amplitude (relative to the basis spectra) and shape with the small changes induced by pH in the MbCO spectrum (Fig. 1). This was as expected because the U1 spectra are essentially deoxy-Mb - MbCO difference spectra and the spectrum of the latter species changed more over the pH range studied.
The change in amplitude of the water entry signal with pH can be seen in panels h-n of Fig. 3, wherein the V basis vectors have been weighted by their singular values, which scale the orthonormal vectors according to their overall contribution to the data at a given pH. A correlation between water occupancy and bimolecular CO recombination kinetics is evident in panels h-n. The doubling of the observed rebinding time on going from low (panels h and i) to high (panels j-n) pH was correlated with an ∼20% increase in the relative peak to trough amplitude of the second SVD component (the water entry signal). In this regard, the relative constancy of the U2 spectral shape with pH supported the assumption implicit here that the amplitude change in the water-entry signal was not simply due to a spectral perturbation arising from an unrelated process, e.g. the proximal histidine protonation and His-Fe bond breakage mentioned above. This point is discussed more fully below.
Similarly, the calculated distal pocket water occupancy values shown in Table 2 can be divided into two groups. The values from the two lowest pH data sets, pH 4.3 and 4.6, were very close to their mean value of 0.69 ± 0.01 (which was also the same, within experimental uncertainty, as the value calculated by fitting both data sets simultaneously). The values for the higher pH data sets, on the other hand, clustered closely around a mean value of 0.85 ± 0.01 (the same value was also calculated by fitting all the high pH data sets simultaneously). The ∼20% difference in calculated water occupancy values between low and high pH was clearly statistically significant and consistent with the change noted above in the amplitude of the water entry signal. This difference is expected to have a disproportionately large effect on ligand rebinding kinetics because it corresponds to a factor of 2 difference in the water vacancy factor 1 - nw, the latter quantity being a determining factor in the observed CO bimolecular recombination rate (see “Discussion” below).
The kinetic rate constant values underlying the calculated nw values were also clustered into two groups corresponding to the same pH break point as observed for the nw values, the k′inH2O[H2O] and koutH2O values for the two lowest pH data sets being faster than the corresponding k values for the higher pH data sets (see Table 2). However, the large uncertainties in these quantities (the mean k′inH2O[H2O] value was 38 ± 24 μs-1 at low pH versus 14 ± 3 μs-1 at high pH and the mean koutH2O value was 16 ± 9 at low pH versus 2.6 ± 0.7 at high pH) indicates that this trend may not be significant. Probably the main conclusion that can be drawn from the microscopic rate constants for hydration, aside from the nw values calculated from their ratios, is that they were generally fast enough that CO escape was the rate-limiting step in distal pocket hydration over the pH range studied.
The small increase in geminate yield at low pH reflected in the ϕg values in Table 2 appeared to stem from a small decrease in the geminate escape rate constant. However, previous studies of MbCO photolysis kinetics have attributed the increase observed in ϕg at lower pH to faster geminate rebinding (31, 39). Indeed, we also observed a similar increase in the geminate rebinding rate constant when we used the Soret region absorption to monitor the photolysis kinetics (results not shown), without interference from the distal water signal present in the visible bands, as was typically done in previous photolysis studies. These observations led us to conclude that the large effect of the water entry signal noted above on the geminate time scale evolution of the visible band spectrum probably interfered with an accurate analysis of changes in the geminate yield in terms of changes in the underlying geminate rebinding and escape rate constants. Moreover, because of the well known nonexponential character of the room temperature geminate rebinding kinetics of MbCO, the kinetic treatment in terms of a single geminately dissociated ligand state used here clearly oversimplified a complex process (40). In any event, the important quantity in the present kinetic analysis was the geminate yield, and the ϕg values found here (Table 2) were in reasonable agreement with those obtained from Soret absorption photolysis measurements (31). Because the observed ligand bimolecular recombination rate constant was proportional to ϕg, the pH-induced change in geminate yield observed here increased the k′ rate by a factor of 1.3 at low pH, significantly less than the change associated with the heme pocket water vacancy factor (factor of 2.0) reported above.
The k′inCO [CO] values listed in Table 2 corresponded at all pH values to the highest value permitted by the fitting procedure, which was constrained to the near diffusion-controlled value observed previously for H64L Mb (26). To investigate whether this constraint in the fitting procedure may have obscured a pH-induced variation in the rate of ligand diffusion to the pocket, we also applied a modified fitting procedure. In that procedure, k′inCO was not constrained and the calculated extinction spectra of the intermediates were constrained to resemble those determined in the previous fitting procedure. The modified procedure returned rates for the high pH data that were very similar to those shown in Table 2, whereas the mean low-pH rates changed such that ϕg dropped to 0.054, k′inCO [CO] increased to 0.14 μs-1, and nw increased to 0.75. Although the results of this alternate analysis seemed to suggest an increase in the speed of ligand access to the pocket at low pH, the change in this factor was mainly counterbalanced by a lower geminate recombination yield than expected from previous Soret band studies. The poor fit to the geminate yield led us to conclude that the alternate fitting results did not constitute convincing evidence for an increase in k′inCO at low pH. However, the possibility of some effect intermediate between that suggested by the alternate analysis and the complete lack of effect suggested by the values in Table 2 could not be ruled out. This was largely because of the difficulty in fitting visible band data for the (small amplitude) geminate recombination process in the presence of the water-entry spectral perturbation. Perhaps more importantly, the results of the alternative fitting procedure did underscore the robustness of the decrease in water occupancy observed on going from high to low pH with respect to variations in the modeling procedures used.
DISCUSSION
Spectrokinetic Detection of Distal Heme Pocket Water Occupancy Versus pH—We analyzed previously the hydration and ligand rebinding kinetics of wild-type MbCO and several distal pocket mutants at neutral pH to unravel the influences of distal pocket hydration and geminate rebinding in modulating the observed bimolecular binding rate (26). That study found that the amplitude of a small spectral blue shift in the heme visible bands could be used to measure the amount of water that entered the distal pocket about a microsecond after CO photolysis, as the geminately dissociated ligand left the pocket and diffused into the bulk solution. (Note that water entry is also much slower than the heme pocket conformational relaxations that follow CO photodissociation within ∼100 ps, such as doming of the porphyrin ring plane and movement of His64 away from the solvent and toward the pocket (41, 42).) Although not coordinated to the heme, this water molecule hydrogen bonds with the distal histidine residue and presents a kinetic barrier to ligand re-entry and binding because the distal heme pocket is evidently too small at this site to simultaneously accommodate both ligand and water (5, 7, 42). Consequently, the overall bimolecular ligand recombination rate constants for the Mb variants observed in the previous study could be well described by the expression,
 |
(Eq.6) |
where (1 - nw) is the distal water molecule vacancy factor and k′inCO, the microscopic bimolecular rate constant, was close to the diffusion-controlled value for heme-ligand binding, ∼1 × 10⁸ m-1 s-1 (43, 44).
We now report that the agreement observed previously at neutral pH between τobs-1 and the k′ value calculated from water occupancy extends over the pH range examined in the present study, pH 4.3-9.4 (see Table 2). Mutation-induced changes in the bimolecular rebinding rate were found previously to be due primarily to concomitant changes in the water occupancy factor, changes in the geminate yield playing a secondary role for the mutants studied. The present results indicate that a similar situation holds for the perturbation presented by increasing solution acidity, the latter inducing changes in nw that were apparently the dominant determinant of the variations in ligand rebinding kinetics observed over this pH range. In other words, the nearly 3-fold decrease in the observed distal histidine-water binding constant (Kw in Table 2) accounted nearly quantitatively, via the factor 1 - nw in Equation 6, for the increase in k′ observed on going from neutral to pH ∼ 4.5.
Does Tetracoordinate Deoxy-Mb Formation Affect the nw Assay at pH 4.3-4.6?—Before discussing the model proposed below for the pH-induced changes in nw presented in Table 2, we first address the possibility of an alternative assignment for the origin of the pH dependence of the water entry signal. Given the small size of the water signal, could the change observed here be due to another small spectral perturbation known to accompany this pH change in equilibrium measurements? Specifically, if the change in water signal was due to the change in heme absorption mentioned above that accompanies 5-10% protonation of the proximal histidine and corresponding partial loss of proximal histidine-heme coordination at pH 4.3-4.6, then the trends noted in Table 2 would not accurately reflect variations in nw.
We present two reasons why we believe this alternative hypothesis can be discarded. First, the spectral shapes of our relaxation signal and the perturbation caused by proximal histidine protonation are very different, making it very difficult to explain our spectrokinetic results with a mechanism invoking proximal histidine protonation, the “fingerprints” simply do not match. To see this, compare the pH-induced spectral changes in the static deoxy-Mb spectrum shown in Fig. 2, which correspond to those expected from proximal histidine protonation, to the very different spectral shapes of the time-dependent water entry signals shown in Fig. 3. The latter also show no evidence of pH-induced differences that would indicate tetracoordinate heme formation at lower pH. Second, given that the proximal His pKa values of MbCO and deoxy-Mb are significantly different, that for MbCO being significantly lower than 3.45 (30), then CO photolysis could in principle trigger time evolution in the protonation level of the proximal histidine as the system re-equilibrates to the increase in pKa. In particular, that scenario could have affected our water entry results if the proximal His protonation and bond breakage time scale matched that of the water-entry signal. Such a coincidence would allow the kinetic analysis to conflate the two processes. (Ignoring for the moment the problem mentioned above that this would imply significant distortion of the low-pH waterentry difference spectra in Fig. 3 compared with those at neutral and high pH by “contamination” from the low-pH difference spectra in Fig. 2, contrary to observation.) However, rather than being coincident, the rates in question are known to be very different. Time-resolved resonance Raman studies indicate that proximal histidine protonation and Fe-bond breakage at low pH to form the equilibrium tetracoordinate heme species are much slower processes than ligand rebinding (∼1 ms), and thus very much slower than the water entry signal (∼1 μs) (45, 46). Thus, the rates are ordered: water entry > ligand rebinding > proximal protonation/His-Fe bond loss. Moreover, we can reasonably expect from this rate ordering that there would not have been sufficient time for the deoxy species created by photolysis to undergo a significant change in the proximal coordination state before bimolecular CO rebinding ended each water entry measurement ∼1 ms after photolysis. This scenario is also consistent with the lack of evidence for tetracoordinate heme formation in our time-resolved deoxy-Mb photolysis difference spectra.
The subnanosecond production of small amounts of a non-equilibrium tetracoordinate heme species in the deoxy-Mb photoproduct has been inferred from pulsed resonance Raman photolysis measurements at pH < 4 (45). However, the population of this intermediate is expected to be negligible at pH > 4. Moreover, the rate of its production is too fast and the rate of its bimolecular combination with CO is expected to be too slow, k′[CO] < 0.1 μs-1 (23), for either of these processes to be conflated with the water entry signal by the kinetic modeling procedure. Thus, the hypothesis that the change in amplitude of the water entry signal observed here was caused by interference from proximal protonation-induced spectral changes comes up against spectral and kinetic inconsistencies that make that reassignment very unlikely.
Coupling of Distal Water Occupancy with Distal Histidine
Conformation—The model we propose for the pH dependence of the
distal heme pocket water occupancy observed here for deoxy-Mb is based on
previous spectroscopic and crystal structure evidence that protonation of the
imidazole side chain of the distal histidine is coupled to an equilibrium
between two protein conformations. A “down” (or
“closed”) conformation places the distal histidine within the heme
pocket (pKa = 3.8-5.0) and an “up” (or
“open”) out-of-pocket conformation exposes it to the solvent
(pKa = 6.0)
(28-31).
The pKa of His64 in its down conformation has
been estimated to be <5 by using NMR spectroscopy
(47,
48); ∼4.4 by heme visible
band, Fe-CO resonance Raman, and CO stretch IR spectroscopies
(38,
49,
50); and 3.8 by Morikis et
al. (30) using an
explicit 4-state model to analyze their Fe-CO resonance Raman data. The
reported pKa values of ∼4.4 may actually represent a
weighted average of the down (closed) and up (open) values in the 4-state
coupled equilibrium model of Morikis et al.
(30), as suggested previously
by Ramsden and Spiro (49). The
up conformation is seen most clearly in the crystal structure of MbCO at pH 4,
where Yang and Phillips (29)
assigned it an occupancy value of 0.97, whereas the down conformation is
dominant at neutral pH (Fig.
4). They observed the protonated distal histidine to be rotated
∼90° out of the distal pocket, pushing away Arg45 and
disrupting the salt bridge of the latter with the heme-6-propionate group.
That His64 undergoes a similar pH-coupled conformational change in
deoxy-Mb, albeit with less driving force toward the up conformation, can be
inferred from the occupancy values of 0.56 and 0.79 observed for the down
conformation at pH 4 and 5, respectively. These values imply conformational
equilibria with up occupancy values of ∼0.4 and ∼0.2, respectively.
Importantly, protonated His64 still hydrogen bonds with a water
molecule in the down conformation, the protonated water-imidazole group moving
deeper inside the pocket due to electrostatic repulsion with the heme iron
(Fig. 5). The range of
conformational free energy differences implied by the crystal structure
occupancies (and the pKa values of Morikis et al.
(30)) are shown
below.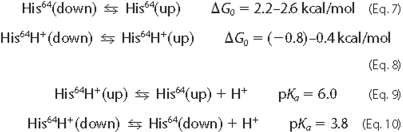
FIGURE 4.

Comparison of crystallographic structures of carbonmonoxymyoglobin heme pocket as a function of pH. pH 4 (red, Protein Data Bank code 1spe), pH 5 (green, PDB code 1vxc), pH 6 (blue, PDB code 1vxf), and pH 7 (gray, PDB code 1a6g) are shown. a, view perpendicular to the proximal histidine (His 93). b, view nearly parallel to the proximal histidine (29).
FIGURE 5.

Comparison of crystallographic structures of deoxymyoglobin heme pocket as a function of pH. pH 4 (red, PDB code 1vxa), pH 5 (green, PDB code 1vxd), pH 6 (blue, PDB code 1vxg), and pH 7 (gray, PDB code 1a6n) are shown. a, view perpendicular to the proximal histidine (His 93). b, view nearly parallel to the proximal histidine (29).
Tian et al. (31) and Morikis et al. (30) studied extensively the kinetics and thermodynamics of the open and closed forms of sperm whale MbCO and MbO2 in solution using resonance Raman and time-resolved absorption spectroscopy (30, 31). They found that the pH dependence of the two forms were inconsistent with those predicted from a two-state model in which protonated His64 is entirely out, and unprotonated His64 entirely in, the pocket. They found instead that a four-state model that explicitly accounted for the different unprotonated-protonated equilibria of each conformation, the closed form having a His64 pKa of ∼4 and the open form having a pKa of ∼6, best explained the kinetic and thermodynamic changes observed with variations in pH. In other words, although protonation does favor the open form, it is less strongly coupled to conformational change than would be required for a two-state model. At pH 7.0, they estimated that ∼5% of the His64 was in the open form in MbCO, greater than that predicted by a two-state model. Aqueous deoxy-Mb solution values for the open form fractional populations at pH 4 and 5 can be inferred from the thermodynamic linkage between their estimates for the conformational equilibrium constant between the aggregate closed and open forms of MbCO, the CO affinities, and the desired deoxy conformational equilibrium constant. The aqueous deoxy-Mb values, 0.6 and 0.2, respectively, were in reasonable agreement with the corresponding crystal values. The solution values inferred here for the free energies of the deprotonated and protonated His64 conformational equilibria in deoxy-Mb, 2.3 and -0.8 kcal/mol, respectively, were within the range inferred from the crystal data.
We suggest that the drop in distal water occupancy observed in the present work is correlated with the increased population of up(open)-His64 protein conformers expected at lower pH. In this scenario, the distal water occupancy decreases because protonation drives the His64-water complex to rotate out of the pocket, the rotated distal histidine effectively pulling much of the water molecule occupancy out along with it. From this point of view, the low pH nw value reported in Table 2 represented a weighted average of intrinsic nw values for the up and down conformational populations,
 |
(Eq.11) |
where fup is the fractional population of up conformers and nw(up) < nw(down) because of the missing stabilization by His64 H-bonding in the pocket of the up species. A detailed pH analysis of the distal pocket hydration and ligand binding kinetics after CO photolysis in terms of a four-state kinetic model such as that of Tian et al. (31) was beyond the scope of the present study. However, we estimated this average very roughly by assuming that the nw value observed at neutral pH represented that of the down conformation and the value observed for a mutant replacing His64 with a small apolar residue such as glycine or alanine represented that of the up conformation. These values were then averaged using the conformational equilibrium expected at pH 4.5 from the free energies given above. Note that the first assumption implicitly involved the further assumption that the protonated distal histidine stabilizes a water molecule in the pocket about as effectively as when this residue is unprotonated, so that we could assume that both down forms have the same nw value. The high distal water occupancy observed in the crystal structure of the protonated down conformation seems consistent with this assumption (29). The second assumption is supported by the suggestion by Tian et al. (31) that H64G Mb is a good model for the up conformation, having an observed bimolecular CO binding rate constant (k′[CO(1 atm)] = 0.0058 s-1) very similar to that inferred for the latter conformation (k′[CO(1 atm)] = 0.0056 s-1). Although a measured nw value for H64G deoxy-Mb does not seem to be available, the value for a similar mutant, H64A, has been measured to be 0.40 (26). The latter mutant also binds CO very quickly, having a k′ value similar to that of the up conformation. Using this approach, we arrived at an estimate of <nw>= 0.68-0.70 at pH 4.5, where the range of estimates corresponded to the conformational free energy values of Tian et al. (31) (low end) and the values inferred from the crystal data of Yang and Phillips (29) (high end). We took this range as being in good agreement with the observed low pH value (0.70) given the crudeness of the assumptions involved. (We also point out that this approach assumed that the time scale for re-equilibration between up and down conformations after CO photodissociation was rapid compared with the time scale over which we measured the distal pocket steady-state hydration and subsequent diffusive ligand rebinding. This assumption appears to be reasonable given that the latter processes extended in time to ∼1 ms, whereas the former is apparently complete by ∼1 μs (31). It is also consistent with previous MbCO photolysis results obtained from time-resolved x-ray crystallography (42) and time-resolved absorption spectroscopy in highly viscous solvent (41) (at basic and neutral pH, respectively) suggesting that distal histidine conformational relaxation precedes water entry.)
This analysis suggests that the principal structural basis for the rapid ligand binding kinetics attributed previously to the up conformation (31) is its low distal water occupancy compared with that of the down (neutral pH) conformation. The lower probability of finding a water molecule in the distal pocket of the up conformation presents a smaller barrier to ligand entry. This structural interpretation is consistent with the finding that most of the increase in k′ observed here at lower pH was due to an increase in the distal water vacancy factor (1 - nw), although an increase in ϕg also made a smaller contribution. This interpretation is also consistent with previous results for H64A Mb (again taking this mutant as an up model system). The distal water vacancy factor contributed a factor of ∼4 to the increase in ligand rebinding rate of the mutant, whereas its higher geminate yield contributed a factor of ∼2, compared with that of wild type Mb.
The interpretation of the rapid ligand binding kinetics of the up conformation in terms of distal water occupancy that is presented here differs from interpretations given in previous studies. Previous interpretations have typically focused on the notion of a more open channel between the distal pocket and the bulk solvent through which ligands may diffuse to the pocket, a channel controlled by the distal histidine “gate” (30, 31, 51-55). The present results for nw, on the other hand, point to steric crowding within the pocket itself by water occupancy as the dominant factor, and the partial relief of this crowding that occurs in the up conformation as loss of H-bonding to the distal histidine destabilizes water in the pocket. (Although, as pointed out above, a smaller contribution from increased diffusion of ligand to the pocket cannot be completely ruled out at lower pH. Of course, we also cannot rule out an accidental coincidence between an increased rate of diffusion through the distal histidine channel and an offsetting decrease in ligand diffusion to the pocket through alternate channels at low pH.) Altogether, these results suggest that apparent opening of the histidine “gate” in general, whether through a pH-driven conformational change or other modifications (e.g. distal pocket mutations), may correspond to reduced intra-pocket crowding by the distal histidine-water complex, as well as to more frequent openings of the distal histidine channel itself.
The conclusion that the more open pocket of the up configuration has a lower water occupancy than that of the down conformation may seem counterintuitive given the greater volume available to accommodate water in the former. However, as mentioned above, this finding is consistent with the relatively low nw value observed for H64A Mb, which has a more open distal pocket than wild type Mb. These observations imply that the electrostatic interaction with His64 provides greater enthalpic stabilization for water in the distal pocket than the entropic destabilization presented by the steric bulk of the imidazolic side chain.
Implications for Rebinding Kinetics at pH < 4—A simple extrapolation of these findings to lower pH values suggests that a significant fraction of the broader variation in ligand binding kinetics observed in previous studies extending down to pH ∼ 3 may arise from the distal histidine-water complex mechanism presented here, in addition to the proximal histidine mechanism referenced above. The pKa value of ∼4 for the down conformation implies that lowering the pH below 4 will drive further His64 protonation and coupled protein conformational change, further decreasing the distal water occupancy and increasing ligand binding rates. Disentangling the relative contributions of the proximal and distal mechanisms at very low pH will require the use of flow-flash techniques to rapidly drop the pH and measure the photolysis spectrokinetics of the heme visible-band water signal before the proximal histidine-heme linkage breaks and the protein denatures.
Acknowledgments
We thank Drs. Jayashree Soman and John S. Olson for helpful comments.
This work was supported, in whole or in part, by National Institutes of Health Grants EB02056 (to D. S. K.) and GM52588 (to R. M. E.) and Research Infrastructure in Minority Institutions Program Grant P20 MD000262 from NCMHD, National Institutes of Health. This work was also supported by fellowship support from the Graduate Assistance in Areas of National Need Grant DOE GAANN P200A010103 (to S. B.), Minority Access to Research Careers National Institutes of Health Grant MBRS MARC 5T34 GM08574 (to M. L. P.), the ARCS foundation (to R. A. J.), and the Louis Stokes Alliance for Minority Participation (to J. L. M.). The costs of publication of this article were defrayed in part by the payment of page charges. This article must therefore be hereby marked “advertisement” in accordance with 18 U.S.C. Section 1734 solely to indicate this fact.
Footnotes
The abbreviations used are: Mb, myoglobin; SVD, singular value decomposition.
References
- 1.Quillin, M. L., Arduini, R. M., Olson, J. S., and Phillips, G. N., Jr. (1993) J. Mol. Biol. 234140 -155 [DOI] [PubMed] [Google Scholar]
- 2.Spiro, T. G., and Kozlowski, P. M. (2001) Acc. Chem. Res. 34137 -144 [DOI] [PubMed] [Google Scholar]
- 3.De Angelis, F., Jarzecki, A. A., Car, R., and Spiro, T. G. (2005) J. Phys. Chem. B 1093065 -3070 [DOI] [PubMed] [Google Scholar]
- 4.Scott, E. E., Gibson, Q. H., and Olson, J. S. (2001) J. Biol. Chem. 2765177 -5188 [DOI] [PubMed] [Google Scholar]
- 5.Olson, J. S., and Phillips, G. N., Jr. (1997) J. Biol. Inorg. Chem. 2544 -552 [Google Scholar]
- 6.Olson, J. S., and Phillips, G. N., Jr. (1996) J. Biol. Chem. 27117593 -17596 [DOI] [PubMed] [Google Scholar]
- 7.Rohlfs, R. J., Mathews, A. J., Carver, T. E., Olson, J. S., Springer, B. A., Egeberg, K. D., and Sligar, S. G. (1990) J. Biol. Chem. 2653168 -3176 [PubMed] [Google Scholar]
- 8.Gilles-Gonzalez, M. A., and Gonzalez, G. (2005) J. Inorg. Biochem. 991 -22 [DOI] [PubMed] [Google Scholar]
- 9.Spiro, T. G., and Jarzecki, A. A. (2001) Curr. Opin. Chem. Biol. 5 715-723 [DOI] [PubMed] [Google Scholar]
- 10.Fermi, G., Perutz, M. F., Shaanan, B., and Fourne, R. (1984) J. Mol. Biol. 175159 -174 [DOI] [PubMed] [Google Scholar]
- 11.Bonaventura, C., Cashon, R., Bonaventura, J., Perutz, M., Fermi, G., and Shih, D. T.-B. (1991) J. Biol. Chem. 26623033 -23040 [PubMed] [Google Scholar]
- 12.Bonaventura, C., Bonaventura, J., Shih, D. T.-B., Iben, E. T., and Friedman, J. (1999) J. Biol. Chem. 2748686 -8693 [DOI] [PubMed] [Google Scholar]
- 13.Peterson, E. S., Huang, S., Wang, J., Miller, L. M., Vidugiris, G., Kloek, A. P., Goldberg, D. E., Chance, M. R., Wittenberg, J. B., and Friedman, J. M. (1997) Biochemistry 3613110 -13121 [DOI] [PubMed] [Google Scholar]
- 14.Dantsker, D., Samuni, U., Ouellet, Y., Wittenberg, B. A., Wittenberg, J. B., Milani, M., Bolognesi, M., Guertin, M., and Friedman, J. M. (2004) J. Biol. Chem. 27938844 -38853 [DOI] [PubMed] [Google Scholar]
- 15.Hou, S., Larsen, R. W., Boudko, D., Riley, C. W., Karatan, E., Zimmer, M., Ordal, G. W., and Alam, M. (2000) Nature 403540 -544 [DOI] [PubMed] [Google Scholar]
- 16.Aono, S., Kato, T., Matsuki, M., Nakajima, H., Ohta, T., Uchida, T., and Kitagawa, T. (2002) J. Biol. Chem. 27713528 -13538 [DOI] [PubMed] [Google Scholar]
- 17.Freitas, T. A., Hou, S., and Alam, M. (2003) FEBS Lett. 55299 -104 [DOI] [PubMed] [Google Scholar]
- 18.Geibel, J., Chang, C. K., and Traylor, T. G. (1975) J. Am. Chem. Soc. 975924 -5926 [DOI] [PubMed] [Google Scholar]
- 19.Cannon, J., Geibel, J., Whipple, M., and Traylor, T. G. (1976) J. Am. Chem. Soc. 983395 -3396 [DOI] [PubMed] [Google Scholar]
- 20.Giacometti, G. M., Traylor, T. G., Ascenzi, P., Brunori, M., and Antonini, E. (1977) J. Biol. Chem. 2527447 -7448 [PubMed] [Google Scholar]
- 21.Doster, W., Beece, D., Bowne, S. F., DiIorio, E. E., Eisenstein, L., Frauenfelder, H., Reinisch, L., Shyamsunder, E., Winterhalter, K. H., and Yue, K. T. (1982) Biochemistry 214831 -4839 [DOI] [PubMed] [Google Scholar]
- 22.Traylor, T. G., Deardurff, L. A., Coletta, M., Ascenzi, P., Antonini, E., and Brunori, M. (1983) J. Biol. Chem. 25812147 -12148 [PubMed] [Google Scholar]
- 23.Coletta, M., Ascenzi, P., Traylor, T. G., and Brunori, M. (1985) J. Biol. Chem. 2604151 -4155 [PubMed] [Google Scholar]
- 24.Lambright, D. G., Balasubramanian, S., and Boxer, S. G. (1989) J. Mol. Biol. 207289 -299 [DOI] [PubMed] [Google Scholar]
- 25.Sage, J. T., Morikis, D., and Champion, P. M. (1991) Biochemistry 301227 -1237 [DOI] [PubMed] [Google Scholar]
- 26.Goldbeck, R. A., Bhaskaran, S., Ortega, C., Mendoza, J. L., Olson, J. S., Soman, J., Kliger, D. S., and Esquerra, R. M. (2006) Proc. Natl. Acad. Sci. U. S. A. 1031254 -1259 [DOI] [PMC free article] [PubMed] [Google Scholar]
- 27.Esquerra, R. M., Goldbeck, R. A., Kim-Shapiro, D. B., and Kliger, D. S. (1998) Biochemistry 3717527 -17536 [DOI] [PubMed] [Google Scholar]
- 28.Kuriyan, J., Wilz, S., Karplus, M., and Petsko, G. A. (1986) J. Mol. Biol. 192133 -154 [DOI] [PubMed] [Google Scholar]
- 29.Yang, F., and Phillips, G. N., Jr. (1996) J. Mol. Biol. 256762 -774 [DOI] [PubMed] [Google Scholar]
- 30.Morikis, D., Champion, P. M., Springer, B. A., and Sligar, S. G. (1989) Biochemistry 284791 -4800 [DOI] [PubMed] [Google Scholar]
- 31.Tian, W. D., Sage, J. T., and Champion, P. M. (1993) J. Mol. Biol. 233155 -166 [DOI] [PubMed] [Google Scholar]
- 32.Egeberg, K. D., Springer, B. A., Sligar, S. G., Carver, T. E., Rohlfs, R. J., and Olson, J. S. (1990) J. Biol. Chem. 26511788 -11795 [PubMed] [Google Scholar]
- 33.Carver, T. E., Brantley, R. E., Jr., Singleton, E. W., Arduini, R. M., Quillin, M. L., Phillips, G. N., Jr., and Olson, J. S. (1992) J. Biol. Chem. 26714443 -14450 [PubMed] [Google Scholar]
- 34.Springer, B. A., and Sligar, S. G. (1987) Proc. Natl. Acad. Sci. U. S. A. 848961 -8965 [DOI] [PMC free article] [PubMed] [Google Scholar]
- 35.Goldbeck, R. A., and Kliger, D. S. (1993) Methods Enzymol. 226147 -177 [DOI] [PubMed] [Google Scholar]
- 36.Henry, E. R., and Hofrichter, J. (1991) Methods Enzymol. 210129 -192 [Google Scholar]
- 37.Goldbeck, R. A., and Kliger, D. S. (2001) in Encyclopedia of Chemical Physics and Physical Chemistry (Moore, J. H., and Spencer, N. D., eds) pp.2637 -2656, IOP, Bristol
- 38.Fuchsman, W. H., and Appleby, C. A. (1979) Biochemistry 181309 -1321 [DOI] [PubMed] [Google Scholar]
- 39.Ansari, A., Berendzen, J., Braunstein, D., Cowen, B. R., Frauenfelder, H., Hong, M. K., Iben, I. E. T., Johnson, J. B., Ormos, P., Sauke, T. B., Scholl, R., Schulte, A., Steinbach, P. J., Vittitow, J., and Young, R. D. (1987) Biophys. Chem. 26 337-355 [DOI] [PubMed] [Google Scholar]
- 40.Tian, W. D., Sage, J. T., Srajer, V., and Champion, P. M. (1992) Phys. Rev. Lett. 68 408-411 [DOI] [PubMed] [Google Scholar]
- 41.Dantsker, D., Samuni, U., Friedman, J. M., and Agmon, N. (2005) Biochim. Biophys. Acta 1749234 -251 [DOI] [PubMed] [Google Scholar]
- 42.Schotte, F., Soman, J., Olson, J. S., Wulff, M., and Anfinrud, P. A. (2004) J. Struct. Biol. 147235 -246 [DOI] [PubMed] [Google Scholar]
- 43.Barboy, N., and Feitelson, J. (1987) Biochemistry 263240 -3244 [DOI] [PubMed] [Google Scholar]
- 44.Cao, W., Christian, J. F., Champion, P. M., Rosca, F., and Sage, J. T. (2001) Biochemistry 405728 -5737 [DOI] [PubMed] [Google Scholar]
- 45.Sage, J. T., Li, P., and Champion, P. M. (1991) Biochemistry 301237 -1247 [DOI] [PubMed] [Google Scholar]
- 46.Tang, Q., Kalsbeck, W. A., and Bocian, D. F. (1997) Biospectroscopy 317 -29 [Google Scholar]
- 47.Cocco, M. J., Kao, Y.-H., Phillips, A. T., and Lecomte, J. T. J. (1992) Biochemistry 316481 -6491 [DOI] [PubMed] [Google Scholar]
- 48.Bashford, D., Case, D. A., Dalvit, C., Tennant, L., and Wright, P. E. (1993) Biochemistry 328045 -8056 [DOI] [PubMed] [Google Scholar]
- 49.Ramsden, J., and Spiro, T. G. (1989) Biochemistry 283125 -3128 [DOI] [PubMed] [Google Scholar]
- 50.Müller, J. D., McMahon, B. H., Chien, E. Y. T., Sligar, S. G., and Nienhaus, G. U. (1999) Biophys. J. 771036 -1051 [DOI] [PMC free article] [PubMed] [Google Scholar]
- 51.Chance, B., Ravilly, A., and Rumen, N. (1966) J. Mol. Biol. 17525 -534 [DOI] [PubMed] [Google Scholar]
- 52.Case, D. A., and Karplus, M. (1979) J. Mol. Biol. 132343 -368 [DOI] [PubMed] [Google Scholar]
- 53.Ringe, D., Petsko, G. A., Kerr, D. E., and Ortiz de Montellano, P. R. (1984) Biochemistry 23 2-4 [DOI] [PubMed] [Google Scholar]
- 54.Johnson, K. A., Olson, J. S., and Phillips, G. N., Jr. (1989) J. Mol. Biol. 207459 -463 [DOI] [PubMed] [Google Scholar]
- 55.Perutz, M. F. (1989) Trends Biochem. Sci. 1442 -44 [DOI] [PubMed] [Google Scholar]