Abstract
Recently we have shown that the metabotropic glutamate 5 (mGlu5) receptor can be expressed on nuclear membranes of heterologous cells or endogenously on striatal neurons where it can mediate nuclear Ca2+ changes. Here, pharmacological, optical, and genetic techniques were used to show that upon activation, nuclear mGlu5 receptors generate nuclear inositol 1,4,5-trisphosphate (IP3) in situ. Specifically, expression of an mGlu5 F767S mutant in HEK293 cells that blocks Gq/11 coupling or introduction of a dominant negative Gαq construct in striatal neurons prevented nuclear Ca2+ changes following receptor activation. These data indicate that nuclear mGlu5 receptors couple to Gq/11 to mobilize nuclear Ca2+. Nuclear mGlu5-mediated Ca2+ responses could also be blocked by the phospholipase C (PLC) inhibitor, U73122, the phosphatidylinositol (PI) PLC inhibitor 1-O-octadecyl-2-O-methyl-sn-glycero-3-phosphorylcholine (ET-18-OCH3), or by using small interfering RNA targeted against PLCβ1 demonstrating that PI-PLC is involved. Direct assessment of inositol phosphate production using a PIP2/IP3 “biosensor” revealed for the first time that IP3 can be generated in the nucleus following activation of nuclear mGlu5 receptors. Finally, both IP3 and ryanodine receptor blockers prevented nuclear mGlu5-mediated increases in intranuclear Ca2+. Collectively, this study shows that like plasma membrane receptors, activated nuclear mGlu5 receptors couple to Gq/11 and PLC to generate IP3-mediated release of Ca2+ from Ca2+-release channels in the nucleus. Thus the nucleus can function as an autonomous organelle independent of signals originating in the cytoplasm, and nuclear mGlu5 receptors play a dynamic role in mobilizing Ca2+ in a specific, localized fashion.
Many cells produce Ca2+ signals both in the cytoplasm as well as the nucleus. Nuclear Ca2+ is thought to play a vital role in a variety of nuclear functions such as cell division, proliferation, protein import, apoptosis, and gene transcription (1). Nuclear Ca2+ may be mobilized from a number of sources including diffusion of cytosolic Ca2+ waves through nuclear pore complexes (2), release into the nucleoplasm from the nuclear lumen (3, 4), or release from the so-called nucleoplasmic reticulum, invaginations of the nuclear envelope into the nucleoplasm itself (5). Presumably Ca2+ release from the lumen of the nuclear membrane and/or the nucleoplasmic reticulum would either amplify Ca2+ signals arriving via the nuclear pore complex and/or independently generate nucleoplasmic Ca2+ transients. Such a model of nuclear Ca2+ release is bolstered by data documenting the presence and activation of the inositol 1,4,5-trisphosphate receptors (IP3 Rs)2 and ryanodine receptors (RyRs) on inner nuclear membranes and the nucleoplasmic reticulum (3, 4, 6-9). Thus these Ca2+-release channels are perfectly poised to independently regulate nucleoplasmic Ca2+ levels.
Despite the importance of IP3Rs and RyRs in controlling the release of nuclear Ca2+, very little information is available regarding how these receptors themselves are activated. One of the most prevalent models is one in which IP3 produced in the cytoplasm diffuses into the nucleus thereby activating nuclear IP3Rs (10). This premise is supported by studies showing that extracellular insulin-like growth factor-1 (IGF-1) activates its own receptor as well as phospholipase C (PLC) to stimulate IP3 mobilization and the ensuing activation of both cytoplasmic and nuclear IP3Rs (11, 12). Alternatively, IP3 might be synthesized within the nucleus itself. This hypothesis is consistent with reports showing that the nucleus contains all of the enzymatic machinery necessary to synthesize IP3 (13). Moreover, the nucleus also has the components necessary for the production of the RyR agonists, cyclic ADP-ribose (14) or nicotinic acid adenine dinucleotide phosphate (7). Thus, the nucleus could potentially function as an independent signaling unit controlling Ca2+ signals in a specific, localized fashion.
How might nuclear IP3 be generated? Typically, cell surface G protein-coupled receptors (GPCRs) associated with Gq-like proteins (Gq and its close homolog, G11) (15) activate phospholipases such as PLC to hydrolyze phosphatidylinositol 4,5-bisphosphate (PIP2) leading to IP3 production. GPCRs coupling with Gi/o-like proteins can also increase IP3 levels via dissociated β/γ subunit activation of PLC (16, 17). These same mechanisms might also exist in the nucleus where several GPCRs have been recently localized not only to the plasma membrane but also intracellularly on nuclear membranes (18-20). For example, receptors known to couple to Gq/11 such as the prostaglandin EP receptor EP1, as well as the platelet-activating factor and lysophosphatidic acid (LPA-1) receptors have been found on the nuclear envelope (21). Similarly, we have shown that the Group 1 metabotropic glutamate receptors, mGlu1 and mGlu5, both of which couple to Gq/11, are endogenously expressed on the inner nuclear membranes of many different types of neurons (18, 19, 22). Gq itself is present on nuclear membranes (23). Moreover, we have previously shown that a GFP-tagged Gq protein co-localizes with mGlu5 and the inner nuclear membrane protein, lamin B2, in heterologous cell types (18). Thus, signaling systems are in place that could generate the requisite second messengers within the nucleoplasm itself.
Surprisingly, few studies have directly examined signal transduction pathways associated with nuclear GPCRs. Given the importance of nuclear Ca2+ signaling and the unlikelihood, at least in neurons, that IP3 could diffuse long distances from its presumed site of synthesis in neuronal processes, it seems reasonable to propose that IP3 is generated in situ via the actions of GPCRs located on the inner nuclear membrane. Here we show that, like plasma membrane receptors, activated nuclear mGlu5 receptors couple to Gq/11 and phosphatidylinositol (PI)-PLC in mGlu5-expressing HEK cells as well as striatal nuclei to generate IP3-mediated release of Ca2+ via Ca2+ release channels in the nucleus. Taken together, these data point to a novel mode of nuclear Ca2+ generation, independent of cytosolic Ca2+, mediated through activated nuclear GPCRs.
EXPERIMENTAL PROCEDURES
Materials—Quisqualate, 2-methyl-6-(phenylethynyl)-pyridine (MPEP), 7-hydroxyiminocyclopropan[b]chromen-1a-carboxylic acid ethyl ester (CPCCOEt), 1-(6-[17β-3-methoxyestra-1,3,5-(10)-triene-17-yl]amino/hexyl)1H-pyrrole-2,5-dione (U73122), O-(octahydro-4,7-methano-1H-inden-5-yl)carbonopotassium dithioate (D609), and 2-aminoethoxydiphenylborane (2-APB) were purchased from Tocris Cookson Inc., Ellisville, MO. Phosphatidylinositol 3-kinase (PI3K) inhibitor, LY294002 was from Cell Signaling Technology, Inc., Beverly, MA; [1-(4-aminophenyl)-3-methylcarbamyl-4-methyl-3,4-dihydro-7,8-methylenedioxy-5H-2,3-benzodiazepine] (GYKI53655) was from Research Biochemicals Inc., Natick, MA; and myo-[2-3H]inositol (specific activity = 20.0 Ci/mmol) was from American Radiolabeled Chemicals, Inc., St. Louis, MO. Optiprep™ (60% Iodixanol) was purchased from Accurate Chemical and Scientific Corporation, Westbury, NY, and xestospongin C was from Calbiochem, San Diego, CA. Unless otherwise indicated all other chemicals were from Sigma.
Cell Culture and Plasmids—HEK293 cells and the mGlu5 stable HEK cell line were maintained as described (18, 24). Primary striatal cultures were prepared and maintained exactly as described (19). The mGlu5 mutant (F767S) was generated by recombinant polymerase chain reaction (25) using sense and antisense primers containing the relevant phenylalanine to serine mutation and wild type mGlu5 construct (24) as template. The mutation was confirmed by sequencing. The mGlu5 mutant F767S stable HEK cell line was generated using standard transfection techniques followed by repetitive rounds of limiting dilution (24). The construct containing the pleckstrin homology domain of PLCδ1 fused to enhanced green fluorescent protein (pEGFP-C1-PLCδ1-PH) was a gift from Dr. T. Meyer, Stanford University, Stanford, CA (26). pDsRed2 encoding DsRed2, a red fluorescent protein, was obtained from Clontech Laboratories, Inc., Mountain View, CA, and subcloned into the pcDNA3 vector. The dominant negative Gαq construct (pcDNA3.1+Gαq containing mutations Q209L/D277N) was obtained from the University of Missouri cDNA Resource Center, Rolla, MO, and was used as described (27).
RNA Interference—On-Target plus siRNA duplex targeting PLCβ1(5′-CAGUUGAAUUUGUCGAAUAUU-3′ and 5′-PUAUUCGACAAAUUCAACUGUU-3′) and On-Target plus scrambled siControl non-targeting siRNA number 1 (sequence of the sense strand 5′-UGGUUUACAUGUCGACUAA-3′) were purchased from Dharmacon, Inc., Chicago, IL. Neurons were transfected with either the PLCβ1 siRNA or scrambled siRNA or co-transfected along with the DsRed2 construct as a transfection marker (2 μg of siRNA + 200 ng of pcDNA3-DsRed2 construct per 35-mm dishes) using Lipofectamine 2000 (Invitrogen) as described (28). The efficacy of knockdown was confirmed by immunocytochemistry and Western blot analysis 48 and 72 h post-transfection.
Subcellular Fractionation and Preparation of Nuclei—Plasma membrane and nuclear fractions were prepared from HEK cells as described (18). Nuclei were prepared from postnatal day 10 (P10) rat striata as described (19) and further purified using a 25-35% (w/v) iodixanol gradient as per the manufacturer's instructions. Aliquots from each fraction were used for gel electrophoresis and membrane binding. Protein concentrations of each fraction were determined using the Bradford assay (Bio-Rad). Purity of nuclei was assessed by loading HEK cells or striatal neurons with the cytoplasmic mitochondrialselective stain MitoTracker Deep Red 633 as well as the DNA-specific vital dye, Hoechst 33258 as described (29). After a 20-min preincubation, subcellular fractionation was performed and nuclear staining was monitored.
Immunocytochemistry and Western Blot Analysis—Cells for immunocytochemical and confocal microscopic studies were grown on poly-d-lysine-treated glass coverslips, 8-well chamber slides, and/or dishes with 35-mm glass grids (Mat-Tek, Ashland, MA). Fixation, blocking, and antibody incubation were as described (24). Primary antibodies included affinity purified anti-C-terminal mGlu5 (1:250) (30), rabbit polyclonal anti-mGlu5 (1:200; Upstate/Millipore, Charlottesville, VA), and monoclonal anti-lamin B2 (1:100; Zymed Laboratories, San Francisco, CA). Anti-PLCβ1 (1:300 of mouse monoclonal, K92) was a gift from Dr. Pann-Ghill Suh (Pohang University of Science and Technology, South Korea). Secondary antibodies were as described (18, 19, 24). Proteins obtained from subcellular fractionation were resuspended in lysis buffer (150 mm NaCl, 1 mm EDTA, 0.1% SDS, 1% Nonidet P-40, 0.5% sodium deoxycholate, 50 mm Tris-HCl, pH 7.5, and protease inhibitors Complete Tablets; Roche Applied Science). Lysates were subjected to SDS-PAGE, blotted as described (19), and probed with anti-mGlu5 (1:1000), anti-lamin B2 (1:2000), monoclonal anti-Na+K+-ATPase (α-6F, 1:1000; Development Studies Hybridoma Bank, University of Iowa, Iowa City, IA), monoclonal anti-PLCβ1 (1:200, D-8:sc-5291; Santa Cruz Biotechnology, Inc., Santa Cruz, CA), and monoclonal anti-β-actin (1:5000; Sigma). Horseradish peroxidase-conjugated goat anti-rabbit IgG (1:2000; Cell Signaling Technology, Inc.) or anti-mouse IgG (1:2000; Sigma) was used in conjunction with enhanced chemiluminescence (Amersham Biosciences) to detect the signal. Densitometric analyses were performed using the Storm 860 Imager (GE Healthcare) together with the associated software.
[3H]Quisqualate Binding and Uptake—[3H]Quisqualate (specific activity = 26.0 Ci/mmol) was made by SRI International. Nuclear and plasma membrane fractions were used in binding assays as described (24). [3H]Quisqualate uptake was performed as described (19).
Fluorescent Measurements of Ca2+ in Intact Cells and Isolated Nuclei—For whole cell measurements, mGlu5 wild type or mutant expressing HEK cells were washed with serum-free medium, incubated with Oregon Green 488 BAPTA-1AM (Molecular Probes) and imaged as described (18). Similarly, primary cultured striatal neurons transiently transfected with DsRed2 or co-transfected with DNGαq/DsRed2, scrambled siRNA/DsRed2, or PLCβ1 siRNA/DsRed2 (10:1 ratio in all cotransfections) were prepared as described (19). To measure Ca2+ changes in individual nuclei, nuclei from HEK cells or rat P10 striatal tissues were prepared and processed as described (18, 19). Drugs at ×100 concentration were added to the side of the dish and allowed to diffuse at room temperature. Extra- and intracellular buffers used for Ca2+ measurements on intact cells or isolated nuclei were as described (19). Following image collection, cells/nuclei were fixed, stained with anti-mGlu5, lamin B2, and/or PLCβ1, and field relocated.
Single Cell and Nuclear Imaging of IP3—Dissociated striatal neurons were transiently transfected with pEGFP-C1-PLCδ1-PH (2 μg 35-mm dishes-1). After 24-48 h cells were washed with Neurobasal medium (Invitrogen) and used for monitoring IP3 generation in real time. Nuclei prepared from mGlu5/HEK cells transiently transfected with pEGFP-C1-PLCδ1-PH were imaged as described (18, 19). To monitor IP3 generation and Ca2+ changes simultaneously, nuclei were loaded with Calcium Crimson AM (Molecular Probes).
Confocal Microscopy and Data Analysis—All Ca2+ measurements and IP3 imaging were done using laser scanning confocal microscopes FluoView 500 and/or FluoView 1000 (Olympus, Center Valley, PA) as described previously (18, 19). Simultaneous IP3 and Ca2+ measurements were done using bandpass barrier filter settings at 483-536 nm for EGFP and 590-680 nm for Calcium Crimson (31). Analysis of changes in GFP fluorescence in striatal neurons or HEK nuclei, in real time, was performed as described (32). Increases in IP3 were detected by measuring the translocation of EGFP from the plasma membrane to the cytosol or from nuclear membrane to the nucleoplasm. Images were processed with MetaMorph (version 5.0.7) Professional Image Analysis software. Data are presented as ratio of change in fluorescent intensity at a given time to initial fluorescence and expressed as percentage (ΔF/Fo, %).
[3H]IP Measurements—IP was measured in cells expressing mGlu5 as described (33, 34). For measuring IP levels in nuclei, cells were treated as described (33, 34), nuclei were prepared and then resuspended in intracellular buffer (in mm: 125 KCl, 2 KH2PO4, 2 MgCl2, 0.3 CaCl2, 10 d-glucose, 1 ATP and 40 HEPES pH 7.0) before being processed further (34). Data calculated as the ratio of labeled IP or IP3 to total radioactivity (inositol, IP1, IP2, and IP3) were expressed as percentage of response in unstimulated HEK cells or nuclei expressing mGlu5.
RESULTS
mGlu5 Receptors Are Localized at Both the Plasma and Nuclear Membranes—We have previously shown that mGlu5 is expressed on plasma membranes as well as on many intracellular membranes including nuclear membranes (18, 19). To confirm and extend these studies, we expressed N-terminal hemagglutinin-tagged mGlu5 in HEK cells and used anti-hemagglutinin antibody and differential permeabilization techniques to verify the presence of mGlu5 on plasma and nuclear membranes (supplemental Fig. S1). In other studies immunogold EM with antibodies directed against the C-terminal portion of mGlu5 was used to show that immunogold particles were abundantly associated with endoplasmic reticulum and nuclear membranes (supplemental Fig. S1). Previously we showed that agonists such as glutamate and quisqualate reach nuclear receptors via both sodium-dependent transporters and cystine glutamate exchangers (19). Here, we confirm that quisqualate is taken up by HEK cells, that the mGlu5 agonist 3,5-dihydroxyphenylglycine is an impermeable agonist, and that the drugs LY395053 and LY367366 are impermeable antagonists (35) (supplemental Fig. S2). Thus, as an impermeable agonist, 3,5-dihydroxyphenylglycine cannot activate nuclear mGlu5 receptors in isolated nuclei derived from mGlu5 expressing HEK cells (mGlu5/HEK) or endogenously expressed on striatal nuclear membranes, whereas quisqualate can (supplemental Fig. S3, E-H). Finally, using differential labeling with vital dyes such as MitoTracker, which is excluded from the nucleus and Hoechst, which is retained in the nuclear compartment, we provide visible evidence of the purity of these nuclear preparations (supplemental Fig. S3, A-D). Therefore mGlu5 receptors are present and functional on nuclear membranes in heterologous cells as well as endogenous striatal nuclei.
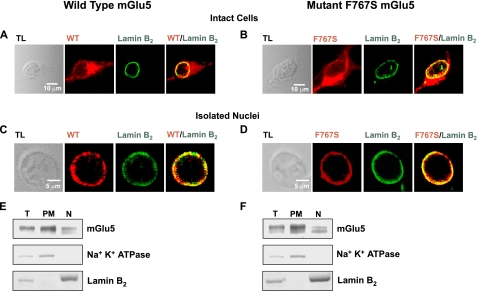
Nuclear mGlu5 Couples to Nuclear Gq/11 Proteins—Certain nuclear GPCRs appear to mediate nucleoplasmic Ca2+ changes via pertussis toxin-sensitive pathways suggesting a Gi/o-driven mechanism (21). However, we have previously shown that in HEK293 cells stably expressing mGlu5, pertussis toxin does not affect mGlu5-mediated cytoplasmic or nuclear Ca2+ oscillations (18), thus we hypothesized that nuclear mGlu5 couples to nuclear Gq/11 proteins to activate downstream signaling components. To test this idea, an mGlu5 mutant was constructed in which phenylalanine at position 767 in the third intracellular loop was replaced with serine (F767S), leading to the loss of G-protein coupling (36, 37). Like wild type mGlu5, the F767S mutant was localized on both plasma and nuclear membranes where it co-localized with the nuclear membrane marker, lamin B2 (Fig. 1, A and B). Similarly, nuclei isolated from mGlu5 or F767S stable HEK cell lines co-expressed either receptor together with lamin B2 confirming expression on nuclear membranes (Fig. 1, C and D). Using subcellular fractionation, both wild type and mutant receptors were clearly expressed on the plasma membrane as well as nuclear fractions as indicated by the membrane-specific markers, Na+K+-ATPase and lamin B2, respectively (Fig. 1, E and F). Thus immunocytochemical analysis and Western blotting techniques demonstrated that the expression pattern and protein levels of wild type and mutant mGlu5 in HEK cells were similar.
FIGURE 1.
mGlu5 wild type and F767S mutant exhibit nuclear localization. Stable HEK cell lines expressing either wild type mGlu5 or the F767S mutant, were fixed, permeabilized, and processed for immunocytochemistry using receptor-specific antibodies as well as anti-lamin B2. Cells were analyzed by confocal microscopy to detect receptor localization (red) or lamin B2 distribution (green). Photographs represent single optical sections of 0.4 μm merged such that yellow indicates co-localization of the specific antigens. Receptors expressed by intact cells (A and B; TL, transmitted light) or their isolated nuclei (C and D) exhibited pronounced co-localization with lamin B2. Subcellular fractionation of HEK cell lines expressing either wild type mGlu5 (E) or the F767S mutant (F) shows that wild type or mutant receptors can be detected in fractions containing either the nuclear (N) or plasma membranes (PM). Equal amounts of protein (30 μg) from each fraction were separated on reducing SDS gels and transferred to nylon membranes (T, total cell lysates). The same blot was sequentially probed with antibodies against mGlu5, the inner nuclear marker, lamin B2, and the plasma membrane marker, Na+K+-ATPase.
To determine whether the F767S mutant exhibited similar binding characteristics to wild type receptors, binding studies using [3H]quisqualate as a radioligand were performed on both nuclear and plasma membrane fractions. Dissociation constants (Kd) for wild type and mutant mGlu5 plasma membrane receptors were 385.4 ± 54.6 and 492.8 ± 36.1 nm, respectively. The Kd values for wild type and mutant mGlu5 nuclear receptors were 576.6 ± 15.9 and 752.7 ± 43.5 nm, respectively. The total number of mGlu5 binding sites (Bmax) as revealed from non-linear regression analysis was 896.9 ± 49.4 fmol/mg for wild type mGlu5 plasma membrane receptors, 1285.5 ± 128.9 fmol/mg for mutant mGlu5 plasma membrane receptors, 638.7 ± 54.9 fmol/mg for wild type nuclear receptors, and 1060.7 ± 133.2 fmol/mg for mutant mGlu5 nuclear receptors. HEK cells expressing empty vector did not exhibit significant specific binding to [3H]quisqualate (Kd > 2.0 mm). Thus, like wild type nuclear mGlu5 receptors (18), F767S binds agonist and appears to be correctly folded in HEK cells. Data pooled across four experiments indicates that about 51.7 ± 3.5% of mGlu5 receptors are on plasma and intracellular membranes and that 48.3 ± 3.5% of mGlu5 receptors are present on nuclear membranes derived from mGlu5/HEK cells.
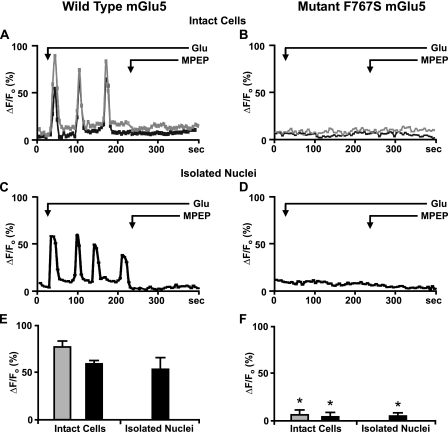
To test whether F767S could mediate Ca2+ changes, HEK cells stably expressing wild type or mutant mGlu5 were loaded with the Ca2+ indicator Oregon Green BAPTA-1AM. Esterified Oregon Green BAPTA-1AM is hydrolyzed within the nucleus such that it is retained for at least 30 min (38, 39). As shown previously (18), bath application of glutamate-induced Ca2+ oscillations in both the cytoplasm and nucleoplasm of wild type cells that were inhibited by the membrane-permeable mGlu5-specific antagonist MPEP (Fig. 2A). In contrast, no such oscillations were observed in cells expressing F767S (Fig. 2B). More directly, agonist induced Ca2+ oscillations in nuclei derived from wild type cells, whereas no such induction was observed in nuclei isolated from F767S cells (Fig. 2, C versus D). The quantitation of data from three to five independent experiments is shown in Fig. 2, E and F. Thus although the F767S mutant bound ligand and was expressed on the same membranes as the wild type receptor, it was completely inactive in either intact cells or isolated nuclei. Given that the F767S mutation prevents G-protein coupling, and that pertussis toxin was ineffective in blocking mGlu5-mediated nuclear Ca2+ oscillations (18) as well as that HEK293 cells do not express Go (36), these data demonstrate that mGlu5-induced Ca2+ oscillations in the nucleus are a consequence of functional nuclear Gq/11 coupling.
FIGURE 2.
Nuclear mGlu5 couples to nuclear Gq/11 protein. Representative traces are shown of cytoplasmic (gray line) or nuclear (black line) Ca2+ responses from wild type mGlu5 expressing HEK cells (A) or the F767S cell line (B) as well as their respective nuclei (C and D) following bath addition of 10 μm glutamate (Glu) and 1 μm MPEP when indicated and scanned at 5.4 s/scan. Oscillations are represented as the fractional change in fluorescence relative to the basal value. Compiled data from the maximum response of initial peak (ΔF/Fo, %) from either wild type cells or nuclei (E) or F767S cells or nuclei (F) from n > 30 cells, from three to five independent experiments. *, p < 10-4 when compared with Ca2+ responses from wild type mGlu5/HEK cells and nuclei treated with glutamate only.
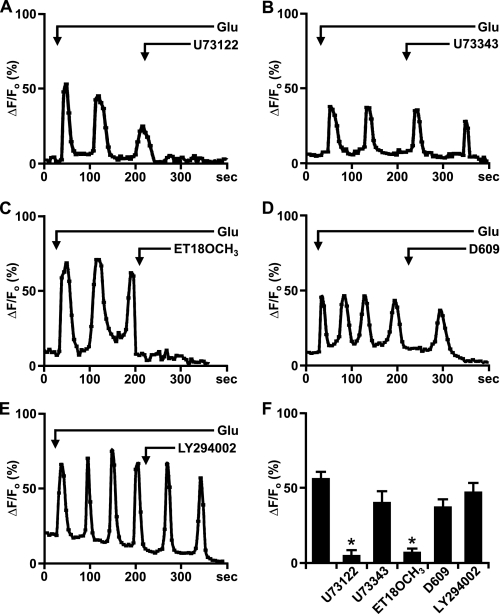
Nuclear mGlu5 Stimulates Nuclear PI-PLC—On the plasma membrane, activation of Gq/11-coupled receptors leads to PLC activation and PIP2 hydrolysis. Because both the substrate PIP2 (40) as well as PLC (β1 isoform) (41) are known to be in the nucleus (13), we tested whether nuclear mGlu5 mediates nuclear Ca2+ changes due to PLC stimulation. Using the same experimental paradigm, mGlu5-expressing nuclei were treated with glutamate to induce real time nuclear Ca2+ oscillations prior to bath application of the PLC inhibitor U73122 (3 μm) or its inactive analog U73343 (3 μm). This concentration was chosen because others have shown that 3 μm U73122 specifically inhibits PLC activity without affecting intracellular Ca2+ levels (27, 42). As shown in Fig. 3, A and F, the active analog U73122 inhibited glutamate-induced Ca2+ oscillations, whereas the inactive analog, U73343, did not (Fig. 3, B and F). Moreover, pre-treatment with U73122 (3 μm for 120 s) prevented glutamate-induced Ca2+ oscillations in mGlu5-expressing HEK nuclei, whereas pre-treatment with either U73343 or the drug vehicle, 0.1% DMSO, did not prevent Ca2+ oscillations (n > 10; data not shown).
FIGURE 3.
Nuclear mGlu5 stimulates nuclear PI-PLC. A-E, representative traces of nuclear (black line) Ca2+ responses in isolated mGlu5-expressing HEK nuclei represented as the fractional change in fluorescence relative to the basal level. Isolated nuclei were treated with 10 μm glutamate and the specified antagonists bath applied when indicated by the arrow; U73122 (PLC inhibitor, 3 μm), U73343 (inactive analog of U73122, 3 μm), ET-18-OCH3 (selective PI-PLC inhibitor, 10 μm), D609 (selective PC-PLC inhibitor, 100 μm), and LY294002 (PI3K inhibitor, 100 nm). F, compiled data from maximum response of initial peak (ΔF/Fo, %) induced by glutamate alone or together with specified antagonists from n > 15 in all cases, from three independent experiments. *, p < 0.001 when compared with Ca2+ responses from nuclei treated with glutamate only.
Given that U73122 inhibits all types of PLCs, we further tested whether PI-PLC or phosphatidylcholine-PLC (PC-PLC) was involved. To do so, mGlu5-responding nuclei were treated either with the PI-PLC inhibitor ET-18-OCH3 or the PC-PLC selective inhibitor D609 (42). Only the PI-PLC inhibitor blocked mGlu5-mediated nuclear Ca2+ oscillations (Fig. 3, C, D, and F). Finally, because studies have shown that IGF-1 induces nuclear Ca2+ transients through Gi/o subunits and PLC as well as via PI3K (12), we tested whether the PI3K inhibitor LY294002 could block agonist-induced Ca2+ responses. Bath application of LY294002 had no effect on mGlu5-mediated nuclear responses (Fig. 3, E and F). Taken together, these data reveal that like plasma membrane receptors, nuclear mGlu5 receptors also couple to Gq/11 and PLC. Inasmuch as all of the experiments were done in acutely isolated nuclei, it is clear that all of the necessary enzymatic machinery is available for these responses independent of cellular components.
Nuclear mGlu5 Generates Nuclear IP3—Due to the transient and readily metabolizable nature of IP3, it can be difficult to accurately measure in the cytosol let alone the nucleoplasm. Indeed, only one study has reported IP3 changes in isolated nuclei (33). Moreover, mGlu5 is known to exhibit high constitutive activity in heterologous cell types (43). Not surprisingly then, biochemical assays to measure agonist-induced changes in inositol phosphates (IP) or more specifically, IP3, revealed small yet significant increases in IP and IP3 levels as compared with untreated controls. Specifically, 41 and 21% increases in IP levels were observed in glutamate-treated mGlu5/HEK cells and nuclei, respectively (cytoplasmic IP levels were normalized at 100.0 ± 0.1% without glutamate and 141.2* ± 5.3% in the presence of 10 μm glutamate. Nuclear IP levels were 100.0 ± 0.3%, in the absence of glutamate and 120.8* ± 5.2% in its presence; n = 3, *, p < 0.05). Separate experiments examining IP3 changes revealed an ∼25% increase in glutamate-treated mGlu5/HEK cells and about a 15% increase in isolated mGlu5/HEK nuclei (cytoplasmic IP3 levels were normalized at 100.0 ± 2.5% in the absence of glutamate, whereas glutamate-treated cytoplasmic IP3 levels were 125.0* ± 5.2%. IP3 levels in isolated nuclei were 100.0 ± 1.3% in untreated controls and 115.3* ± 3.2% for glutamate-treated; n = 3, *, p < 0.05). Consistent with the notion that mGlu5 is constitutively active, the inverse agonist, MPEP, which locks the receptor into its inactive state (44), reduced basal IP levels by ∼5-fold in the absence (19.2 ± 0.7%) or presence of glutamate (23.5 ± 7.6%). Moreover, IP levels were about 17% in F767S/HEK cells regardless of treatment.
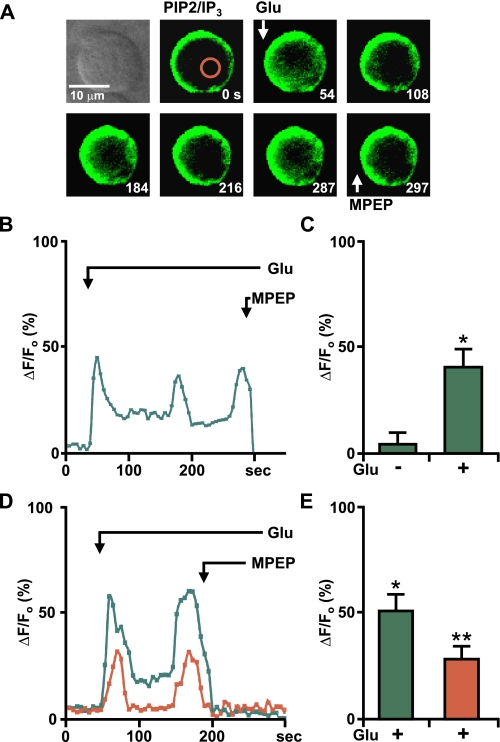
To circumvent the limitations of the biochemical assay, we used a well established construct “pEGFP-C1-PLCδ1-PH” in which the pleckstrin homology (PH) domain of PLCδ1 with its high affinity for the polar group of PIP2 has been tagged with GFP (26, 45). This probe is bound to PIP2 in the plasma membrane and the increase in IP3 is indicated by the translocation of the fusion protein from the plasma membrane to the cytoplasm. Because this probe not only depends upon IP3 but also on the PIP2 concentration in the plasma membrane, it is perhaps more aptly referred to as a PIP2/IP3 biosensor (46). Therefore, mGlu5/HEK cells were transiently transfected with the PIP2/IP3 biosensor, nuclei were isolated, and GFP-expressing nuclei were imaged in real time (Fig. 4). Under basal conditions the PIP2/IP3 biosensor is located at the inner nuclear membrane due to its affinity for PIP2 (Fig. 4A, second panel). Upon glutamate treatment and PLC activation, the biosensor moved off the membrane into the nucleoplasm because of its 20-fold higher affinity for IP3 (Fig. 4A, remaining panels) (45). Glutamate-induced biosensor responses were oscillatory and completely blocked by MPEP (Fig. 4, A and B). Isolated HEK nuclei expressing the PIP2/IP3 biosensor or F767S mutant HEK nuclei co-expressing the biosensor never showed this response (data not shown). When analyzed by expressing the peak increases in nucleoplasmic GFP as compared with basal fluorescence, significant changes in F/Fo were observed (Fig. 4C).
FIGURE 4.
Nuclear mGlu5-generated IP3 production can be measured using PIP2/IP3 biosensor. A, first panel, transmitted light image of selected nucleus; remaining panels, time lapse imaging of the mGlu5/HEK nucleus transiently transfected with the PIP2/IP3 biosensor treated at the indicated times (seconds) with 10 μm glutamate or 1 μm MPEP. Red circle corresponds to area measured for representative trace shown in B, where Glu-mediated oscillations are represented as the fractional change in fluorescence relative to the basal IP3 levels. C, compiled data from maximum response of the initial peak (ΔF/Fo, %) for nuclear responses from n = 5, from three experiments. *, p < 0.001 when compared with baseline IP3 responses. D, nuclei isolated from a mGlu5/HEK stable cell line transiently transfected with the PIP2/IP3 biosensor were loaded with Calcium Crimson-AM to simultaneously measure Ca2+ and biosensor changes. Shown is a representative trace of nuclear Ca2+ (red line) and PIP2/IP3 biosensor (green line) responses in an isolated nucleus treated with 10 μm glutamate and 1 μm MPEP as indicated by the arrow. E, compiled data from the maximum response of initial peak (ΔF/Fo, %) for nuclear IP3 (green) and Ca2+ (red) responses from n = 5, from three independent experiments. *, p < 0.001 when compared with baseline IP3 response; **, p < 0.01 when compared with the baseline Ca2+ response.
To demonstrate more clearly that nuclear mGlu5-induced IP3 leads to Ca2+ changes in the nucleus, we loaded mGlu5/HEK nuclei expressing the PIP2/IP3 biosensor with the Ca2+ fluorophore, Calcium Crimson-AM. Bath application of glutamate leads to marked biosensor movement, which was concomitant with the rise in Ca2+ in mGlu5/HEK nuclei (Fig. 4, D and E). Collectively, these data demonstrate that activated nuclear mGlu5 receptors generate nuclear IP3.
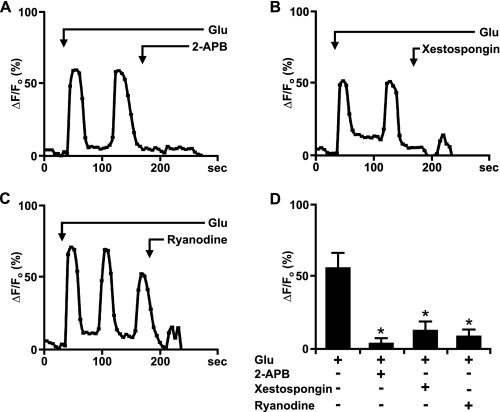
Nuclear mGlu5-mediated Ca2+ Changes Originate from IP3R and RyR—Numerous studies have shown that upon activation IP3R and RyR located on the inner nuclear membrane can release Ca2+ from the nuclear lumen into the nucleoplasm (7, 9). Therefore, we used specific IP3R and RyR inhibitors to test the hypothesis that nuclear mGlu5 receptors coupled to Gq/11 and PLC activate inner nuclear membrane Ca2+ channels to mediate Ca2+ changes. Glutamate-induced Ca2+ oscillations in isolated mGlu5/HEK nuclei were blocked by both the IP3R inhibitor, 2-APB (100 μm), and the RyR antagonist, ryanodine (100 μm) (Fig. 5). Pre-treating with either drug prevented the induction of mGlu5 responses in nuclei isolated from the mGlu5/HEK cell line (not shown). Another IP3R antagonist, the highly specific xestospongin C (2 μm) (47, 48) also inhibited glutamate-induced Ca2+ oscillations in isolated mGlu5/HEK nuclei by ∼75% (Fig. 5, B and D). Thus, mGlu5-mediated Ca2+ responses arise via IP3R and RyR channels.
FIGURE 5.
Glutamate-activated nuclear mGlu5-mediated Ca2+ changes can be abrogated by IP3R and RyR blockers. A-C, representative traces of nuclear (black line) Ca2+ responses in isolated mGlu5-expressing nuclei represented as the fractional change in fluorescence relative to the basal level. Isolated nuclei were treated with 10 μm glutamate and the indicated antagonists; 2-APB (IP3R modulator, 100 μm), xestospongin C (IP3R antagonist, 2 μm), and ryanodine (RyR antagonist, 100 μm). D, compiled data from the maximum response of the initial peak (ΔF/Fo, %) for nuclear responses from n > 20 for 2-APB and ryanodine and n = 14 for xestospongin C, from three independent experiments. *, p < 0.001 when compared with Ca2+ responses from nuclei treated with glutamate only.
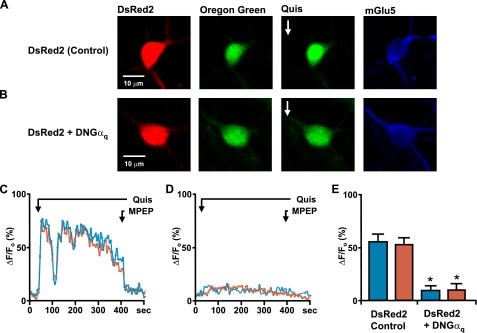
Striatal Nuclear mGlu5 Also Uses the Gq/11/PI-PLC/IP3 Pathway to Mediate Nuclear Ca2+ Changes—To extend these findings to a more physiological system, we examined nuclear mGlu5 signal transduction pathways in dissociated striatal neurons or in nuclei acutely isolated from striatal tissue that we have previously shown to express functional nuclear mGlu5 receptors (19). The role of Gq/11 in mediating mGlu5 responses was determined by transfecting striatal neurons with dominant-negative Gαq (DNGαq) together with DsRed2 or with DsRed2 only. Two days later neurons were loaded with Oregon Green BAPTA-1AM, imaged to acquire base-line Ca2+ changes and then treated with 10 μm quisqualate. As quisqualate also activates α-amino-3-hydroxy-5-methyl-4-isoxazolepropionic acid channels and mGlu1 receptors, it was bath applied in the presence of 5 μm GYKI53655, an α-amino-3-hydroxy-5-methyl-4-isoxazolepropionic acid antagonist, and 20 μm CPCCOEt, an mGlu1 antagonist. Consistent with previous results (19), neurons transfected with DsRed2 alone showed Ca2+ increases in both the cytoplasm as well as nucleus consisting of two phases, an initial rapid rise followed by a sustained plateau. Both responses could be terminated by addition of MPEP (Fig. 6, A and C). In contrast, neurons co-transfected with DNGαq and DsRed2 failed to show similar changes in cytoplasmic or nuclear Ca2+ levels (Fig. 6, B and D). Specifically, there was approximately an 80% reduction in the nuclear Ca2+ levels in cells co-transfected with DsRed2 and DNGαq as compared with DsRed2 only following quisqualate treatment (Fig. 6E). Cell surface mGlu5 receptors served as an internal positive control of DNGαq efficacy; hence cytoplasmic Ca2+ levels were also reduced by 80-85% in cells co-transfected with DsRed2 and DNGαq versus DsRed2-only following quisqualate treatment (Fig. 6). For further support of a predominant role of Gq/11 in mGlu5-mediated nuclear Ca2+ increases, striatal cultures were pretreated with pertussis toxin for 18 h. Like mGlu5/HEK cells, pertussis toxin did not affect striatal mGlu5-mediated cytoplasmic or nuclear Ca2+ responses ruling out a Gi/o-mediated response (n > 15; data not shown).
FIGURE 6.
Endogenous mGlu5 receptors expressed on striatal neurons couple to the Gq family of G-proteins. On the 12th day in vitro, striatal neurons transiently transfected with DsRed2 (A) or co-transfected with dominant negative Gαq and DsRed2 (B) were loaded with Oregon Green BAPTA-1AM (second panels) and quisqualate (Quis;10 μm) was bath applied (third panels). Remaining panels, images of post hoc identified mGlu5-positive cells. Representative traces are shown of quisqualate-mediated cytoplasmic (blue line) or nuclear (red line) Ca2+ responses from a control neuron (DsRed2 transfected; C) or a neuron co-transfected with dominant negative Gαq and DsRed2 (D). MPEP was added as indicated (1 μm; black line). E, compiled data from the maximum response of initial peak (ΔF/Fo, %) from either control cells (n = 22) or dominant negative Gαq-transfected neurons (n = 20) from four independent experiments. *, p < 0.0001 when compared with Ca2+ responses from DsRed2-transfected control cells.
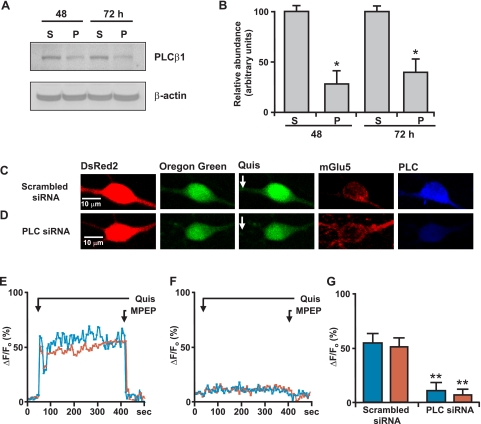
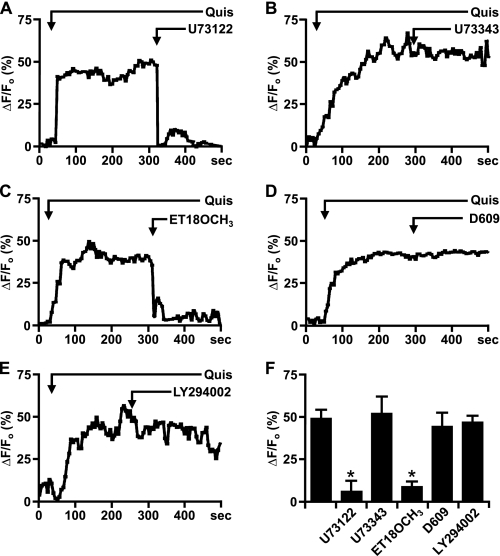
To determine whether PLCβ was involved in nuclear mGlu5-mediated Ca2+ responses, siRNA targeted against PLCβ1, the most prevalent nuclear isoform (41), was used to knockdown expression. Western blotting of striatal lysates prepared 48 and 72 h after siRNA transfection showed that there was at least a 60-70% knockdown of PLCβ1 using the targeted siRNA versus a scrambled control (Fig. 7, A and B). Immunostaining of transfected cultures further revealed a knockdown of PLCβ1 following the introduction of PLCβ1-specific siRNA versus the scrambled control (Fig. 7, C and D, last panels). Scrambled siRNA together with DsRed2 had no effect on agonist-induced mGlu5 Ca2+ responses (Fig. 7, C, E, and G), whereas neurons co-transfected with PLCβ1 siRNA exhibited a 78% reduction in cytoplasmic and an 83% reduction in nuclear Ca2+ following quisqualate treatment (Fig. 7, D, F, and G). Pharmacological support of these data comes from acutely isolated striatal nuclei experiments in which nuclei were loaded with the Ca2+ fluorophore followed by quisqualate to induce a sustained nuclear Ca2+ response. This response could be blocked by MPEP (19) (data not shown), U73122 (Fig. 8, A and F), or ET-18-OCH3 (Fig. 8, C and F) but not U73343 (Fig. 8, B and F), D609 (Fig. 8, D and F), or LY294002 (Fig. 8, E and F). Thus, PI-PLC but not PC-PLC or PI3K are required for nuclear Ca2+ signaling following quisqualate activation of mGlu5 nuclear receptors.
FIGURE 7.
Knockdown of PLCβ1 leads to reduction in striatal mGlu5-mediated Ca2+ changes. A, primary striatal neurons were transiently transfected with either scrambled siRNA (S) or PLCβ1 siRNA (P). At the times indicated, cells were lysed and proteins were separated on reducing SDS gels and transferred to nylon membranes. The same blot was sequentially probed with antibodies against PLCβ1 (Santa Cruz) and β-actin. B, the relative abundance of PLCβ1 was measured by Western blotting; the efficiency of knockdown is expressed in arbitrary units compared with the PLCβ1 levels in scrambled siRNA-transfected neurons. The data shown are compiled from three independent experiments. *, p < 0.005 when compared with PLCβ1 protein levels in scrambled siRNA-transfected cells. On the 12th day in vitro, striatal neurons were transiently co-transfected with scrambled siRNA and DsRed2 (C) or with PLCβ1 siRNA and DsRed2 (D). Two days later, neurons were loaded with Oregon Green BAPTA-1AM (second panels) and quisqualate (Quis;10 μm) was bath applied (third panels). Representative traces are shown for cytoplasmic (blue line) or nuclear (red line) Ca2+ responses from scrambled (E) or PLCβ1 siRNA (F) following quisqualate and subsequently, 1 μm MPEP administration (black line). Imaged neurons were post hoc identified using mGlu5 (fourth panels) or PLCβ1 antibodies (last panels). G, compiled data from the maximum response of initial peak (ΔF/Fo, %) from either scrambled (n = 13) or PLCβ1 (n = 17) siRNA-transfected neurons from three independent experiments. **, p < 0.0001 when compared with Ca2+ responses from control siRNA and DsRed2-transfected cells.
FIGURE 8.
Endogenous mGlu5 receptors expressed on striatal nuclei mediate Ca2+ changes via the PI-PLC pathway. P10 striatal nuclei were acutely isolated, loaded with Oregon Green BAPTA-1AM, and imaged in real time. A-E, quisqualate-mediated (10 μm) representative traces of nuclear (black line) Ca2+ responses treated with the indicated antagonists bath applied as noted. F, compiled data from the maximum response of initial peak (ΔF/Fo, %) for nuclear Ca2+ responses induced by quisqualate alone or together with specified antagonists from n > 8 in all cases, from three to four independent experiments. *, p < 0.001 when compared with Ca2+ responses from nuclei treated only with quisqualate (Quis).
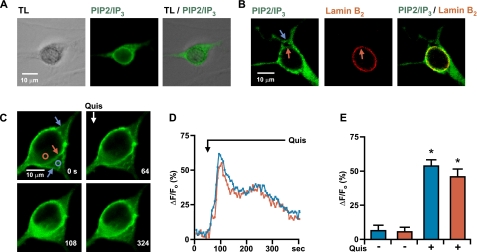
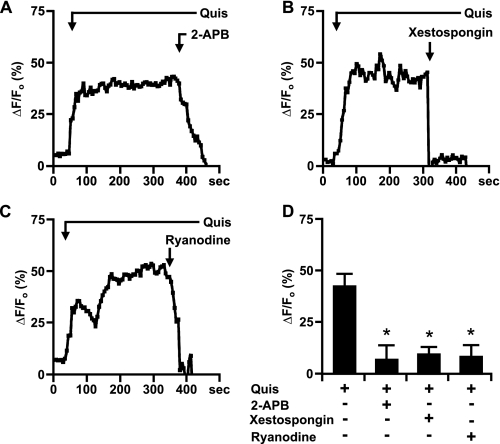
To test whether mGlu5-induced striatal nuclear Ca2+ changes were mediated via IP3 generation, neurons were transfected with the PIP2/IP3 biosensor. Images taken from a single optical plane revealed that GFP fluorescence was associated with both cell surface (Fig. 9, blue arrows) and nuclear membranes (Fig. 9, red arrows) when compared with the corresponding transmitted light images (Fig. 9A) or with the lamin B2 staining (Fig. 9B). These results are consistent with the HEK data (Fig. 4) and with reports that PLCδ1 accumulates in nuclear compartments (49, 50). Upon quisqualate stimulation, the PIP2/IP3 biosensor moved away from either membrane exhibiting a sustained fluorescent increase akin to observed Ca2+ changes (Fig. 9, C and D). Peak increases in cytoplasmic or nucleoplasmic fluorescence expressed as a percent of basal fluorescence showed similar responses (Fig. 9E). To ensure that these were mGlu5-mediated responses, cultures were fixed, stained with an anti-mGlu5 antibody, and subsequently field-relocated (not shown). Moreover, quisqualate-mediated Ca2+ responses could be blocked by 2-APB, xestospongin C, or ryanodine (Fig. 10). Taken together, these data demonstrate that endogenous striatal mGlu5 receptors activate essentially the same Gq/11/PI-PLC/IP3 pathway in the nucleus as they do on striatal plasma membranes (Fig. 11).
FIGURE 9.
Activation of striatal mGlu5 receptors generates nuclear IP3. On the 12th day in vitro, striatal cultures were transiently transfected with the PIP2/IP3 biosensor. A, single optical sections of 0.25 μm showing transmitted light image (TL, first panel), biosensor fluorescence (PIP2/IP3, second panel), and the merged image (third panel). B, single optical section of 0.25 μm showing biosensor fluorescence alone (green; first panel), lamin B2 immunofluorescence (red; second panel), and the merged image (third panel) on nuclear (red arrow) and plasma membranes (blue arrow). C, first panel, single optical section of 0.25 μm showing biosensor distribution on nuclear (red arrow) and plasma membranes (blue arrows); remaining panels, translocation of biosensor following 10 μm quisqualate (Quis) application as indicated. Circles correspond to areas measured for representative traces shown in D (cytoplasmic blue or nuclear red) where biosensor changes are represented as the fractional change in fluorescence relative to the basal levels of fluorescence. E, compiled data from the maximum response of initial peak (ΔF/Fo, %) for cytoplasmic (blue) or nuclear (red) responses from n = 5, from three separate experiments. *, p < 0.01 when compared with baseline responses.
FIGURE 10.
Striatal mGlu5 receptors release nuclear Ca2+ via Ca2+ release channels. A-C, representative traces of nuclear (black line) Ca2+ responses in isolated striatal nuclei represented as the fractional change in fluorescence relative to the basal level. Isolated nuclei were treated with 10 μm quisqualate (Quis) and the indicated antagonists. D, bar graph shows compiled data from the maximum response of initial peak (ΔF/Fo, %) for nuclear responses from n > 10 for either antagonist, from three independent experiments. After treatment with antagonists the Ca2+ responses were significantly different when compared with Ca2+ responses in the presence of quisqualate (Quis) only (*, p < 0.001).
FIGURE 11.
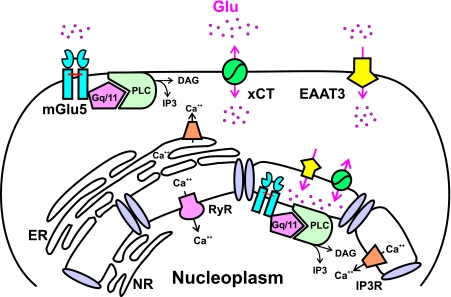
Proposed model of the signal transduction pathway associated with nuclear mGlu5 receptors. Endogenous striatal nuclear mGlu5 receptors, like plasma membrane receptors, couple to the Gq/11/PIPLC/IP3 pathway. EAAT, sodium-dependent transporter; xCT, cystine-glutamate transporter; DAG, diacylglycerol; ER, endoplasmic reticulum; NR, nucleoplasmic reticulum.
DISCUSSION
Given the many components of G-protein signaling described in the nucleus (13, 51-54), the presence of both IP3R and RyR on the inner nuclear membrane (3, 4), as well as the recent demonstrations of functional GPCRs on nuclear membranes such as mGlu5 (18, 19) and mGlu1 (22), we hypothesized that canonical plasma membrane-based signaling components serve similar functions at nuclear membranes. Using optical, pharmacological, and genetic techniques, the present findings confirm this hypothesis showing that nuclear mGlu5 couples to Gq/11 to activate nuclear PI-PLC, hydrolysis of PIP2, and generation of nuclear IP3. The latter leads to the release of Ca2+ from the nuclear envelope in heterologous cell types as well as in striatal neurons. Taken together, these data suggest that signals generated at the inner nuclear membrane might amplify second messengers arriving via the nuclear pore complex and/or independently regulate nuclear function.
The basic signaling components ascribed to nuclear mGlu5 receptors are supported by a number of observations. First, mutations that block mGlu5 coupling to Gq/11 prevented cytoplasmic and nuclear Ca2+ changes in heterologous cells and their isolated nuclei despite normal agonist binding (Fig. 2). Second, when expressed in striatal neurons, dominant negative Gαq abolished mGlu5-mediated nuclear Ca2+ increases (Fig. 6). Third, low concentrations of the widely used PLC inhibitor, U73122, blocked mGlu5-mediated increases of nuclear Ca2+ in both mGlu5/HEK and striatal nuclei (Figs. 3 and 8). Moreover, knockdown of PLCβ1 in striatal neurons significantly reduced mGlu5-mediated nuclear Ca2+ responses as well (Fig. 7). Finally, in situ IP3 production was revealed following mGlu5 activation in both heterologous and striatal nuclei using a sensitive optical PIP2/IP3 biosensor approach (Figs. 4 and 9). Taken together, these data strongly support a model in which nuclear mGlu5 receptors lead to the activation of Gαq/11, PLC, and IP3 to generate changes in nuclear Ca2+ levels.
The traditional idea that GPCRs signal only from the cell surface is gradually being refined by studies showing that even internalized receptors can serve as scaffolds for signaling molecules (55) or, more directly, intracellular receptors can couple to various intracellular G proteins. Thus if mechanisms exist by which a receptor might be activated, signaling molecules are available to transmit the signal. Receptor activation might be accomplished in a variety of ways. For example, a large number of GPCRs such as the prostaglandin, platelet-activating factor, and LPA receptors, whose ligands are bioactive lipids derived from membrane hydrolysis, are located on nuclear membranes (for review, see Ref. 21). As ligand-generating enzymes are also present on nuclear membranes and because such ligands readily diffuse through lipid bilayers, PGE2, platelet-activating factor, and LPA can easily activate their cognate receptors. In contrast, mGlu5 or mGlu1 ligand-binding domains are within the nuclear lumen such that agonists must traverse both the cell surface lipid bilayer as well as the outer nuclear membrane for receptor activation (18, 19, 22). Mechanistically agonist transport is achieved via the sodium-dependent glutamate transporter and/or the cystine, glutamate xCT exchanger (19, 22). Although other mechanisms might also lead to intracellular mGlu5 or mGlu1 receptor activation, direct transfer of ligand is at least one effective means of delivering agonist to such receptors.
There appear to be many different mechanisms involved in mobilizing Ca2+ from storage in the nuclear envelope. Many of the described nuclear GPCRs couple to several different G proteins including Gq/11 and Gi/o. To date, Gi/o-mediated signaling pathways seem to predominate regardless of whether a particular GPCR couples to Gq/11 at the plasma membrane. For instance, although PGE2 EP1 receptors couple to Gq/11 at the cell surface, nuclear EP1 receptors generate nucleoplasmic Ca2+ signals in a pertussis toxin-sensitive fashion (56, 57). Similarly, although the LPA-1 receptor is known to interact with Gi/o, Gq/11, and G12/13 proteins at the cell surface, it is also Gi/o-coupled on nuclear membranes (20). IGF-1 stimulation is also known to mobilize Ca2+ from nuclear stores. Results suggest that extracellular IGF-1 activates IGF-1R, which in turn activates a pertussis toxin-sensitive G protein. The latter stimulates PI3K and subsequently PLC to generate cytoplasmic/perinuclear IP3, which diffuses into the nuclear lumen (11, 12). The possibility that cytoplasmic IP3 diffuses into the nucleus via nuclear pore complexes can be ruled out here because the present experiments utilize pure isolated nuclei. Thus, for nuclear mGlu5 receptors, signal transduction appears to be via the same canonical Gq/11/PLC/IP3 pathway that is also found at the plasma membrane (58).
Interestingly, both Ca2+ channels, IP3R and RyR, contribute to the mGlu5-mediated nuclear Ca2+ rises because adding their respective antagonists blocked the Ca2+ changes. Although activation of IP3Rs is consistent with numerous studies showing that mGlu5 generates IP3, participation of RyR channels in the same process is intriguing. One possibility is that IP3-mediated Ca2+ release leads to the activation of the RyR. In contrast, ryanodine may directly inhibit IP3-mediated Ca2+ signals (59). Which of these models, direct or indirect inhibition of IP3-evoked Ca2+ release, holds true for mGlu5-mediated Ca2+ changes remains to be tested. Finally, because IP3Rs are present on the inner nuclear membrane, the translocation of IP3 from its site of synthesis into the nucleoplasm as inferred from the PIP2/IP3 biosensor experiments, is puzzling (Fig. 4A). Conceivably, IP3 generated at the nuclear membrane might translocate to the nucleoplasmic reticulum that also expresses IP3Rs to further release nuclear Ca2+ in specialized subdomains (6, 60). In support of this idea, translocation of the biosensor was never uniform in neuronal nuclei; biosensor movement was skewed toward one side of the nucleus or another (Fig. 9C). Thus, spatial constraints, diffusion characteristics, and/or intranuclear buffering capabilities may regulate specific local Ca2+ signals in nuclear subdomains.
It is widely believed that the amplitude, duration, and/or frequency of Ca2+ fluctuations can differentially regulate downstream effectors such as transcriptional regulators, coactivators, and/or modifying enzymes (61-63). In the nucleus differential regulation of Ca2+ is crucial because blocking increased nuclear Ca2+ prevents Ca2+-induced developmental processes and/or long term plasticity (62, 64-66). For example, using an in vivo genetic approach, Limback-Stokin et al. (67) demonstrated that nuclear Ca2+ signaling pathways, not cytoplasmic, were responsible for converting short term memory into long term memory. Clearly, one consequence of nuclear mGlu5 activation is prolonged nuclear Ca2+ responses (see Ref. 19 and studies herein). Presumably, sustained mobilization of nuclear Ca2+ activates different signaling pathways including nuclear Ca2+/calmodulin-activated kinase IV, a kinase known to phosphorylate the cAMP response element-binding protein (CREB) (68). Indeed, we have previously shown that agonist treatment can directly activate CREB in mGlu5-expressing isolated striatal nuclei (19). CREB may, in turn, lead to de novo gene transcription. Although these notions remain to be tested, activation of nuclear receptors creates yet one more way in which a cell can nuance its responses to a given stimuli.
Supplementary Material
Acknowledgments
We thank Steve Harmon, Ismail Sergin, Keith Ferguson, and Dennis Oakley for technical assistance. We also thank Dr. T. Meyer, Stanford University, Stanford, CA, for the PIP2/IP3 biosensor clone, Dr. P. G. Suh, Pohang University of Science and Technology, South Korea, for the monoclonal anti-PLCβ1 antibody (K92), and Drs. A. Burkhalter and Y. Gonchar for electron microscopy.
This work was supported, in whole or in part, by National Institutes of Health Grants MH57817 and MH69646 (to K. O. M.) and National Institutes of Health Neuroscience Blueprint Core Grant NS057105 to Washington University. This work was also supported by the Bakewell Family Foundation. The costs of publication of this article were defrayed in part by the payment of page charges. This article must therefore be hereby marked “advertisement” in accordance with 18 U.S.C. Section 1734 solely to indicate this fact.
The on-line version of this article (available at http://www.jbc.org) contains supplemental Figs. S1-S3.
Footnotes
The abbreviations used are: IP3Rs, inositol 1,4,5-trisphosphate receptors; GPCRs, G protein-coupled receptors; mGlu5, metabotropic glutamate receptor 5; PLC, phospholipase C; PI, phosphatidylinositol; PIP2, phosphatidylinositol 4,5-bisphosphate; HEK, human embryonic kidney; EGFP, enhanced green fluorescent protein; PH, pleckstrin homology; MPEP, 2-methyl-6-(phenylethynyl)-pyridine; CPCCOEt, 7-(hydroxyimino)cyclopropan[b]chromen-1a-carboxylate ethyl ester; BAPTA, 1,2-bis-(2-aminophenoxy)ethane-N,N,N′,N′-tetraacetic acid; 2-APB, 2-aminoethoxydiphenyl borate; CREB, cAMP-response element-binding protein; RyR, ryanodine receptor; IGF, insulin-like growth factor; PI3K, phosphatidylinositol 3-kinase; siRNA, small interfering RNA; PC, phosphatidylcholine; IP, inositol phosphate; LPA, lysophosphatidic acid; DNGαq, dominant negative Gαq; DsRed, Discosoma sp. red fluorescent protein.
References
- 1.Berridge, M. J. (2001) Novartis Found. Symp. 239 52-64 [PubMed] [Google Scholar]
- 2.Power, J. M., and Sah, P. (2002) J. Neurosci. 22 3454-3462 [DOI] [PMC free article] [PubMed] [Google Scholar]
- 3.Gerasimenko, O. V., Gerasimenko, J. V., Tepikin, A. V., and Petersen, O. H. (1995) Cell 80 439-444 [DOI] [PubMed] [Google Scholar]
- 4.Humbert, J. P., Matter, N., Artault, J. C., Koppler, P., and Malviya, A. N. (1996) J. Biol. Chem. 271 478-485 [DOI] [PubMed] [Google Scholar]
- 5.Alonso, M. T., Villalobos, C., Chamero, P., Alvarez, J., and Garcia-Sancho, J. (2006) Cell Calcium 40 513-525 [DOI] [PubMed] [Google Scholar]
- 6.Echevarria, W., Leite, M. F., Guerra, M. T., Zipfel, W. R., and Nathanson, M. H. (2003) Nat. Cell Biol. 5 440-446 [DOI] [PMC free article] [PubMed] [Google Scholar]
- 7.Gerasimenko, J. V., Maruyama, Y., Yano, K., Dolman, N. J., Tepikin, A. V., Petersen, O. H., and Gerasimenko, O. V. (2003) J. Cell Biol. 163 271-282 [DOI] [PMC free article] [PubMed] [Google Scholar]
- 8.Quesada, I., and Verdugo, P. (2005) Biophys. J. 88 3946-3953 [DOI] [PMC free article] [PubMed] [Google Scholar]
- 9.Marchenko, S. M., and Thomas, R. C. (2006) Cerebellum 5 36-42 [DOI] [PubMed] [Google Scholar]
- 10.Marchenko, S. M., Yarotskyy, V. V., Kovalenko, T. N., Kostyuk, P. G., and Thomas, R. C. (2005) J. Physiol. 565 897-910 [DOI] [PMC free article] [PubMed] [Google Scholar]
- 11.Ito, M. (2001) Physiol. Rev. 81 1143-1195 [DOI] [PubMed] [Google Scholar]
- 12.Ibarra, C., Estrada, M., Carrasco, L., Chiong, M., Liberona, J. L., Cardenas, C., Diaz-Araya, G., Jaimovich, E., and Lavandero, S. (2004) J. Biol. Chem. 279 7554-7565 [DOI] [PubMed] [Google Scholar]
- 13.Irvine, R. F. (2003) Nat. Rev. Mol. Cell. Biol. 4 349-360 [DOI] [PubMed] [Google Scholar]
- 14.Adebanjo, O. A., Anandatheerthavarada, H. K., Koval, A. P., Moonga, B. S., Biswas, G., Sun, L., Sodam, B. R., Bevis, P. J., Huang, C. L., Epstein, S., Lai, F. A., Avadhani, N. G., and Zaidi, M. (1999) Nat. Cell Biol. 1 409-414 [DOI] [PubMed] [Google Scholar]
- 15.Milligan, G., and Kostenis, E. (2006) Br. J. Pharmacol. 147 Suppl. 1, S46-S55 [DOI] [PMC free article] [PubMed] [Google Scholar]
- 16.Exton, J. H. (1996) Annu. Rev. Pharmacol. Toxicol. 36 481-509 [DOI] [PubMed] [Google Scholar]
- 17.Neves, S. R., Ram, P. T., and Iyengar, R. (2002) Science 296 1636-1639 [DOI] [PubMed] [Google Scholar]
- 18.O'Malley, K. L., Jong, Y. J., Gonchar, Y., Burkhalter, A., and Romano, C. (2003) J. Biol. Chem. 278 28210-28219 [DOI] [PubMed] [Google Scholar]
- 19.Jong, Y. J., Kumar, V., Kingston, A. E., Romano, C., and O'Malley, K. L. (2005) J. Biol. Chem. 280 30469-30480 [DOI] [PubMed] [Google Scholar]
- 20.Gobeil, F., Fortier, A., Zhu, T., Bossolasco, M., Leduc, M., Grandbois, M., Heveker, N., Bkaily, G., Chemtob, S., and Barbaz, D. (2006) Can. J. Physiol. Pharmacol. 84 287-297 [DOI] [PubMed] [Google Scholar]
- 21.Zhu, T., Gobeil, F., Vazquez-Tello, A., Leduc, M., Rihakova, L., Bossolasco, M., Bkaily, G., Peri, K., Varma, D. R., Orvoine, R., and Chemtob, S. (2006) Can. J. Physiol. Pharmacol. 84 377-391 [DOI] [PubMed] [Google Scholar]
- 22.Jong, Y. J., Schwetye, K. E., and O'Malley, K. L. (2007) J. Neurochem. 101 458-469 [DOI] [PubMed] [Google Scholar]
- 23.Hughes, T. E., Zhang, H., Logothetis, D. E., and Berlot, C. H. (2001) J. Biol. Chem. 276 4227-4235 [DOI] [PubMed] [Google Scholar]
- 24.Romano, C., Miller, J. K., Hyrc, K., Dikranian, S., Mennerick, S., Takeuchi, Y., Goldberg, M. P., and O'Malley, K. L. (2001) Mol. Pharmacol. 59 46-53 [PubMed] [Google Scholar]
- 25.Higuchi, R. (1990) in PCR Protocols: A Guide to Methods and Applications (Innis, M. A., Gelfand, D. H., Sninsky, J. J., and White, T. J., eds) pp. 177-183, Academic Press, San Diego, CA
- 26.Stauffer, T. P., Ahn, S., and Meyer, T. (1998) Curr. Biol. 8 343-346 [DOI] [PubMed] [Google Scholar]
- 27.Lauckner, J. E., Hille, B., and Mackie, K. (2005) Proc. Natl. Acad. Sci. U. S. A. 102 19144-19149 [DOI] [PMC free article] [PubMed] [Google Scholar]
- 28.Kim, Y. H., Song, M., Oh, Y. S., Heo, K., Choi, J. W., Park, J. M., Kim, S. H., Lim, S., Kwon, H. M., Ryu, S. H., and Suh, P. G. (2006) J. Cell. Physiol. 207 689-696 [DOI] [PubMed] [Google Scholar]
- 29.Eder, A., and Bading, H. (2007) BMC Neurosci. 8 57. [DOI] [PMC free article] [PubMed] [Google Scholar]
- 30.Romano, C., Yang, W. L., and O'Malley, K. L. (1996) J. Biol. Chem. 271 28612-28616 [DOI] [PubMed] [Google Scholar]
- 31.Bolsover, S., Ibrahim, O., O'Luanaigh, N., Williams, H., and Cockcroft, S. (2001) Biochem. J. 356 345-352 [DOI] [PMC free article] [PubMed] [Google Scholar]
- 32.Young, K. W., Nash, M. S., Challiss, R. A., and Nahorski, S. R. (2003) J. Biol. Chem. 278 20753-20760 [DOI] [PubMed] [Google Scholar]
- 33.Sorensen, A. M., and Baran, D. T. (1995) J. Cell. Biochem. 58 15-21 [DOI] [PubMed] [Google Scholar]
- 34.Klco, J. M., Wiegand, C. B., Narzinski, K., and Baranski, T. J. (2005) Nat. Struct. Mol. Biol. 12 320-326 [DOI] [PubMed] [Google Scholar]
- 35.Kingston, A. E., Griffey, K., Johnson, M. P., Chamberlain, M. J., Kelly, G., Tomlinson, R., Wright, R. A., Johnson, B. G., Schoepp, D. D., Harris, J. R., Clark, B. P., Baker, R. S., and Tizzano, J. T. (2002) Neurosci. Lett. 330 127-130 [DOI] [PubMed] [Google Scholar]
- 36.Francesconi, A., and Duvoisin, R. M. (1998) J. Biol. Chem. 273 5615-5624 [DOI] [PubMed] [Google Scholar]
- 37.Kniazeff, J., Bessis, A. S., Maurel, D., Ansanay, H., Prezeau, L., and Pin, J. P. (2004) Nat. Struct. Mol. Biol. 11 706-713 [DOI] [PubMed] [Google Scholar]
- 38.Thomas, D., Tovey, S. C., Collins, T. J., Bootman, M. D., Berridge, M. J., and Lipp, P. (2000) Cell Calcium 28 213-223 [DOI] [PubMed] [Google Scholar]
- 39.Gerasimenko, O., and Tepikin, A. (2005) Cell Calcium 38 201-211 [DOI] [PubMed] [Google Scholar]
- 40.Bunce, M. W., Bergendahl, K., and Anderson, R. A. (2006) Biochim. Biophys. Acta 1761 560-569 [DOI] [PubMed] [Google Scholar]
- 41.Martelli, A. M., Fiume, R., Faenza, I., Tabellini, G., Evangelista, C., Bortul, R., Follo, M. Y., Fala, F., and Cocco, L. (2005) Histol. Histopathol. 20 1251-1260 [DOI] [PubMed] [Google Scholar]
- 42.Horowitz, L. F., Hirdes, W., Suh, B. C., Hilgemann, D. W., Mackie, K., and Hille, B. (2005) J. Gen. Physiol. 126 243-262 [DOI] [PMC free article] [PubMed] [Google Scholar]
- 43.Ango, F., Prezeau, L., Muller, T., Tu, J. C., Xiao, B., Worley, P. F., Pin, J. P., Bockaert, J., and Fagni, L. (2001) Nature 411 962-965 [DOI] [PubMed] [Google Scholar]
- 44.Muhlemann, A., Diener, C., Fischer, C., Piussi, J., Stucki, A., and Porter, R. H. (2005) Br. J. Pharmacol. 144 1118-1125 [DOI] [PMC free article] [PubMed] [Google Scholar]
- 45.Bartlett, P. J., Young, K. W., Nahorski, S. R., and Challiss, R. A. (2005) J. Biol. Chem. 280 21837-21846 [DOI] [PubMed] [Google Scholar]
- 46.Halet, G., Tunwell, R., Balla, T., Swann, K., and Carroll, J. (2002) J. Cell Sci. 115 2139-2149 [DOI] [PubMed] [Google Scholar]
- 47.Gafni, J., Munsch, J. A., Lam, T. H., Catlin, M. C., Costa, L. G., Molinski, T. F., and Pessah, I. N. (1997) Neuron 19 723-733 [DOI] [PubMed] [Google Scholar]
- 48.Oka, T., Sato, K., Hori, M., Ozaki, H., and Karaki, H. (2002) Br. J. Pharmacol. 135 1959-1966 [DOI] [PMC free article] [PubMed] [Google Scholar]
- 49.Stallings, J. D., Tall, E. G., Pentyala, S., and Rebecchi, M. J. (2005) J. Biol. Chem. 280 22060-22069 [DOI] [PubMed] [Google Scholar]
- 50.Yagisawa, H. (2006) J. Cell. Biochem. 97 233-243 [DOI] [PubMed] [Google Scholar]
- 51.Willard, F. S., and Crouch, M. F. (2000) Immunol. Cell Biol. 78 387-394 [DOI] [PubMed] [Google Scholar]
- 52.D'Santos, C., Clarke, J. H., Roefs, M., Halstead, J. R., and Divecha, N. (2000) Eur. J. Histochem. 44 51-60 [PubMed] [Google Scholar]
- 53.Chatterjee, T. K., and Fisher, R. A. (2000) J. Biol. Chem. 275 24013-24021 [DOI] [PubMed] [Google Scholar]
- 54.Ventura, C., and Maioli, M. (2001) Crit. Rev. Eukaryotic Gene Expression 11 243-267 [PubMed] [Google Scholar]
- 55.Beaulieu, J. M., Sotnikova, T. D., Marion, S., Lefkowitz, R. J., Gainetdinov, R. R., and Caron, M. G. (2005) Cell 122 261-273 [DOI] [PubMed] [Google Scholar]
- 56.Bhattacharya, M., Peri, K., Ribeiro-da-Silva, A., Almazan, G., Shichi, H., Hou, X., Varma, D. R., and Chemtob, S. (1999) J. Biol. Chem. 274 15719-15724 [DOI] [PubMed] [Google Scholar]
- 57.Gobeil, F., Jr., Dumont, I., Marrache, A. M., Vazquez-Tello, A., Bernier, S. G., Abran, D., Hou, X., Beauchamp, M. H., Quiniou, C., Bouayad, A., Choufani, S., Bhattacharya, M., Molotchnikoff, S., Ribeiro-Da-Silva, A., Varma, D. R., Bkaily, G., and Chemtob, S. (2002) Circ. Res. 90 682-689 [DOI] [PubMed] [Google Scholar]
- 58.Hermans, E., and Challiss, R. A. (2001) Biochem. J. 359 465-484 [DOI] [PMC free article] [PubMed] [Google Scholar]
- 59.MacMillan, D., Chalmers, S., Muir, T. C., and McCarron, J. G. (2005) J. Physiol. 569 533-544 [DOI] [PMC free article] [PubMed] [Google Scholar]
- 60.Marius, P., Guerra, M. T., Nathanson, M. H., Ehrlich, B. E., and Leite, M. F. (2006) Cell Calcium 39 65-73 [DOI] [PubMed] [Google Scholar]
- 61.Hardingham, G. E., and Bading, H. (1999) Microsc. Res. Tech. 46 348-355 [DOI] [PubMed] [Google Scholar]
- 62.West, A. E., Griffith, E. C., and Greenberg, M. E. (2002) Nat. Rev. Neurosci. 3 921-931 [DOI] [PubMed] [Google Scholar]
- 63.Dolmetsch, R. (2003) Sci. STKE 2003, PE4 [DOI] [PubMed]
- 64.Redmond, L., Oh, S. R., Hicks, C., Weinmaster, G., and Ghosh, A. (2000) Nat. Neurosci. 3 30-40 [DOI] [PubMed] [Google Scholar]
- 65.Spitzer, N. C., Lautermilch, N. J., Smith, R. D., and Gomez, T. M. (2000) Bioessays 22 811-817 [DOI] [PubMed] [Google Scholar]
- 66.Kandel, E. R. (2001) Science 294 1030-1038 [DOI] [PubMed] [Google Scholar]
- 67.Limback-Stokin, K., Korzus, E., Nagaoka-Yasuda, R., and Mayford, M. (2004) J. Neurosci. 24 10858-10867 [DOI] [PMC free article] [PubMed] [Google Scholar]
- 68.Soderling, T. R. (1999) Trends Biochem. Sci. 24 232-236 [DOI] [PubMed] [Google Scholar]
Associated Data
This section collects any data citations, data availability statements, or supplementary materials included in this article.


