

Abstract
Automobile crash reports show that up to 40% of fatal crashes in the United States involve alcohol and that younger drivers are over-represented. Alcohol use among young drivers is associated with impulsive and risky driving behaviors, such as speeding, which could contribute to their over-representation in alcohol-related crash statistics. Recent laboratory studies show that alcohol increases impulsive behaviors by impairing the drinker’s ability to inhibit inappropriate actions and that this effect can be exacerbated in conflict situations where the expression and inhibition of behavior are equally motivating. The present study tested the hypothesis that this response conflict might also intensify the disruptive effects of alcohol on driving performance. Fourteen subjects performed a simulated driving and a cued go/no-go task that measured their inhibitory control. Conflict was motivated in these tasks by providing equal monetary incentives for slow, careful behavior (e.g., slow driving, inhibiting impulses) and for quick, abrupt behavior (fast driving, disinhibition). Subjects were tested under two alcohol doses (0.65 g/kg and a placebo) that were administered twice: when conflict was present and when conflict was absent. Alcohol interacted with conflict to impair inhibitory control and to increase risky and impaired driving behavior on the drive task. Also, individuals whose inhibitory control was most impaired by alcohol displayed the poorest driving performance under the drug. The study demonstrates potentially serious disruptions to driving performance as a function of alcohol intoxication and response conflict, and points to inhibitory control as an important underlying mechanism.
Keywords: Alcohol, Driving, Impulsivity, Response Conflict
1. Introduction
Automobile crash reports have shown that up to 40% of fatal crashes in the United States involve alcohol and that younger drivers are over-represented among these alcohol-related crashes (Evans, 2004). During the year 2002, over 17,000 motor vehicle fatalities in the United States involved alcohol, representing an average of one alcohol-related fatality every 30 minutes (National Highway Traffic Safety Administration, 2002). Younger drivers constitute a higher percentage of alcohol-related crashes than any other age group. Drivers under 20 years have a 5-fold average risk of alcohol-related crashes compared with drivers over age 30 (e.g., Keall et al., 2004). There is considerable interest in identifying possible factors that could account for this over-representation and much of this research effort has hinged on the assumption that younger drivers are typically at a greater risk because they are less experienced in terms of their driving ability and in terms of their exposure to alcohol (e.g., Harrison and Fillmore, 2005).
Although younger individuals might be less experienced drivers, they also possess certain personality traits that distinguished them from older individuals. It is well documented that younger individuals are characterized by greater levels of impulsivity, leading to increased risk-taking and sensation-seeking (for a review, see Dahl, 2004). Indeed, some research suggests that these personality characteristics might also confer increased risk for alcohol-related accidents in this population. Survey-based studies of alcoholic and non-alcoholic drivers found individuals who scored high on measures of impulsivity, sensation-seeking, and aggression also reported past histories of alcohol-related accidents, DUIs, and other traffic violations (for reviews see Donovan et al., 1983; Miller and Windle, 1990). These data have led to interactional hypotheses which argue that the impairing effects of alcohol on driving performance might be exacerbated by certain personality characteristics of the driver, such as impulsivity (e.g., Beirness, 1993; Jonah et al., 2001; McMillen et al., 1989). Although rarely tested empirically, such hypotheses have considerable intuitive appeal as these drivers would be expected to take greater risks while driving, such as speeding and passing cars, all of which could increase accident risk, especially while under the behaviorally-impairing effects of alcohol.
During the past decade, laboratory studies have provided considerable support for the notion that alcohol can actually promote impulsive actions by impairing basic inhibitory mechanisms that normally serve to suppress inappropriate behavior. Stop-signal and cued go/no-go tasks are reaction time tasks used to model behavioral control as the ability to quickly activate a response to a go-signal and suddenly inhibit a response when a stop-signal occurs (Logan, 1994; Logan and Cowan, 1984; Miller et al., 1991). Studies using these tasks have found that alcohol impairs the ability to inhibit behavior (e.g., de Wit et al., 2000; Fillmore and Vogel-Sprott, 2000; Marczinski and Fillmore, 2003; Mulvihill et al., 1997). Evidence for the reliable impairing effects on inhibitory control in this research is particularly noteworthy given the comparatively mild alcohol doses administered (e.g., 0.45 g/kg - 0.65 g/kg) and the relatively simple nature of the inhibitory response tested. Moreover, the findings are important because they identify a basic inhibitory mechanism that is impaired by alcohol which could contribute to the display of impulsive, aggressive, and other socially inappropriate behaviors under the drug (Fillmore, 2003, 2007; Jentsch and Taylor, 1999).
Laboratory studies also suggest that the disinhibiting effects of alcohol are most pronounced when the inhibition of a response is in conflict with a strong instigation to display the response (Conger, 1956; Curtin and Fairchild, 2003; Fillmore and Vogel-Sprott, 2000). Such conflict is present in situations where there are equal reinforcers or punishments for the expression and inhibition of a behavior. For example, Fillmore and Vogel-Sprott (2000) studied alcohol effects on inhibitory control and found that alcohol only disinhibited responding in situations where displaying a response was as equally motivating as inhibiting the response (i.e., conflicting reinforcement). A meta-analysis of studies of alcohol effects on a variety of social and interpersonal measures (e.g., aggression, risk-taking, sexual behaviors) also found that the disinhibiting effect of the drug was most pronounced when there was some conflicting motivational consequence (e.g., money) for inhibiting and for displaying the response (Steele and Southwick, 1985). In sum, there appears to be a consistent body of laboratory evidence to suggest that the risk of disinhibited, impulsive behavior under alcohol is greatest in conflict situations in which displaying a response is as equaling motivating as inhibiting the response.
Studies of conflict as a mediator of alcohol-induced disinhibition have considerable ecological relevance to behaviors outside the laboratory where conflicting behaviors are often reinforced. For example, response conflict is commonplace in many situations in which people drive automobiles. Being late and in a hurry to drive somewhere is a familiar example of a conflict for many drivers. There is a strong instigation to speed in order to arrive on time and avoid possible punishment for being late for work or some other important engagement. Conflicting with this tendency is the incentive to avoid speeding and risky driving behaviors as these behaviors could result in traffic citations or personal injury (e.g., Aarts and van Schagen, 2006; Blows et al., 2005). There are other factors that can instigate speeding and risky driving behaviors as well. “Joy riding” is an example among younger drivers where peer approval from passengers likely plays a role in motivating speeding and risky driving behaviors of the driver (Simons-Morton et al., 2005). However, at the same time, such behaviors are in conflict with the ever-present threat of traffic citation or personal injury.
Despite such obvious examples of conflict in driving behavior, there have been no experimental investigations to test the hypothesis that such conflict might interact with alcohol to intensify the impaired and impulsive driving behaviors normally associated with the drug. The present study tested this hypothesis by examining the degree to which alcohol and response conflict interacted to increase impaired and risky driving behaviors. Specifically, the study sought to determine which aspects of driving behavior are disrupted by alcohol in the conflict situation. In particular, it was hypothesized that conflict and alcohol would interact to exacerbate impulsive, risk-taking characteristics of driving behavior, such as speeding, accelerating, and running red lights.
In addition, given the considerable empirical support for the notion that alcohol promotes impulsive actions by impairing basic inhibitory mechanisms, the study also assessed impairment of drivers’ inhibitory control as a co-occurring and perhaps a contributing factor that underlies the display of risky, impulsive driving behavior. Thus, in addition to the driving test, subjects also performed a cued go/no-go task to assess the degree to which alcohol and response conflict interacted to specifically impair their inhibitory control.
2. Method
2.1 Participants
Fourteen adults (7 women and 7 men) between the ages of 21 and 30 years (mean age = 23.5 years, SD = 3.2) participated in this study. In terms of racial makeup, the sample identified themselves as being Caucasian (n=11), African-American (n=1), Hispanic (n=1), or reported no specific racial group (n=1). Volunteers completed questionnaires that provided demographic information, drinking habits, other drug use, and physical and mental health status. The health questionnaires gathered information about the volunteers’ histories of serious physical disease, current physical disease, impaired cardiovascular functioning, chronic obstructive pulmonary disease, seizure, head trauma, CNS tumors, or past histories of psychiatric disorder, (i.e., Axis I, DSM IV). Individuals with a self-reported psychiatric disorder, substance abuse disorder, head trauma, or other CNS injury were excluded from the study. Substance use disorders were assessed using the Structured Clinical Interview for DSM-IV (SCID-IV) and volunteers were excluded if their current use met dependence/withdrawal criteria. As an additional screen for alcohol dependence, volunteers with a score of 5 or higher on the Short-Michigan Alcoholism Screening Test (S-MAST) (Seltzer et al., 1975) were also excluded from the study.
No participant reported the use of any psychoactive prescription medication and recent use of amphetamines (including methylphenidate), barbiturates, benzodiazepines, cocaine, opiates, and tetrahydrocannabinol was assessed by means of urine analysis. Any volunteer who tested positive for the presence of any of these drugs was excluded from participation. No female volunteers who were pregnant or breast-feeding participated in the research, as determined by self-report and urine human chorionic gonadotrophin levels. All participants held a valid driver’s license. The sample reported their driving experience in terms of months of driving since receiving a driver's license (or permit, if applicable). All volunteers had been licensed to drive for at least three years and drove at least twice a week. Participants were recruited via notices posted on community bulletin boards and by classified newspaper advertisements. All volunteers provided informed consent prior to participating. The University of Kentucky Medical Institutional Review Board approved the study, and volunteers received $150 for their participation.
2.2 Apparatus and Materials
2.2.1 Simulated driving task
A computerized driving simulation task was used to measure driving performance (STISIM Drive, Systems Technology Inc., Hawthorne, CA). In a small test room, participants sat in front of the 19-inch computer display that presented the driving simulation. The simulation placed the driver within the cab of the vehicle and provided a view of the roadway and dashboard instruments. Drivers controlled the vehicle by moving a steering wheel and manipulating the accelerator and brake pedals. The drive test was a daylight driving scenario that required participants to drive 31,100 ft (5.9 miles) on a busy street in a metropolitan setting while obeying all traffic laws. Participants had to drive through twenty intersections equipped with traffic lights. At five of the intersections, the traffic light was red and required the driver to stop until the light turned green. At all other intersections, the light was either green or turned yellow as the vehicle approached and did not require the driver to stop. Order of the traffic lights was random. Other vehicles were presented on the roadway at random intervals but required no passing or braking on the part of the driver. Crashes, either into another vehicle or off the road, resulted in the presentation and sound of a shattered windshield. The program then reset the driver in the center of the right lane at the point of the crash. The drive test required between 5 and 10 minutes to complete, depending on the speed of the driver.
2.2.2 Cued Go/No-Go Task
Inhibitory control was measured by a cued go/no-go reaction time task used in other research to measure the disinhibiting effects of alcohol (e.g., Fillmore et al., 2005a; Marczinski and Fillmore, 2003). Cues provide preliminary information regarding the type of imperative target stimulus (i.e., go or no-go) that is likely to follow. The cues have a high probability of signaling the correct target. Inhibitory and activational tendencies show rapid development of cue-dependence as the cues come to elicit preparatory processes for the inhibition or execution of behavior (e.g., Posner, 1980; Miller et al., 1991). The go cue conditions are of particular interest. Go cues generate response prepotency which speeds response time to go targets. However, subjects must overcome this response prepotency in order to inhibit the response if a no-go target is subsequently displayed. Failures to inhibit responses to no-go targets are more frequent following go cues compared with no-go cues, indicating that it is more difficult to inhibit prepotent responses (Miller et al., 1991). Moreover, inhibitory control in this prepotent, go cue condition appears to be highly sensitive to the effects of alcohol and other psychoactive drugs (for a review see Fillmore, 2003).
The task was operated using E-Prime software (Schneider et al., 2002) and was performed on a PC. A trial involved the following sequence of events: presentation of a fixation point (+) for 800 ms; a blank, white screen for 500 ms; a cue (a white rectangle) displayed for one of five stimulus onset asynchronies (SOAs: 100, 200, 300, 400, and 500 ms); a go or no-go target (green or blue rectangle) that remained visible until the participant made a response or 1000 ms had elapsed; and an inter-trial interval of 700 ms.
The cue was a white rectangle (7.5 cm × 2.5 cm) framed in a 0.8 mm black outline that was presented in the center of the computer monitor against a white background. The cue was presented in either a horizontal (height = 2.5 cm, width = 7.5 cm) or vertical (height = 7.5 cm, width = 2.5) orientation. The go and no-go targets were green and blue, respectively. They were displayed on the monitor as a solid hue that filled the interior of the rectangular cue after the duration of the SOA. Participants were instructed to press the forward slash (/) key on the keyboard as soon as a go (green) target appeared and to suppress the response when a no-go (blue) target appeared. Key presses were made with the index finger of the preferred hand. The computer displayed how quickly a participant responded to each go target by presenting the milliseconds elapsed from target onset until the key press. Participants were encouraged to make fast responses (i.e., the fewest milliseconds).
The orientation of the cue (horizontal or vertical) signaled the probability that a go or no-go target would be displayed. Cues presented horizontally preceded the go target on 80% of the trials and preceded the no-go target on 20% of the trials. Cues presented vertically preceded the no-go target on 80% of the trials and preceded the go target on 20% of the trials. Previous research has demonstrated that this level of cue validity produces prepotent responding (Abroms et al., 2003; Marczinski and Fillmore, 2003, 2005). The different SOAs between cues and targets encouraged participants in both conditions to pay attention to the cues, and the variability and randomness of the SOAs prevented the participants from anticipating the exact onset of the targets.
A test consisted of 250 trials that presented the four possible cue-target combinations. An equal number of vertical (125) and horizontal (125) cues were presented before an equal number of go (125) and no-go (125) target stimuli. Each cue-target combination was presented at each of the five SOAs, and an equal number of SOAs separated each cue-target combination. The presentation of cue-target combinations and SOAs was random. For each trial, the computer recorded whether or not a response occurred and, if one occurred, the RT was measured in milliseconds from the onset of the target until the key was pressed. To encourage fast and accurate responding, feedback was presented to the participant during the intertrial interval by displaying the words correct or incorrect along with the RT in milliseconds. A test required approximately 15 minutes to complete.
2.2.3 Personal drinking habits questionnaire (Vogel-Sprott, 1992)
This questionnaire yielded three measures of a participant’s current, typical drinking habits: frequency (the number of drinking occasions per week); dose (milliliters of absolute alcohol per kilogram of body weight typically consumed during a single drinking occasion); duration (time span in hours of a typical drinking occasion).
2.2.4 Subjective intoxication and perceived ability to drive
Participants rated their self-perceived level of intoxication and their ability to drive on 100 mm visual-analogue scales that ranged from 0 "not at all" to 100 "very much". These scales have been used in other alcohol studies of driving and are sensitive to the effects of the drug (e.g., Harrison and Fillmore, 2005; Harrison et al., in press).
2.2.5 Barratt Impulsiveness Scale - BIS-11 (Patton, Stanford and Barratt, 1995)
This 30-item self-report questionnaire is designed to measure the personality dimension of impulsivity. Impulsivity is thought to contribute to the risk of behavioral disinhibition under alcohol (Fillmore, 2007; Finn et al., 1994; Sher and Trull, 1994). Participants rated 30 different statements (e.g., "I do things without thinking") in terms of how typical each statement is for them on a 4-point Likert scale ranging from Rarely/Never to Almost Always/Always. Higher total scores indicate higher levels of self-reported impulsiveness (score range 30–120).
2.2.6 Blood alcohol concentrations (BACs)
BACs were determined from breath samples measured by an Intoxilyzer, Model 400 (CMI Inc., Owensboro, KY).
2.3 Procedure
Individuals responded to the advertisements by calling the laboratory to participate in a telephone intake-screening interview conducted by a research assistant. Volunteers were told that the purpose of the experiment was to study the effects of alcohol on driving performance. All sessions were conducted in the Human Behavioral Pharmacology Laboratory of the Department of Psychology and testing began between 10 a.m. and 6 p.m. Volunteers were required to abstain from alcohol for 24 hours prior to each treatment session and to fast for 4 hours before the test session. At the beginning of each session, body weight was measured, a zero BAC was verified by the Intoxilyzer, and urine samples were tested to verify that participants were negative for recent drug use or pregnancy.
2.3.1 Intake and Familiarization Session
The purpose of the initial intake session was to familiarize participants with the lab procedures and to obtain information on their driving history, drug use, health status, and general demographic characteristics. Participants also performed practice tests to familiarize them with the go/no-go and driving tasks.
2.3.2 Test Sessions
Task performance was tested under 0.65 g/kg alcohol and a placebo. Performance was tested twice under each dose: once without response conflict and once with response conflict. This required four separate test sessions: no conflict + placebo; no conflict + alcohol; conflict + placebo; conflict + alcohol. Each session was conducted on a different day with sessions being separated by a minimum of one day and a maximum of seven days. An average of 16.5 days (SD = 6.5) was required to complete all four sessions.
At the beginning of each test session, participants received either 0.65 g/kg alcohol or a placebo. The 0.65 g/kg dose was administered as 94.6% alcohol divided equally into two drinks containing one part alcohol and three parts carbonated mix. Participants had two minutes to finish each drink, and the second drink was served one minute after the first drink. This dose typically produces an average peak BAC of 80 mg/100 ml, approximately 60 min after drinking. The dose was chosen based on prior research that showed the dose reliably impairs performance on the driving simulator (Harrison and Fillmore, 2005) and can impair inhibitory control in the go/no-go task (Fillmore et al., 2005a). The placebo dose (0.0 g/kg) consisted of a volume of carbonated mix that matched the total volume of the 0.65 g/kg alcohol drink. A small amount (3 ml) of alcohol was floated on the surface of the beverage. It was served in two glasses that had been sprayed with an alcohol mist that resembled condensation and provided a strong alcoholic scent as the beverages were consumed. The timing of placebo beverage consumption was identical to the active dose.
Cued go/no-go task performance was tested at 30 minutes after drinking began and the drive test began at 50 minutes post-drinking. At 45 minutes post-drinking, participants rated their subjective intoxication and perceived ability to drive. Thus, all testing occurred during the ascending period of the blood alcohol curve in the active dose condition. BACs were measured at 30, 50, and 60 minutes post beverage administration. During the placebo sessions, participants also provided breath samples at those times ostensibly to measure their BAC. After a test session concluded the participants relaxed in a waiting room within the laboratory. Participants received a meal and remained at leisure to read magazines or watch television until their BAC fell below 20 mg/100 ml. Transportation home was provided as needed. Upon completing the final session, participants were paid and debriefed.
2.3.2.1 Response Conflict
In the response conflict sessions, monetary reinforcers were made contingent on task performance to produce a conflict between incompatible response styles (fast, “impulsive” behavior vs. slow, “cautious” behavior). For the cued go/no-go task, this conflict was produced by providing monetary reinforcement contingent on the ability to quickly activate responses to go targets, but also on the ability to suddenly inhibit responses to no-go targets. Participants in this condition received five cents for each go target response that was 275 ms or less, and lost 5 cents for each no-go target in which they failed to inhibit their response. Thus, there was equal incentive to be quick in activating a response, but also to be slow and ready to inhibit responses during a test. The 275 ms “fast response” criterion represents the median RT on the task based on aggregate, normative data from the authors’ previous research on this task. The information about the response requirement for the monetary rewards was provided to these individuals immediately prior to performing the test. This reward procedure has been used in previous research to motivate response conflict (e.g., Fillmore et al., 2005b; Fillmore and Vogel-Sprott, 2000).
For the driving test, response conflict was produced by providing monetary reinforcement for quickly completing the drive, but also for safely stopping at all red lights along the way. Just prior to the drive, the experimenter explained that participants could earn money by completing the trip in the shortest time. Participants were shown a chart that presented the pay-offs for completing the trip in various time intervals from shortest to longest: $5 for under 5 minutes, $4 for 5–6 minutes, $3 for 6–7 minutes, $2 for 7–8 minutes, $1 for 9–10 minutes, and 50 cents for over 10 minutes. The experimenter also explained to participants that they would lose 50 cents each time they failed to stop at a red light. This loss conflicted with the incentive to speed during the trip. As with the cued go/no-go task, the information about the response requirement for the monetary rewards was provided to participants immediately prior to performing the drive test. At the end of each conflict session, participants were informed of the money that they had earned for their performance on the cued go/no-go and driving test. This money was added to their payment for participation at the end of the final session.
2.3.2.2 Session Order
Participants were tested under the two no conflict sessions before being tested under the two conflict sessions. This fixed order with regard to conflict manipulation was chosen to prevent possible motivational effects that can carry over from conflict to no conflict situations in these types of studies (Fillmore et al., 2005b). Although the conflict manipulation involves only modest monetary reinforcers, our prior research shows that these incentives can have potent effects on task behavior that can persist even when such reinforcers are removed. The dose order (placebo, 0.65 g/kg alcohol) was counter-balanced across subjects within each conflict condition.
2.4 Criterion Measures
2.4.1 Simulated Drive Task
Several measures of driving performance were obtained during the driving test. The driving aspects that were measured were chosen on the basis of their established sensitivity to the disruptive effects of alcohol as demonstrated in previous research (Harrison and Fillmore, 2005; Harrison et al., in press).
2.4.1.1 Deviation of Lane Position
This is an indicator of the degree of adjustment that a driver implements to maintain a desired position within the lane. The driver’s lane was 12 ft wide and the within-lane position of the vehicle was sampled at each foot of the drive test to yield an average lane position for a drive. Lane position standard deviation (LPSD) was the standard deviation of the driver’s average within-lane position. LPSD is a primary indicator of driving impairment. Greater within-lane deviation indicates poorer driving precision and the measure has been shown to be a sensitive indicator of alcohol intoxication (e.g., Harrison and Fillmore, 2005).
2.4.1.2 Line Crossings
These occurred when the vehicle moved outside the lane, either crossing the center line into the oncoming lane or crossing the road shoulder. The total number of line crossings was recorded for each drive.
2.4.1.3 Steering Rate
This is a measure of the average rate with which the driver turns the steering wheel to maintain position on the road. Sober drivers typically maintain the position of their vehicle by continuous, smooth steering adjustments. However, alcohol-intoxicated drivers are sometimes slow to initiate steering adjustments, especially during turns. Consequently, these drivers make abrupt, quick movements to the steering wheel, which are reflected by an increase in the rate of steering movement. Steering rate was measured in terms of degrees changed in the steering wheel per second. This measure was sampled at every foot of the drive to provide an average steering rate score for a drive test.
2.4.1.4 Driving Speed and Acceleration
The simulator recorded two measures of the driver’s speed during each drive test: the average overall speed (mph) and the average acceleration from a stop. Following each stop at a red light, the simulator recorded the acceleration (feet/second2) due to the throttle for the first 150 feet after the light turned green. These acceleration scores were averaged to provide a mean acceleration score for a drive test.
2.4.1.5 Brake Onset Distance
This measure referred to the distance from a red light at which the driver first applied the brake and was measured in feet from the light. The average brake onset distance was recorded for a drive test.
2.4.1.6 Failures to Stop
The simulator recorded when a driver failed to stop at a red traffic light and the total number of these stopping failures was recorded for each drive test.
2.4.1.7 Off-road and Other Vehicle Impacts
The driving simulator also recorded the number of off-road crashes and impacts involving other vehicles during the test. These events are infrequent in this type of drive scenario and were extremely rare in the present study. For most sessions, there was no off-road or other vehicle impacts recorded for any driver, thus precluding any statistical analyses.
2.4.2 Cued go/no-go Task
2.4.2.1 Failures of Response Inhibition
These were measured as the proportion of no-go targets in which a participant failed to inhibit a response. The measure of interest was the proportion (p) of inhibition failure score in the go cue (i.e., prepotent) condition. Greater p-inhibition failures indicate poorer inhibitory control (i.e., disinhibition). Omission errors were also recorded when participants failed to respond to go targets. Omission errors were infrequent and occurred on no more than 2% of go target trials (~2 trials per test) in either dose condition.
2.4.2.2 Reaction Time
Speed of responding to targets in the go cue condition was measured by the participant’s average RT for a test.
2.5 Data Analyses
Each task measure was analyzed individually by a 2 dose (placebo vs. 0.65 g/kg) X 2 conflict condition (no conflict vs. conflict) within-subjects analysis of variance (ANOVA). Significant interactions were examined by simple effect comparisons between conditions using a limited set of dependent t tests in order to control family-wise error rate.
3. Results
3.1 Drinking Habits and Self-reported Impulsivity
The sample reported an average drinking frequency of 1.7 times per week (SD = 0.7), and consumed an average typical dose of 1.3 ml/kg (SD = 0.5). For a person weighing 75 kg, this dose would approximate 5 bottles of beer containing 5 % alcohol/volume per week. Each drinking occasion lasted an average of 4.1 hours (SD = 1.5). The mean impulsivity score on the BIS-11 was 48.4 (SD = 6.0) with scores ranging from 38 to 61.
3.2 Blood Alcohol Concentrations
There was no detectable BAC in the placebo condition. BAC in the active dose condition was analyzed by a 2 (gender) X 2 (conflict vs. no conflict) X 3 (time) mixed design ANOVA. No main effects or interactions involving gender were observed, ps >.49. Also no main effect or interaction involving conflict was obtained, ps < .60. Thus, BAC did not differ between conflict and no conflict sessions. The analysis did reveal a significant main effect of time owing to the rise in BAC from 30 to 60 minutes post-drinking, F(2, 24) = 34.1, p < .01. In the no conflict session the mean BACs at 30, 50, and 60 minutes were 66.9 (SD = 18.9), 86.1 (SD = 11.5), and 86.9 (SD = 10.3) mg/100 ml, respectively. In the conflict session the mean BACs for the same three time intervals were 68.4 (SD = 18.6), 89.3 (SD = 13.6), and 89.1 (SD = 14.5) mg/100 ml, respectively.
3.3 Analyses of Driving Performance
The mean scores for the driving measures under each dose and conflict condition are presented in Table 1.
Table 1.
Mean performance scores on the drive test and cued go/no-go task by dose and conflict condition (N=14)
| No Conflict | Conflict | Effects | |||||||||
|---|---|---|---|---|---|---|---|---|---|---|---|
| Placebo | Alcohol | Placebo | Alcohol | Dose (D) | Conflict (C) | D×C | |||||
| M | SD | M | SD | M | SD | M | SD | ||||
| Drive Test | |||||||||||
| LPSD (ft) | 0.91 | 0.39 | 1.08 | 0.46 | 0.84 | 0.28 | 1.21 | 0.43 | sig** | ns. | sig** |
| Line Crossings | 0.93 | 3.19 | 2.36 | 4.91 | 0.57 | 1.39 | 2.57 | 5.05 | sig* | ns. | ns. |
| Steer Rate (deg/sec) | 6.81 | 1.61 | 7.81 | 2.44 | 6.77 | 2.36 | 7.94 | 2.50 | sig* | ns. | ns. |
| Drive Speed (mph) | 43.01 | 9.38 | 48.92 | 8.37 | 58.84 | 5.86 | 65.87 | 9.99 | sig** | sig** | ns. |
| Acceleration (ft/sec2) | 8.56 | 1.43 | 9.27 | 1.00 | 9.68 | 0.66 | 9.45 | 0.89 | ns. | ns. | sig* |
| Brake Onset (ft) | 364.4 | 109.9 | 359.4 | 78.1 | 451.4 | 105.2 | 422.2 | 149.5 | ns. | sig** | ns. |
| Stopping Failures | 0.43 | 1.09 | 0.86 | 1.17 | 0.50 | 0.76 | 2.21 | 2.00 | sig** | ns. | sig* |
| Cued Go/No-go Task | |||||||||||
| P-inhibition Failures | 0.09 | 0.10 | 0.07 | 0.08 | 0.10 | 0.09 | 0.17 | 0.15 | ns. | sig* | sig* |
| Reaction Time (ms) | 290.5 | 28.8 | 294.8 | 22.4 | 268.9 | 18.6 | 272.3 | 25.3 | ns. | sig** | ns. |
Note. Effects based on 2 (dose) × 2 (conflict) within-subjects ANOVAs.
p<.05
p<.01.
3.3.1 Deviation of Lane Position (LPSD)
A 2 (dose) X 2 (conflict) ANOVA of LPSD scores obtained a significant main effect of dose, F(1, 13) = 21.6, p < .01, d = 1.24, and a significant dose by conflict interaction, F(1, 13) = 11.0, p < .01, d = 0.65. Figure 1 illustrates the interaction. The figure shows that alcohol generally impaired driving precision as evident by the increase in within-lane deviation under the drug. Moreover, this impairment appeared to be exacerbated by response conflict. Simple effect comparisons between conflict and no conflict conditions confirmed these observations. Under alcohol, drivers’ within-lane deviation was significantly increased by response conflict, t(13) = 2.4, p = .03. By contrast, no significant effect of conflict was evident following placebo (p = .38).
Figure 1.
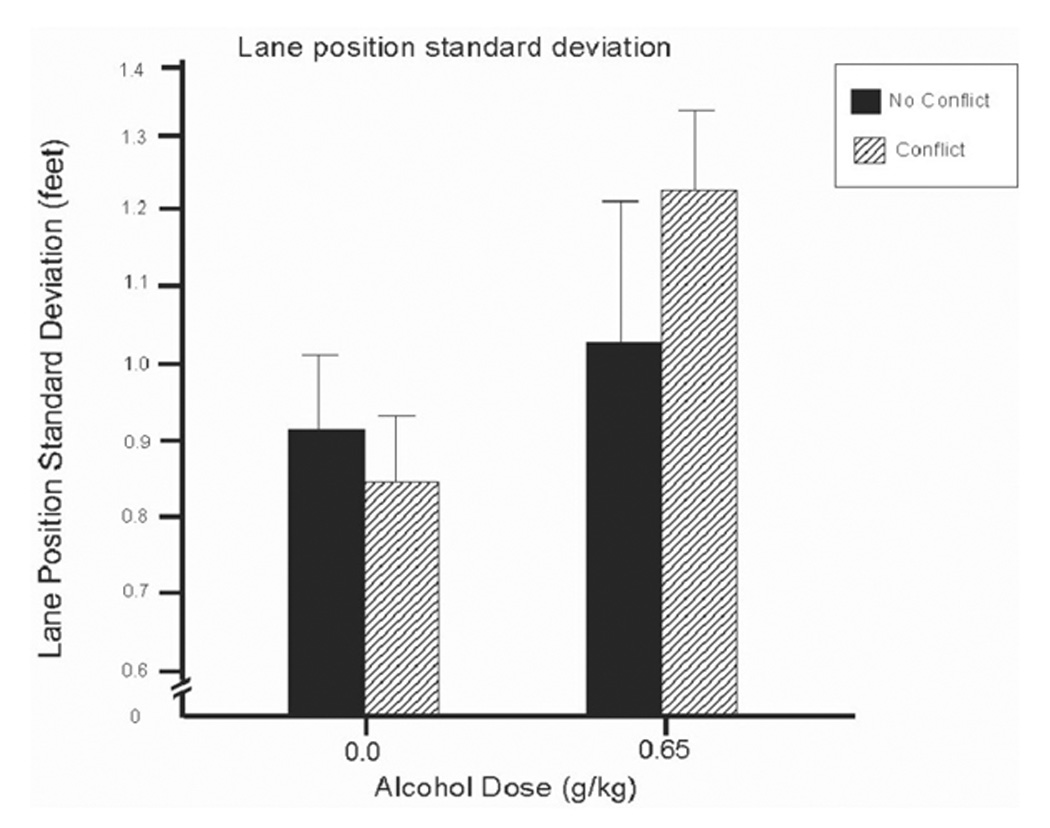
Mean deviation of lane position (LPSD) in the driving simulation under 0.65 g/kg alcohol and placebo in conflict and no conflict conditions. Capped vertical lines indicate standard error of the mean.
3.3.2 Line Crossings
The ANOVA of line crossings obtained a significant main effect of dose, F(1, 13) = 4.5, p = .05, d = 0.57. Table 1 shows that line crossings increased under alcohol compared with placebo. No significant main effect of conflict or interaction was obtained, ps > .65.
3.3.3 Steering Rate
The analysis of steering rate also obtained a significant dose effect, F(1, 13) = 4.4, p = .05, d = 0.56. Table 1 shows that the rate of steering movement was faster under alcohol compared with placebo. No significant effect of conflict or interaction was obtained, ps > .77.
3.3.4 Driving Speed
Drivers’ average speed showed significant main effects of dose, F(1, 13) = 33.0, p < .01, d = 1.54, and conflict, F(1, 13) = 40.5, p = .01, d = 1.7. No significant interaction between alcohol and conflict was observed, p = .78. Table 1 shows that driving speed was increased considerably by response conflict and by alcohol in an additive manner.
3.3.5 Acceleration from Stop
Analysis of drivers’ average acceleration scores revealed a significant interaction between conflict and dose, F(1, 13) = 8.7, p = .01, d = 0.91. Figure 2 shows that when sober (i.e., under placebo), drivers’ acceleration was increased by the presence of conflict. This was confirmed by a simple effect comparison that found significantly greater acceleration in the presence of conflict compared with no conflict, t(13) = 3.4, p < .01. By contrast, under alcohol, drivers’ displayed increased acceleration regardless of conflict. Compared with the placebo + no conflict condition, simple effects tests showed significantly greater acceleration under alcohol in both conflict conditions (ps < .05).
Figure 2.
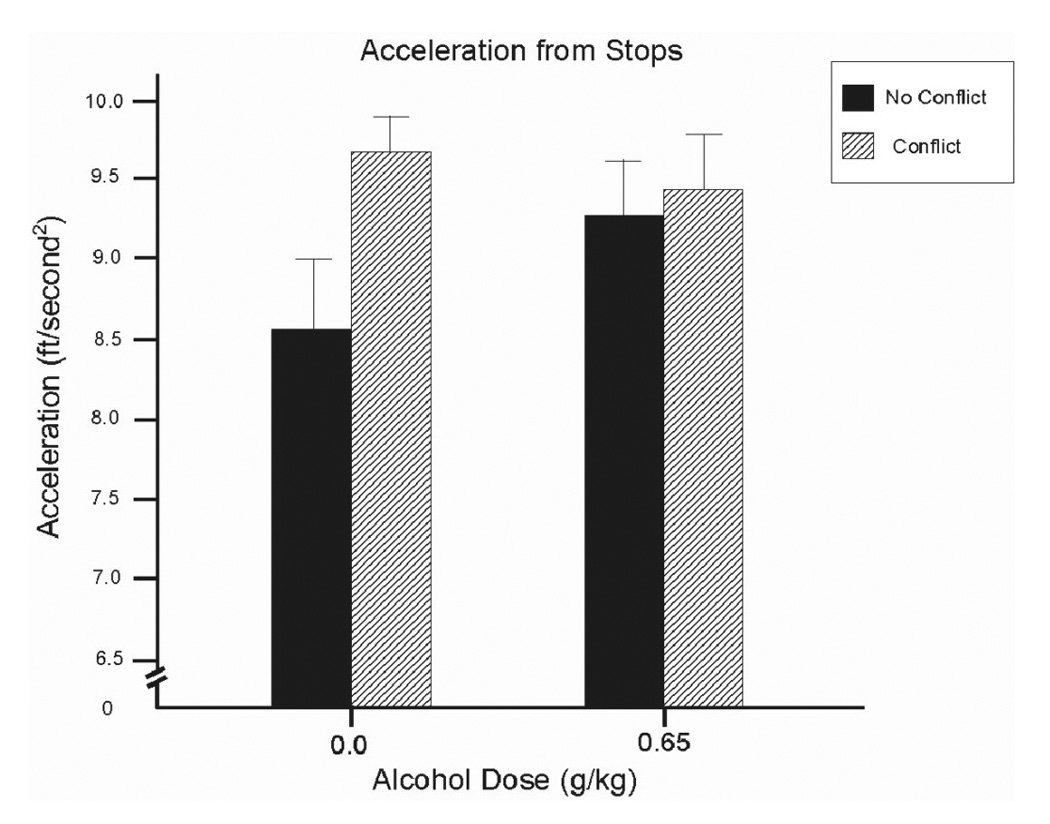
Mean acceleration from a stop in the driving simulation under 0.65 g/kg alcohol and placebo in conflict and no conflict conditions. Capped vertical lines indicate standard error of the mean.
3.3.6 Brake Onset Distance
Analysis of brake onset distance obtained a main effect of conflict, F(1,13) = 16.2, p < .01, d = 0.84. No effects or interaction involving dose was obtained, p > .10. Table 1 shows that brake onset distance to red lights increased in the presence of response conflict.
3.3.7 Stopping Failures
Analysis of stopping failures revealed a significant main effect of dose, F (1,13) = 12.3, p < .01, d = 0.94, and an interaction between conflict and dose, F(13) = 4.4, p = .05, d = 0.84. Figure 3 shows that when sober (i.e., following placebo), drivers rarely failed to stop at red lights regardless of conflict condition. Under alcohol, however, stopping failures increased and this was most pronounced in the presence of response conflict. Simple effect comparisons confirmed that alcohol in combination with response conflict significantly increased stopping failures compared with any other condition (ps < .04).
Figure 3.
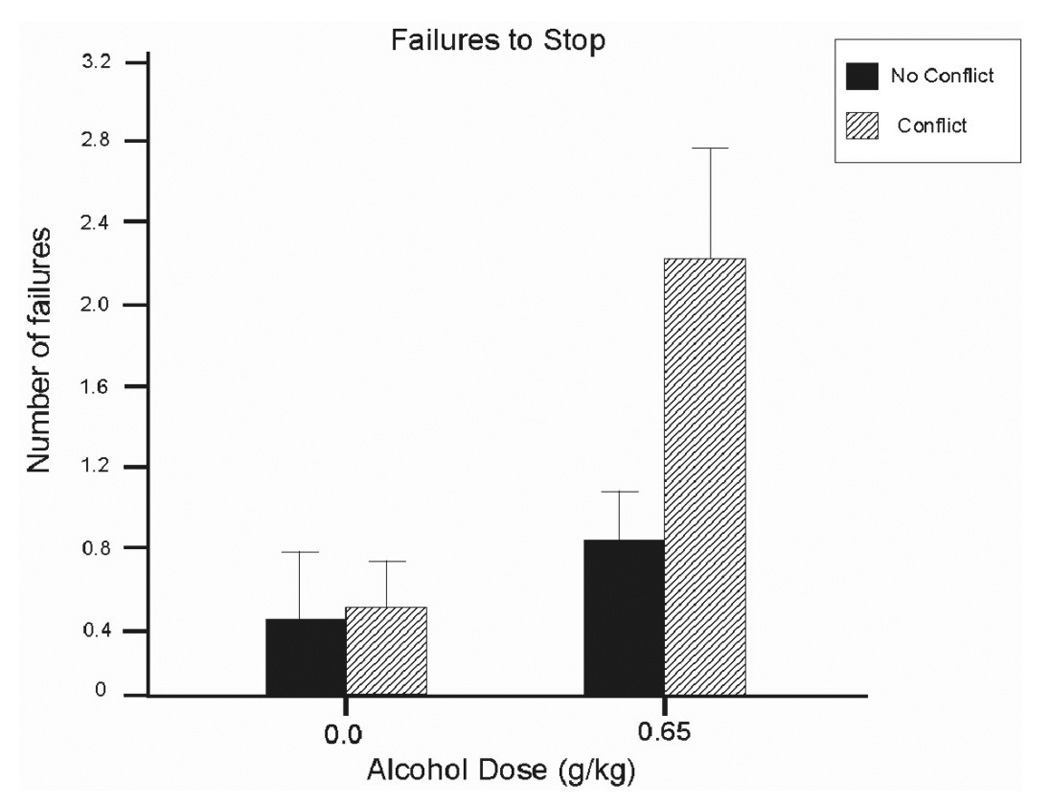
Mean number of failures to stop at red traffic lights in the driving simulation under 0.65 g/kg alcohol and placebo in conflict and no conflict conditions. Capped vertical lines indicate standard error of the mean.
3.4 Analyses of Cued Go/No-go Performance
The mean scores for the cued go/no-go task under each dose and conflict condition are presented in Table 1.
3.4.1 Failures of Response Inhibition
A 2 (dose) × 2 (conflict) ANOVA of p-inhibition failures obtained a significant main effect of conflict, F(1, 13) = 5.1, p = .04, d = 0.61, and a significant dose by conflict interaction, F(1, 13) = 7.0, p = .02, d = 0.81. Figure 4 shows that response conflict generally impaired inhibitory control as evident by the increase in inhibitory failures when conflict was present. Moreover, this impairment was exacerbated by alcohol. Simple effect comparisons between conflict and no conflict conditions confirmed these observations. Under alcohol, inhibitory failures were significantly increased by response conflict, t(13) = 3.0, p = .01. By contrast, no significant effect of conflict was evident following placebo (p = .75).
Figure 4.
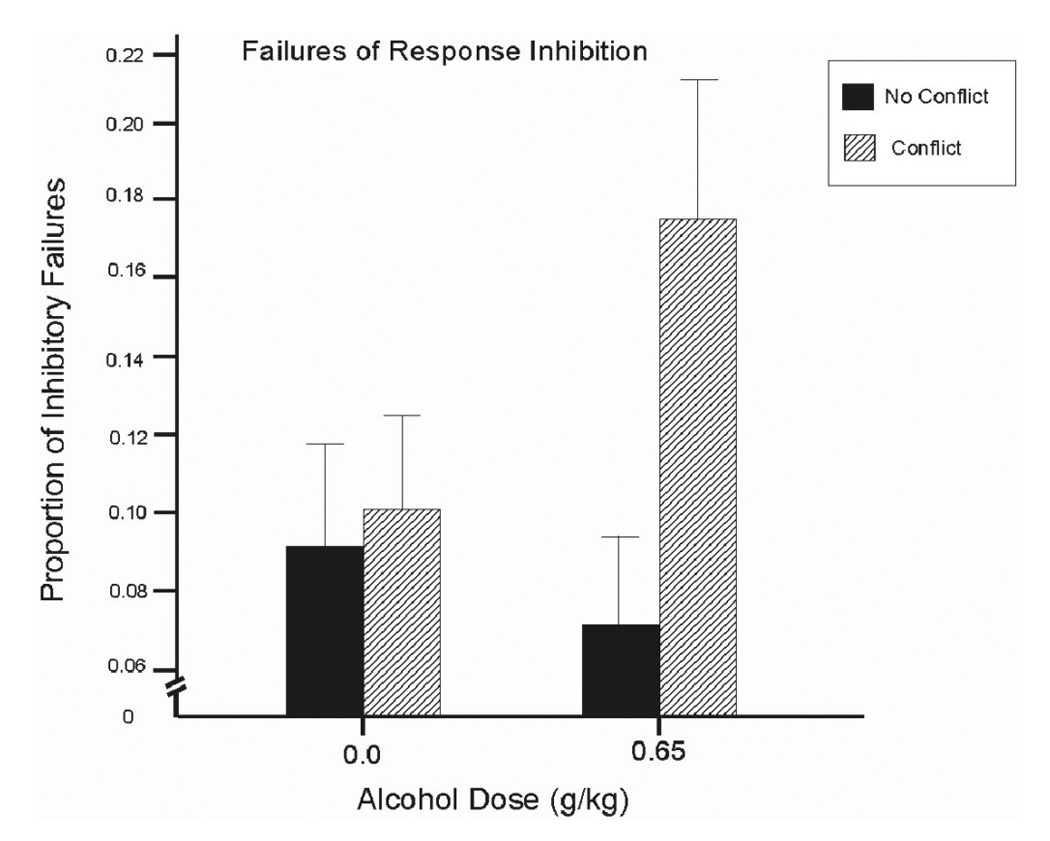
Mean proportion of inhibitory failures on the cued go/no-go task under 0.65 g/kg alcohol and placebo in conflict and no conflict conditions. Capped vertical lines indicate standard error of the mean.
3.4.2 Reaction Time (RT)
Analysis of RT obtained a main effect of conflict, F(1,13) = 40.7, p < .01, d = 1.7. No effects or interaction involving dose was obtained, p > .24. Table 1 shows that participants’ RT to go targets was reduced in the presence of response conflict.
3.5 Correlations of Driving Measures with Inhibitory Control and Self-reported Impulsivity
Given that poor response inhibition is likely an aspect of impulsivity, it might also contribute to the display of poor and impulsive driving behaviors, both when sober and under alcohol. Thus, the study also examined the extent to which individual differences in the various aspects of driving behaviors, in both sober and intoxicated states, could be predicted by drivers’ levels of inhibitory control in those states. To explore these relationships, correlations between measures from the two tasks were examined from the placebo and alcohol sessions in the no conflict condition so that results would be uncontaminated by the influence of monetary incentives (i.e., conflict).
Table 2 presents the correlation of drivers’ p-inhibition failures with each of their driving measures for the placebo and alcohol session. The table shows that drivers’ p-inhibition failures had significant positive correlations with their deviation of lane position (LPSD), line crossings, and stopping failures, both when they were sober (placebo session) and when tested under alcohol. Moreover, under alcohol, drivers’ p-inhibition failures also showed significant positive correlations with average speed and steering rate. Together, these correlations indicate that drivers with poorer inhibitory control also display poorer, more impulsive driving behaviors. Drivers’ self reported levels of impulsivity, as measured by their BIS scores, were also examined in relation to their driving performance when sober and under alcohol. BIS scores showed no significant correlation with any measure of driving performance (ps > .07).
Table 2.
Pearson product-moment correlations of p-inhibition failures with measures of driving performance in the no conflict condition.
| Session | ||
|---|---|---|
| Placebo | Alcohol | |
| LPSD (ft) | 0.658* | 0.850** |
| Line Crossings | 0.562* | 0.881** |
| Stopping Failures | 0.631* | 0.588* |
| Drive Speed (mph) | 0.312 | 0.840** |
| Steer Rate (deg/sec) | 0.228 | 0.628* |
| Acceleration (ft/sec2) | 0.209 | 0.190 |
| Brake Onset | −0.338 | −0.415 |
Note p<.05
p<.01.
3.6 Subjective Intoxication and Perceived Ability to Drive
Participants’ ratings of intoxication and driving ability were each analyzed by a 2 (dose) × 2 (conflict) ANOVA. Only significant main effects of dose were obtained for each measure (ps < .01). Participants rated themselves as more intoxicated and less able to drive during the alcohol sessions as compared with the placebo sessions.
4. Discussion
This study tested the degree to which alcohol and response conflict interact to disinhibit behavior and increase impaired and risky driving behaviors. The results showed that alcohol affected several aspects of driving performance and that some of these effects were most pronounced in the presence of response conflict. Compared with placebo, the profile of driving under alcohol was characterized by greater deviation of lane position, increased line crossings, more failures to stop at red lights, faster, more abrupt steering maneuvers, greater acceleration, and faster overall speed. Moreover, response conflict exacerbated impaired and risky driving behaviors under alcohol by further increasing deviation of lane position and failures to stop at red lights. The study also showed that alcohol and response conflict produced a similar interactive impairing effect on the drivers’ inhibitory control as measured by the cued go/no-go task. Furthermore, individual differences in several aspects of sober and intoxicated driving behavior were related to the drivers’ level of inhibitory control in those states.
The finding that alcohol and response conflict had an interactive influence on behavioral disinhibition as measured by the cued go/no-go task replicates previous research that reported greater alcohol-induced impairment of inhibitory control in the presence of response conflict (Fillmore and Vogel-Sprott, 2000). Taken together, the evidence shows that conflict situations, where displaying a response is as equally motivating as suppressing the response, might represent a high-risk scenario for disinhibited and impulsive behaviors while drinking.
Indeed, the examination of alcohol and response conflict on the driving behaviors of these individuals suggests increased risk for impaired and impulsive driving in this type of situation. Alcohol alone produced marked impairment in several measures of driving behavior. Yet, in addition to this broad-ranging disruption of driving behaviors, response conflict further exacerbated alcohol effects on two different, but equally important aspects of performance. Deviation of lane position and stopping failures at red lights showed pronounced increases under alcohol when drivers were tested in the presence of response conflict. Deviation of lane position measures driver control by evaluating the driver’s ability to maintain the lateral position of the vehicle on the roadway. By contrast, failure to stop at red lights largely reflects a driving style (e.g., rushing, hurrying). Increased stopping failures can be the indirect consequence of speeding or the direct consequence of the driver deciding to “run” the lights in order to obtain the monetary reward for early trip completion. Regardless of the underlying cause, increased stopping failures represents a shift toward a more risky style of driving that might be most evident when intoxicated drivers find themselves motivated to speed or hurry. The tendency to speed in response to alcohol and conflict was also evident in the degree to which drivers accelerated from a stop. Under placebo, acceleration rate was greater when drivers were under conflict. Under alcohol, acceleration was increased regardless of conflict. In fact, the failure to detect an effect of conflict under alcohol appeared to be due to a ceiling effect on the vehicle’s acceleration. The vehicle’s maximum rate of acceleration from a stop is 10.5 feet/sec2 and the average mean accelerations observed under alcohol were near this limit. Taken together, the loss of driver control, coupled with a risky driving style, highlight the serious potential hazards associated with the combination of response conflict and alcohol use.
The study also calls attention to inhibitory control as a specific cognitive-behavioral characteristic that might mediate the response to conflict situations. The study showed that driving behavior was related to the drivers’ inhibitory control. Under alcohol, poor inhibitory control was associated with increased lane deviation, line crossings, stopping failures, more abrupt steering maneuvers, and a faster average driving speed. Moreover, some of these relationships were also evident in the sober state as well (i.e., placebo). By contrast, correlational analyses failed to show that driving behavior was related to the drivers’ self-reported levels of impulsivity. It has been argued that alcohol interacts with impulsive traits to intensify impaired and risky driving behaviors (e.g., Beirness, 1993; Jonah et al., 2001; McMillen et al., 1989). Indeed, questionnaire-based studies report that drivers who score high on impulsivity scales tend to report increased alcohol-related accidents (Donovan et al., 1983; Miller and Windle, 1990). A core cognitive-behavioral characteristic implicated in impulsive behavior is an impaired ability to inhibit pre-potent (i.e., instigated) behaviors. Albeit exploratory and based on limited sample size, the correlations of inhibitory control with driving performance in the present study do suggest that deficient inhibitory control might be a specific cognitive-behavioral aspect of impulsivity that confers actual driving risk. As such, this fundamental mechanism of behavioral control warrants further study as a mediator of driving behavior, both in the sober and intoxicated state.
It is also important to address some limitations of this research. The findings from the present study are limited to a test of a single dose of alcohol. The 0.65 g/kg dose was chosen because it yields peak BACs of approximately 80 mg/100 ml at which most aspects of behavioral functioning are reliably impaired (Fillmore, 2007, Holloway, 1995). The BAC also represents the legal limit BAC for driving while impaired based on per se laws throughout the United States. As such, the dose has social and legal relevance. However, with the implementation of more sensitive measures of behavioral and cognitive functions in the laboratory, there is increasing evidence for impairments of functioning at BACs below 80 mg/100 ml (Holloway, 1995). Without examining a range of doses in the present study, it remains uncertain if conflict would also have an interactive influence to exacerbate behavioral impairment in response to lower doses that yield BACs below 80 mg/100 ml.
A related issue is that the present study only examined impairment during the ascending limb of the BAC curve. Studies find that behavioral impairment from alcohol tends to be more intense at a given BAC during the ascending versus the descending limb of the BAC curve (e.g., Hurst and Bagley, 1972; Vogel-Sprott, 1979, Post et al., 1998). The reduced impairment at a given BAC on the descending limb is commonly referred to as "acute tolerance", suggesting that the reduction might be due to some adaptive process occurring during physiological exposure to the drug over time. Given that intoxicated driving behavior typically occurs after the individual has stopped drinking, it is reasonable to assume that much of this driving would coincide with the descending limb of the BAC curve when impairment is less intense. However, while some evidence shows that acute tolerance develops to alcohol-induced impairment of motor functions, a recent study found that alcohol-induced impairment of inhibitory control showed no evidence of acute tolerance during the descending limb of the BAC curve (Fillmore et al., 2005a). Thus, the argument that impairment at a given BAC is diminished during the descending versus ascending limb curve might be an overgeneralization given that acute tolerance might not develop uniformly across all aspects of behavioral functioning.
Another limitation concerns the degree to which driving simulators model driving behavior outside the laboratory. Although measures of simulated driving performance attempt to model more complex, “real-life” activities, ironically they often come under greater scrutiny with regard to their ecological validity than do simple laboratory tasks. A common criticism is that simulated driving might overestimate poor or reckless driver behavior because it does not engender the same degree of driver motivation as actual driving, since there is no actual risk to personal injury. However, it also can be argued that the driving simulator actually represents an ideal driving scenario, such that it might overestimate the level of driver performance. The simulated driving scenario in this study was free of the many distractions typically encountered in real-life driving situations, such as noisy passengers, cell-phone conversations, or music on the radio. Such additional elements of real-life driving situations require the ability to divide attention and ignore distraction, likely resulting in a much more challenging situation for drivers, especially when under the influence of alcohol.
Finally, it is important to note that the findings from the present study are based on a relatively small group of subjects. Although capitalizing on a fully within-subjects design affords considerable power for testing hypotheses, the findings cannot generalize to other populations of interest. Such populations include, younger adults who tend to be more impulsive (Dahl, 2004), those with substance abuse problems, and those with disorders of impulse control, such as externalizing disorders. Studies of young adults with externalizing disorders also implicate deficits of inhibitory control in the display of impulsive behaviors, including reckless driving (Barkley et al., 2002). Cued go/no-go and stop-signal tasks reveal deficits of inhibitory control in individuals with disorders characterized by aggressive or impulsive behaviors, such as attention deficit/hyperactivity disorder (ADHD) and anti-social personality (Barkley, 1997; Tannock, 1998). In fact, the deficits of inhibitory control among those with ADHD closely resemble the acute impairments of inhibitory control that are produced by alcohol (Fillmore, 2007; Fillmore and Vogel-Sprott, 1999). In addition, studies find that children with ADHD display increased disinhibition when rewards and punishments for behaviors are in conflict (Milich et al., 1994; Hartung et al., 2005). With regard to driving behavior, survey studies have found that individuals with ADHD experience elevated risks and problems associated with driving. Adolescents and adults with ADHD are more likely than controls to have been involved in accidents, receive traffic citations for speeding, and have their licenses suspended or revoked (Barkley et al., 2002; Fried et al., 2006; Thompson et al., 2007). Studies of simulated driving performance in the laboratory find that individuals with ADHD display poorer driving performance compared with controls (Barkley et al., 1996; Weafer et al., 2007). Moreover, a recent functional analysis of driving impairments showed that the profile of impairment for ADHD drivers resembled that of intoxicated drivers at a BAC of 80 mg/100 ml (Weafer et al., 2007). Taken together, studies of ADHD and acute alcohol intoxication point to an impairment of inhibitory control as a common underlying deficit that could account for the similar profiles of impairment on complex functions, such as operating an automobile.
In conclusion, this study provided evidence concerning the interactive influence of alcohol and response conflict that builds on previous evidence that disinhibiting effects of alcohol are more pronounced when the inhibition of a response is in conflict with a strong instigation to display the response (Conger, 1956; Curtin and Fairchild, 2003; Fillmore and Vogel-Sprott, 2000). The present study is unique in that it demonstrates potentially serious disruptions to driving performance as a function of alcohol intoxication and response conflict, and points to inhibitory control as an important underlying mechanism. Greater consideration of how environmental factors and personal characteristics interact with alcohol should lead to a better understanding of factors contributing to accident risks associated with the young driving population.
Footnotes
Publisher's Disclaimer: This is a PDF file of an unedited manuscript that has been accepted for publication. As a service to our customers we are providing this early version of the manuscript. The manuscript will undergo copyediting, typesetting, and review of the resulting proof before it is published in its final citable form. Please note that during the production process errors may be discovered which could affect the content, and all legal disclaimers that apply to the journal pertain.
References
- Aarts L, van Schagen I. Driving speed and the risk of road crashes: a review. Accid. Anal. Prev. 2006;38:215–224. doi: 10.1016/j.aap.2005.07.004. [DOI] [PubMed] [Google Scholar]
- Abroms BD, Fillmore MT, Marczinski CA. Alcohol-induced impairment of behavioral control: Effects on the alternation and suppression of prepotent responses. J. Stud. Alcohol. 2003;64:687–695. doi: 10.15288/jsa.2003.64.687. [DOI] [PubMed] [Google Scholar]
- Barkley RA. Behavioral inhibition, sustained attention and executive functions: Constructing a unifying theory of ADHD. Psychol. Bull. 1997;121:65–94. doi: 10.1037/0033-2909.121.1.65. [DOI] [PubMed] [Google Scholar]
- Barkley RA, Murphy KR, DuPaul GJ, Bush T. Driving in young adults with attention deficit hyperactivity disorder: knowledge, performance, adverse outcomes, and the role of executive functioning. J. Int. Neuropsychol. Soc. 2002;8:655–672. doi: 10.1017/s1355617702801345. [DOI] [PubMed] [Google Scholar]
- Barkley RA, Murphy KR, Kwasnik D. Motor vehicle driving competencies and risks in teens and young adults with attention deficit hyperactivity disorder. Pediatrics. 1996;98:1089–1095. [PubMed] [Google Scholar]
- Beirness DJ. Do we really drive as we live? The role of personality factors in road crashes. Alcohol, Drugs and Driving. 1993;9:129–143. [Google Scholar]
- Blows S, Ameratunga S, Ivers RQ, Kai Lo S, Norton R. Risky driving habits and motor vehicle injury. Accid. Anal. Prev. 2005;37:619–624. doi: 10.1016/j.aap.2005.03.003. [DOI] [PubMed] [Google Scholar]
- Conger JJ. Reinforcement theory and the dynamics of alcoholism. Q. J. Stud. Alcohol. 1956;17:296–305. [PubMed] [Google Scholar]
- Curtin JJ, Fairchild BA. Alcohol and cognitive control: Implications for regulation of behavior during response conflict. J. Abnorm. Psychol. 2003;112:424–436. doi: 10.1037/0021-843x.112.3.424. [DOI] [PubMed] [Google Scholar]
- Dahl RE. Adolescent brain development: A period of vulnerabilities and opportunities. Ann. N.Y. Acad. Sci. 2004;1021:1–22. doi: 10.1196/annals.1308.001. [DOI] [PubMed] [Google Scholar]
- de Wit H, Crean J, Richards JB. Effects of d-amphetamine and ethanol on a measure of behavioral inhibition in humans. Behav. Neurosci. 2000;114:830–837. doi: 10.1037//0735-7044.114.4.830. [DOI] [PubMed] [Google Scholar]
- Donovan DM, Marlatt GA, Salzberg PM. Drinking behavior, personality factors and high-risk driving. J. Stud. Alcohol. 1983;44:395–428. doi: 10.15288/jsa.1983.44.395. [DOI] [PubMed] [Google Scholar]
- Evans L. Traffic Safety. Bloomfield Hill, MI: Science Serving Society; 2004. [Google Scholar]
- Fillmore MT. Drug abuse as a problem of impaired control: current approaches and findings. Behav. Cogn. Neurosci. Rev. 2003;2:179–197. doi: 10.1177/1534582303257007. [DOI] [PubMed] [Google Scholar]
- Fillmore MT. Acute alcohol induced impairment of cognitive functions: Past and present findings. International Journal on Disability and Human Development. 2007;6:115–125. [Google Scholar]
- Fillmore MT, Marczinski CA, Bowman AM. Acute tolerance to alcohol effects on inhibitory and activational mechanisms of behavioral control. J. Stud. Alcohol. 2005a;66:663–672. doi: 10.15288/jsa.2005.66.663. [DOI] [PubMed] [Google Scholar]
- Fillmore MT, Rush CR, Hays L. Cocaine improves inhibitory control in a human model of response conflict. Exp. Clin. Psychopharmacol. 2005b;13:327–335. doi: 10.1037/1064-1297.13.4.327. [DOI] [PubMed] [Google Scholar]
- Fillmore MT, Vogel-Sprott M. An alcohol model of impaired inhibitory control and its treatment in humans. Exp. Clin. Psychopharmacol. 1999;7:49–55. doi: 10.1037//1064-1297.7.1.49. [DOI] [PubMed] [Google Scholar]
- Fillmore MT, Vogel-Sprott M. Response inhibition under alcohol: Effects of cognitive and motivational conflict. J. Stud. Alcohol. 2000;61:239–246. doi: 10.15288/jsa.2000.61.239. [DOI] [PubMed] [Google Scholar]
- Finn PR, Kessler DN, Hussong AM. Risk for alcoholism and classical conditioning to signals for punishment: evidence for a weak behavioral inhibition system? J. Abnorm Psychol. 1994;103:293–301. doi: 10.1037//0021-843x.103.2.293. [DOI] [PubMed] [Google Scholar]
- Fried R, Petty CR, Surman CB, Reimer B, Aleardi M, Martin JM, Coughlin JF, Biederman J. Characterizing impaired driving in adults with attention deficit hyperactivity disorder: A controlled study. J. Clin. Psychiatry. 2006;67:567–574. doi: 10.4088/jcp.v67n0407. [DOI] [PubMed] [Google Scholar]
- Harrison ER, Fillmore MT. Are bad drivers more impaired by alcohol? Sober driving precision predicts impairment from alcohol in a simulated driving task. Accid Anal Prev. 2005;37:882–889. doi: 10.1016/j.aap.2005.04.005. [DOI] [PubMed] [Google Scholar]
- Harrison ER, Marczinski CA, Fillmore MT. Driver training conditions affect sensitivity to the impairing effects of alcohol on a simulated driving test. Exp. Clin. Psychopharmacol. doi: 10.1037/1064-1297.15.6.588. in press. [DOI] [PubMed] [Google Scholar]
- Hartung CM, McCarty D, Milich R, Martin CA. Parent-adolescent agreement on disruptive behavior symptoms: A multitrait-multimethod model. Journal of Psychopathology and Behavioral Assessment. 2005;27:159–168. [Google Scholar]
- Holloway FA. Low-dose alcohol effects on human behavior and performance. Alcohol Drugs and Driving. 1995;11:39–56. [Google Scholar]
- Hurst PM, Bagley SK. Acute adaptation to the effects of alcohol. Q. J. Stud. Alcohol. 1972;33:358–378. [PubMed] [Google Scholar]
- Jentsch JD, Taylor JR. Impulsivity resulting from frontostriatal dysfunction in drug abuse: implication for the control of behavior by reward-related stimuli. Psychopharmacology. 1999;146:373–390. doi: 10.1007/pl00005483. [DOI] [PubMed] [Google Scholar]
- Jonah BA, Thiessen R, Au-Yeung E. Sensation seeking, risky driving and behavioral adaptation. Accid. Anal. Prev. 2001;33:679–684. doi: 10.1016/s0001-4575(00)00085-3. [DOI] [PubMed] [Google Scholar]
- Keall MD, Frith WJ, Patterson TL. The influence of alcohol, age, and number of passengers on the night-time risk of driver fatal injury in New Zealand. Accid. Anal. Prev. 2004;36:49–62. doi: 10.1016/s0001-4575(02)00114-8. [DOI] [PubMed] [Google Scholar]
- Logan GD. On the ability to inhibit thought and action: A user’s guide to the stop-signal paradigm. In: Dagenbach D, Carr TH, editors. Inhibitory Processes in Attention, Memory, and Language. San Diego, CA: Academic Press; 1994. [Google Scholar]
- Logan GD, Cowan WB. On the ability to inhibit thought and action: A theory of an act of control. Psychol. Rev. 1984;91:295–327. doi: 10.1037/a0035230. [DOI] [PubMed] [Google Scholar]
- Marczinski CA, Fillmore MT. Alcohol increases reliance on cues that signal acts of control. Exp. Clin. Psychopharmacol. 2005;13:15–24. doi: 10.1037/1064-1297.13.1.15. [DOI] [PubMed] [Google Scholar]
- Marczinski CA, Fillmore MT. Preresponse cues reduce the impairing effects of alcohol on the execution and suppression of responses. Exp. Clin. Psychopharmacol. 2003;11:110–117. doi: 10.1037//1064-1297.11.1.110. [DOI] [PubMed] [Google Scholar]
- McMillen DL, Smith SM, Wells-Parker E. The effects of alcohol, expectancy, and sensation seeking on driving risk taking. Addict. Behav. 1989;14:477–483. doi: 10.1016/0306-4603(89)90037-3. [DOI] [PubMed] [Google Scholar]
- Milich R, Hartung CM, Martin CA, Haigler ED. Behavioral disinhibition and underlying processes in adolescents with disruptive behavior disorders. In: Routh DK, editor. Disruptive behavior disorders in childhood. New York: Plenum; 1994. pp. 109–138. [Google Scholar]
- Miller J, Schaffer R, Hackley SA. Effects of preliminary information in a go versus no-go task. Acta Psychol. 1991;76:241–292. doi: 10.1016/0001-6918(91)90022-r. [DOI] [PubMed] [Google Scholar]
- Miller BA, Windle M. Alcoholism, problem drinking, and driving while impaired. In: Mann RE, Wilson RJ, editors. Drinking and driving: Advances in research and prevention. New York, NY: Guilford Press; 1990. pp. 68–95. [Google Scholar]
- Mulvihill LE, Skilling TA, Vogel-Sprott M. Alcohol and the ability to inhibit behavior in men and women. J. Stud. Alcohol. 1997;58:600–605. doi: 10.15288/jsa.1997.58.600. [DOI] [PubMed] [Google Scholar]
- National Highway Traffic Safety Administration. U.S. Department of Transportation, National Highway Traffic Safety Administration. DOT HS 809 606. Washington, DC: 2002. Traffic Safety Facts 2002: Alcohol. [Google Scholar]
- Patton JH, Stanford MS, Barratt ES. Factor structure of the Barratt Impulsiveness Scale. J. Clin. Psychol. 1995;51:768–774. doi: 10.1002/1097-4679(199511)51:6<768::aid-jclp2270510607>3.0.co;2-1. [DOI] [PubMed] [Google Scholar]
- Posner MI. Orienting of attention. Q. J. Exp. Psychol. 1980;32:3–25. doi: 10.1080/00335558008248231. [DOI] [PubMed] [Google Scholar]
- Post R, Tavano LA, Maddock RI. Role of feedback in formation of acute tolerance to alcohol. J. Stud. Alcohol. 1998;59:723–730. doi: 10.15288/jsa.1998.59.723. [DOI] [PubMed] [Google Scholar]
- Schneider W, Eschman A, Zuccolotto A. E-Prime User’s Guide. Pittsburgh, PA: Psychology Software Tools; 2002. [Google Scholar]
- Seltzer ML, Vinokur A, Van Rooijen L. A self-administered Short Michigan Alcoholism Screening Test (SMAST) J. Stud. Alcohol. 1975;36:117–126. doi: 10.15288/jsa.1975.36.117. [DOI] [PubMed] [Google Scholar]
- Sher KJ, Trull TJ. Personality and disinhibitory psychopathology: alcoholism and antisocial personality disorder. J. Abnorm. Psychol. 1994;103:92–102. doi: 10.1037//0021-843x.103.1.92. [DOI] [PubMed] [Google Scholar]
- Simons-Morton B, Lerner N, Singer J. The observed effects of teenage passengers on the risky driving behavior of teenage drivers. Accid. Anal. Prev. 2005;37:973–982. doi: 10.1016/j.aap.2005.04.014. [DOI] [PubMed] [Google Scholar]
- Steele C, Southwick L. Alcohol and social behavior: I. The psychology of drunken excess. J. Pers. Social Psychol. 1985;48:18–34. doi: 10.1037//0022-3514.48.1.18. [DOI] [PubMed] [Google Scholar]
- Tannock R. Attention deficit hyperactivity disorder: Advances in cognitive, neurobiological, and genetic research. J. Child Psychol. Psychiatry. 1998;39:65–99. [PubMed] [Google Scholar]
- Thompson AL, Molina BSG, Pelham W, Gnagy EM. Risky driving in adolescents and young adults with childhood ADHD. J. Pediatr. Psychol. 2007;32:745–759. doi: 10.1093/jpepsy/jsm002. [DOI] [PubMed] [Google Scholar]
- Vogel-Sprott M. Acute recovery and tolerance to low doses of alcohol: Differences in cognitive and motor skill performances. Psychopharmacology. 1979;61:287–291. doi: 10.1007/BF00432274. [DOI] [PubMed] [Google Scholar]
- Vogel-Sprott M. Alcohol Tolerance and Social Drinking: Learning the Consequences. New York: Guilford Press; 1992. [Google Scholar]
- Weafer J, Camarillo D, Fillmore MT, Milich R, Marczinski CA. Driving under the influence of alcohol or ADHD. Manuscript under review. 2007 [Google Scholar]