

Alzheimer’s disease: the way to an effective treatment
With increasing life expectancy in developed countries, diseases typically associated with old age are becoming more frequent and, thus, increasingly gain in socioeconomic importance. Age is a major risk factor for almost all neurodegenerative diseases, in particular dementia. Currently, more than 4 million people in the United States suffer from dementia, the majority of them from Alzheimer’s disease (AD). The cost of dementia to the United States economy is now well over $100 billion per year. It is expected, however, that the incidence of dementia will double during the next 20 years [1] and that its cost will exceed $380 billion per year. Therefore, there is considerable effort to unravel the pathophysiologic mechanisms of AD [2], allowing for the development of effective treatment strategies. Pathologic studies show that neurodegeneration in AD starts in the entorhinal cortex but in later stages also involves the hippocampus, the limbic system, and neocortical regions. It is characterized by accumulations of β-amyloid plaques and neurofibrillary tangles [2–6], which exert direct and indirect neurotoxic effects by promoting oxidative stress [7,8] and inflammation. In the rare forms of early-onset familial AD, mutations of the amyloid precursor protein and the presenilin genes are identified, which are associated with increased amyloid production and deposition, whereas in late-onset AD, intensive research has led to the identification of several risk factors associated with increased amyloid deposition (eg, allele producing the ε4 type of apolipoprotein E [APOE*E4], hyper-homocysteinemia, hyperlipidemia, and disturbances of the neuronal insulin signal transduction pathway) [9]. This increasing knowledge about the mechanisms in AD facilitates the development of treatments aimed at modifying the disease process [10,11] (eg, anti-inflammatory drugs, statins, antioxidants, acetylcho-linesterase inhibitors, γ- and β-secretase inhibitors [5], β-sheet disruptors, immunotherapy, neuroprotective agents [12], and neuroregenerative treatments [2]). Many of these compounds show promising results in animal models and currently are tested in clinical treatment trials in patients who have AD. There is, however, increasing evidence that the detrimental influences of AD on neuronal function and viability probably start several years before the first clinical symptoms develop. In this preclinical stage, an effective treatment of AD has the most impact, because it can prevent, or at least slow down, the development of clinical symptoms and, thus, preserve cognitive functions at the highest level possible [13]. Consequently, in recent years, there has been considerable interest in characterizing the earliest clinical signs of the degenerative process that are likely to evolve to AD. This effort has led to the development of the concept of mild cognitive impairment (MCI), which represents the transitional zone between normal aging and AD. Subjects who have MCI are not demented but have significant deficits in one or more cognitive domains and have an increased risk for developing dementia [14]. Depending on which cognitive domains are most impaired, different subtypes of MCI are distinguished. The subtype most relevant for AD is amnestic MCI, which is defined by the presence of subjective memory complaints and an objective memory impairment relative to the appropriate reference group but otherwise normal general cognitive functions and largely preserved activities of daily living [15]. The annual conversion rate of amnestic MCI to AD is approximately 12% per year, whereas the conversion rate of age-matched subjects who do not have MCI is approximately only 1% to 2% per year.
Assessment of treatment efficacy in Alzheimer’s disease trials
Currently, treatment trials in AD use neuropsychologic measures (eg, the Alzheimer’s Disease Assessment Scale–cognitive subscale [ADAS Cog]) [16] as the primary outcome measure. Measures of cognitive impairment and disability unquestionably reflect meaningful aspects of AD but they also suffer from several limitations. One major problem is their poor test-retest reliability (intraclass correlation coefficients approximately 0.5 – 0.8). This probably reflects the influence on performance of factors that vary between measurement times, such as patients’ mood, the presence of other illnesses or major life events, side effects of other treatments, learning effects in repeated tests, and so forth. The low reliability of these measures reduces their statistical power; thus, large sample sizes and long (approximately 1 year) observation periods are required to see an adequate separation of treatment groups. Prevention trials require even longer observation times (MCI trials are 3–4 years; healthy elderly subject trials are 5–7 years), because the rates of change of cognition and disability are much slower than in AD. Another major limitation of those cognitive and functional outcome measures is their inability to distinguish between treatments that actually slow down or even prevent neuronal death in AD and treatments that are purely symptomatic (eg, enhance cognitive performance but do not influence the neurodegenerative process). Finally, it is possible that a treatment modifies the disease progression of AD, but its effects on cognition and functionality may become apparent only with a delay and, thus, it might be wrongly dismissed as ineffective when only clinical outcome measures are used.
The ideal way to assess the efficacy of a treatment is to determine directly the number and function of neurons surviving as a result of an intervention, but currently this is impossible in patients. Therefore, it is necessary to find surrogate outcome measures that reflect the number of surviving neurons adequately. Neuroimaging and biomarkers from cerebrospinal fluid (CSF) and blood show some promise in this aspect.
Neuroimaging outcome measures for Alzheimer’s disease and mild cognitive impairment trials
The use of structural MR imaging and [18F]-2-fluoro-2-deoxy-2-glucose (FDG) positron emmission tomography (PET) in trials for AD and MCI can complement the information gained from clinical measures in several important aspects. First, neuroimaging has a higher test-retest reliability than cognitive measures (eg, interclass correlation coefficient [ICC] greater than 0.95 for hippocampal volume [17]) and, thus, greatly increases the power to detect longitudinal change and treatment effects. Second, neuroimaging has “face validity” as an index of disease progression, because generally it is accepted that loss of synapses and neurons as a result of neurodegeneration results in reduced brain activity and metabolism (ie, decreased FDG-PET activity) and volume loss in structural MR imaging. Finally, FDG-PET and structural MR imaging are validated quantitatively to some extent by correlation with cognitive and functional measures and correlation with neuropathology at autopsy [18,19]. Therefore, neuroimaging can be helpful in phase II trials (small-scale patient trials to assess treatment efficacy, to determine dosing and side effects, and so forth), because it can provide a signal of treatment effect with small sample sizes in a short period of time; neuroimaging also can be helpful in phase III trials (multicenter, placebo-controlled trials for registration), where it can provide “confirmatory evidence” to substantiate effects on the primary outcomes of cognition and function. For these reasons, neuroimaging methods increasingly are used as additional outcome measures in AD and MCI trials.
Biomarkers as outcome measures for Alzheimer’s disease and mild cognitive impairment trials
Over the past years, several biomarkers in blood and CSF associated with an increased risk for AD have been identified (eg, the 42 amino acid form of β-amyloid proteins [reduced in AD], phosphorylated tau proteins [increased in AD], cytokines and glial fibrillary acidic proteins [markers of inflammation, increased in AD], isoprostanes and 3-nitrotyrosine [markers of oxidative stress, increased in AD], and sulfatides [marker for disordered lipid metabolism, decreased in AD]). Although some of these biomarkers (eg, phosphorylated tau proteins and sulfatides) are useful in differentiating patients who have AD from healthy elderly subjects or from those who have other forms of dementia, no single, consistent, easily reproducible biomarker specific for diagnosis, progression, or treatment effects yet has been identified [20,21].
Conclusions
With increasing age, the incidence and, thus, socioeconomic impact of AD are growing. Increasing knowledge about the pathophysiologic mechanisms leading to AD has led to the development of promising AD treatments. The translation of these new drugs into clinical treatment advances only slowly, however, because the clinical trials necessary to assess the efficacy of these treatments require large patient samples and lengthy observation times. There is growing evidence that neuroimaging measures and blood and CSF biomarkers can be used as complementary outcome markers to reduce sample sizes and observation time, thus accelerating the translation process. Until now, however, it has not been determined which one of those complementary measures or, more likely, which combination of them is best suited to allow for the accurate diagnosis of early AD and MCI and to monitor the efficacy of new treatments. To address these questions, a new, multicenter AD research project, called the Alzheimer’s Disease Neuroimaging Initiative (ADNI), has been launched.
Alzheimer’ Disease Neuroimaging Initiative
The ADNI is funded by the National Institute on Aging and the National Institute of Biomedical Imaging and Bioengineering (NIBIB) of the National Institutes of Health (NIH), several pharmaceutical companies (Pfizer, Wyeth, Eli Lilly, Merck, Glaxo-SmithKline, AstraZeneca, Novartis, Eisai, Elan, Forest Laboratories, Bristol Meyers Squibb), and foundations (Alzheimers Association, Institute for Study of Aging) in conjunction with the NIH Foundation (Fig. 1). This initiative encompasses clinical sites in the United States and Canada and is to date the most comprehensive effort to identify neuroimaging measures and biomarkers associated with cognitive and functional changes in healthy elderly subjects and in subjects who have MCI and AD. The overall goals of the ADNI are:
Fig. 1.
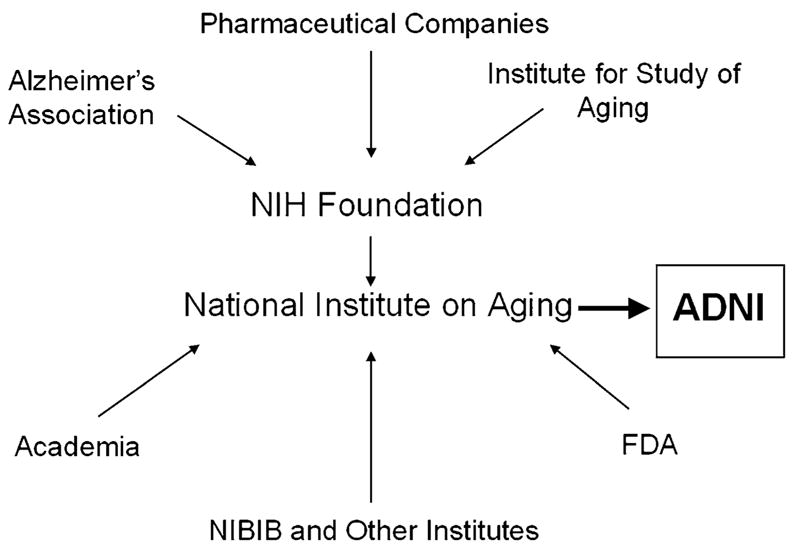
Overview of public and private institutions contributing to the ADNI.
Development of optimized methods leading to uniform standards for acquiring longitudinal, multicenter MR imaging and FDG-PET data on patients who have AD and MCI and healthy elderly controls.
Use of these optimized methods for the acquisition of longitudinal, structural, and metabolic imaging data in a large cohort of healthy elderly subjects and subjects who have MCI and AD and validation of these imaging surrogates with parallel acquired biomarkers and clinical and cognitive measures.
Identification of those neuroimaging measures, cognitive measures, and biomarkers that provide the maximum power for diagnosis of MCI and AD and for the assessment of treatment effects in trials involving healthy elderly subjects and subjects who have MCI and AD.
Creation of a generally accessible imaging and clinical data repository with information on longitudinal changes in brain structure and metabolism, cognitive function, and biomarkers in healthy elderly subjects and subjects who have MCI and AD.
Study outline
There are several ADNI cores (Fig. 2).
Fig. 2.

Overview of the structural organization of the ADNI.
A clinical coordination center (principal investigators [PIs], Drs. L. Thal and R. Peterson), which is responsible for subject recruitment and maintenance, uniform collection and quality control of clinical and neuropsychologic data, deposition of the processed clinical data in a common database, and testing of the clinical hypotheses. All the clinical data of the ADNI (stripped from all identifying information) is available in database format on a public Website [22].
Two neuroimaging cores: (1) MR imaging core (PI, Dr. C. Jack) and (2) PET core (PI, Dr. W. Jagust). These two cores are responsible for determining the optimal imaging parameters, ensuring uniform collection and quality control of the neuroimaging data, and testing of the imaging hypotheses.
A biomarker core (PIs, Drs. J.Q. Trojanowski and L. Shaw, University of Pennsylvania, Philadelphia, Pennsylvania) oversees the collection and storage of blood, urine, and CSF specimens and development of immortalized cell lines for genetic analyses; performs all standard clinical laboratory tests and measurements of selected AD biomarkers (APOE genotype, isoprostanes, tau protein, β-amyloid, sulfatides, and homocysteine). The distribution of samples for further analyses will be controlled by a resource allocation committee (Chair, Dr. F. Beal, Cornell University, Ithaca, New York), which is completely independent from all ADNI investigators.
An informatics core (PI, Dr. A.W. Toga) receives and stores all raw and processed MR imaging and PET images in a generally accessible data repository [22].
A biostatistics core (PI, Dr. L. Beckett) is in charge of the development of statistical tools and all statistical analyses.
The total duration of the ADNI is 5 years, divided into two main phases. The preparation phase takes up the first 6 months of the ADNI and is followed by the execution phase of 54 months. During an enrollment phase of 12 months (June 2005–June 2006), a total of 800 subjects, including 200 healthy elderly subjects, 400 subjects who have MCI, and 200 subjects who have mild AD, are recruited. They will be followed over a period of 2 (subjects who have AD) to 3 (healthy elderly subjects and those who have MCI) years. All study participants have clinical and cognitive assessments and 1.5-T structural MR imaging examinations at specified intervals. In addition, approximately 50% of each group undergoes FDG-PET scans at the same time intervals, and 25% of each group (those who do not have PET) have additional 3-T MR imaging examinations. Biomarkers in blood and urine are collected regularly from all participants; in 20% to 50%, biomarkers also are determined in CSF.
Preparation phase
Clinical coordination center
During this phase, the clinical core establishes a network of clinical sites and develops a plan for the recruitment and retention of subjects. Furthermore, the clinical core prepares the final clinical protocol and informed consent, which is distributed to the sites for local institutional review board (IRB) approval. The ADNI is able to use structures and methods for data management and quality control in the Alzheimer’s Disease Cooperative Study. The preparation phase is used to adapt these existing structures to create a dedicated ADNI Coordination Center (ADNI-CC) for all clinical data and finalize all aspects of data entry and data flow.
Neuroimaging core
The neuroimaging core uses the preparation period to develop the final imaging protocols for MR imaging and PET acquisitions and to develop the procedures necessary for control of data quality and scan consistency.
For the MR imaging part, the following sequences have been chosen for further evaluation: T1-weighted, 3-D volume sequences (spoiled gradient recalled echo/fast low angle shot [SPGR/FLASH], SPGR/FLASH with 30° and 5° flip-angle, and magnetization prepared rapid gradient echo [MP-RAGE]); a multiecho, 3-D volume sequence; and an axial dual-echo, fast spin-echo sequence. Several “test-bed” sites, each operating one of the three different MR platforms used by the participating centers of the ADNI (Siemens, GE, and Philips) first perform phantom experiments and empirically modify the pulse parameters to standardize these sequences across platforms for signal-to-noise ratio (SNR), gray/white contrast, and scan duration. In a second part, each test-bed site studies a small number of control subjects and subjects who have AD with these standardized sequences. These acquisitions are analyzed regarding different aspects (such as SNR, gray/white contrast, artifacts and distortions, and so forth) using visual and computerized methods. Furthermore, several state-of-the-art processing methods (boundary shift integral [BSI], voxel-based morphometry (VBM), tensor-based morphometry (TBM), measurements of cortical thickness, and semiautomated hippocampal volumetry) will be tested regarding their ability (1) to differentiate between groups cross sectionally and (2) to provide consistent measurements in the absence of change in short duration serial examinations. In addition to this, different methods for corrections of B0 inhomogenity, gradient nonlinearity, and motion artifacts will be tested. Based on the results of these comparisons, the sequences, parameters, and corrections methods to be used for the execution phase are selected. The final protocol will contain one T1-weighted, 3-D volumetric sequence; one axial dual-echo, fast spin-echo sequence; and a B1 field map. The acquisition of a SPGR/FLASH double flip-angle sequence and a multiecho 3-D volumetric sequence in addition to these sequences is optional. A similar procedure is used to select and optimize sequences and parameters for 3-T acquisitions. In addition to this, phantoms and strategies for quality control are finalized to ensure the consistent acquisition of high quality data at the different sites. Finally, each site participating in the study has to undergo a qualification procedure to demonstrate the capability of perfect and consistent execution of these standardized imaging sequences.
Similar to the MR imaging part, the PET part of the neuroimaging core also develops a standardized protocol, to which all participating centers have to adhere for all studies acquired for the ADNI. This standard protocol involves the use of a standardized dose of FDG, a standardized incorporation period, and the use of standardized acquisition parameters and standardized corrections for Compton scattered coincidence events, random events, and attenuation correction. The participating sites have to undergo a qualification process that involves the acquisition of phantom data using a protocol with specified radioactivity, imaging times, and geometry. This data is used to assess image quality and uniformity, effective image resolution, and noise and sensitivity of each scanner and to calculate scanner-specific 3-D correction images, which then will be applied to all human PET studies. Sites that have completed this part of the qualification process adequately then will acquire a series of three sequential brain images using the final PET protocol, which will be used to assess scan quality and scan consistency. Those PET sites able to acquire rapid dynamic data while maintaining a linear relationship between radiation dose and scanner measurement also will perform noninvasive quantitative PET imaging. Similar to the MR imaging part, the PET core develops and tests strategies and procedures to ensure quality control and consistent data acquisition at all participating sites during the execution phase.
Execution phase
Clinical core
In the first 12 months of the execution phase, the study participants are recruited and evaluated regarding suitability for the study. Those fulfilling the inclusion criteria for one of the specified groups undergo baseline measurements and then are followed up every 6 months by telephone or in person for the whole duration of the study. MR imaging, PET, and complete neurologic neuropsychologic assessment, including biomarkers in the blood, are collected every 6 months in the first year and then every 12 months. APOE genotyping is performed at the entry; CSF biomarkers are determined at the entry and after the first 12 months. All biologic fluids are stored at the University of Pennsylvania AD Biomarker Fluid Bank Laboratory. All clinical data and results of the laboratory tests are transmitted to the ADNI-CC at University of California, San Diego, where they are entered regularly into the clinical database of the ADNI. The entire clinical database (after removal of all identifying information) will be placed on a public Web site so that it can be accessed by ADNI investigators, the pharmaceutical industry, and the public. Information on the clinical database will be linked with the information in the neuroimaging data repository. The ADNI-CC also is in charge of quality control of the clinical data and monitoring the clinical performance at the sites. In addition to this, it prepares regular progress reports of enrollment statistics, demographics, and clinical and cognitive evaluations for ADNI investigators and sponsors.
Neuroimaging core
Fig. 3 gives an overview of the neuroimaging data flow. After completion of an examination, MR and PET sites send the raw data (MR: k-space and magnitude data of patients and simultaneously acquired phantom examinations; PET: raw sinogram data and images initially reconstructed with an iterative algorithm) to the imaging data repository at the Laboratory of Neuro Imaging (LONI) of the University of California, Los Angeles. From there, the centers responsible for data quality control access the data.
Fig. 3.
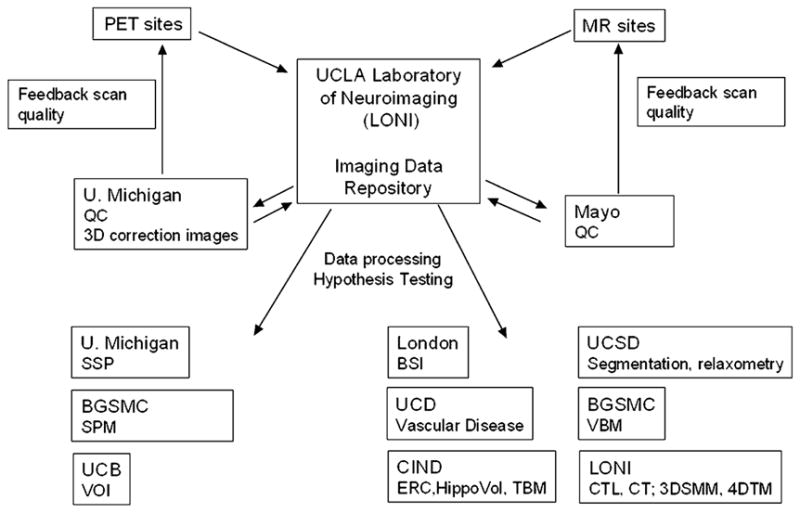
Processing of the neuroimaging data. U. Michigan, University of Michigan; BGSMC, Banner Good Samaritan Medical Center; UCB, University of California, Berkeley; UCD, University of California, Davis; UCSD, University of California, San Diego, Mayo, Mayo Clinic Rochester; CIND, Center for Imaging of Neurodegenerative Diseases, San Francisco; QC, quality control; ERC, volumetric measurement of entorhinal cortex; HippoVol, semiautomated measurement of hippocampal volume; TBM, tensor-based morphometry; segmentation, voxel-based segmentation/brain parcelation; relaxometry, T1/T2 relaxometry; CTL, cortical time-lapse maps; CT, cortical thinning; 3DSMM, parametric 3-D surface mesh modeling of subcortical structures; 4DTM, 4-D tensor maps.
For the MR imaging arm of the study, quality control is performed by the Department of Radiology at the Mayo Clinic, Rochester, Minnesota. The quality of the images is assessed by visual inspection and, in case of follow-up examinations, by coregistration and subtraction from the baseline examination. In addition to this, scan parameters are logged and checked for deviations. If imaging data does not satisfy the specified criteria, the submitting site is notified and instructed about the necessary procedures to amend the problem. The correction procedures as determined in the preparation phase are applied and the corrected images are sent back to the neuroimaging data repository at LONI. In addition, one subject of each group at each time point is selected from each site at regular intervals, pooled with the data from the other sites and analyzed to ensure that the data quality is sufficient for highly automated imaging processing applications. At approximately 2.5 years into the project, all data acquired so far (baseline, 6 months, and 12 months) are analyzed by a variety of state-of-the-art automated processing applications available at the participating centers (BSI, volumetric measurement of entorhinal cortex and hippocampus, tensor-based morphometry, voxel-based segmentation/brain parcelation, T1/T2 relaxometry, VBM, cortical time-lapse maps, cortical thinning, parametric 3-D surface mesh modeling of subcortical structures, and 4-D tensor maps). This allows for a comparison of these methods regarding their immunity to artifacts and cerebrovascular disease, their ability to detect the expected changes cross-sectionally and longitudinally, and their processing speed and cost efficiency. Based on those results, the most promising image processing methods are identified and the remaining means channeled accordingly.
The PET arm of the study uses similar procedures. Quality control is performed by the team at the University of Michigan. PET images are inspected visually and quantitatively and the 3-D correction images are applied. The fully corrected images and the different processing stages between the fully corrected image and the initial reconstruction are sent back to the neuroimaging data repository at LONI. As in the MR imaging arm, PET sites submitting unsatisfactory imaging data will be notified and instructed regarding the necessary procedures. As an additional quality control, all corrected PET data is analyzed continuously with three state-of-the-art processing methods (statistical parametric mapping [SPM], stereotactic surface projections [SSP], and volume-of-interest analyses [VOI]) to ensure that the data quality is sufficient for the automated processing methods and for hypothesis testing. As a part of the developmental work within the ADNI, selected PET sites acquire dynamic PET images for absolute quantification of glucose metabolism in addition to the standard PET data. Additional quality control measures at the sites and at the University of Michigan have been developed to ensure the quality of this data.
Current state of the Alzheimer’ Disease Neuroimaging Initiative
At the time of writing this article (April 2005), the ADNI-CC has recruited a network of more than 50 clinical study sites (Fig. 4). The majority of these also participate in Alzheimer’s Disease Cooperative Study treatment trials and many were involved in a recent treatment study of MCI. The final clinical protocol is established and the informed consent form distributed for approval by the local IRBs. The final decision on the MR imaging sequences to be used in the ADNI will be made in May 2005. The MR imaging and PET phantoms are chosen and ordered. The performance sites have been contacted and it is expected that standardization of MR imaging and PET scanners across sites will start in May 2005. It is anticipated that in June 2005, approximately 20 performance sites will have IRB approval and will be able to begin enrollment. By September 2005, the remainder of the selected sites should have IRB approval and start with enrollment.
Fig. 4.
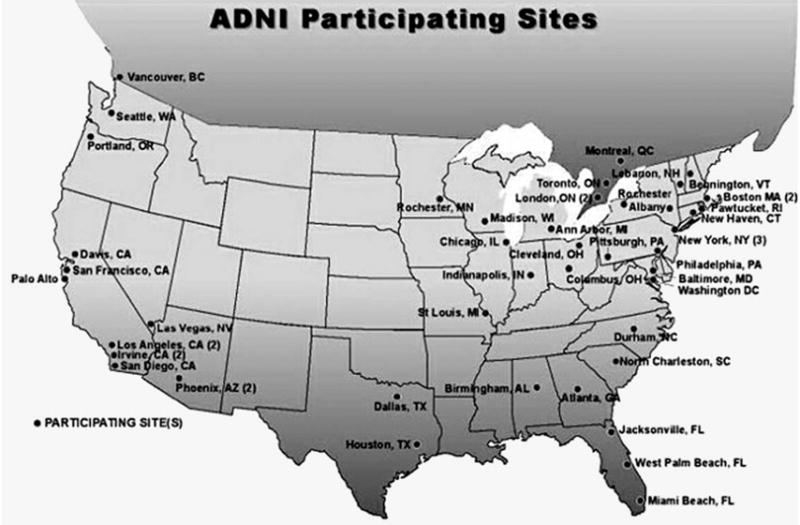
Overview of the clinical sites participating in the ADNI.
Acknowledgments
This article was supported by grant ADNI UO1 AG024904-01.
References
- 1.Katzman R, Fox P. The world-wide impact of dementia. Projections of prevalence and costs. In: Mayeaux R, Christen Y, editors. Epidemiology of Alzheimer’s disease: from gene to prevention. Berlin (Germany): Springer-Verlag; 1999. pp. 1–17. [Google Scholar]
- 2.Dickson D. Neurodegeneration: the molecular pathology of dementia and movement disorders. Neuropath. 2003 [Google Scholar]
- 3.Soto C. Unfolding the role of protein misfolding in neurodegenerative diseases. Nat Rev Neurosci. 2003;4:49–60. doi: 10.1038/nrn1007. [DOI] [PubMed] [Google Scholar]
- 4.Taylor JP, Hardy J, Fischbeck KH. Toxic proteins in neurodegenerative disease. Science. 2002;296:1991–5. doi: 10.1126/science.1067122. [DOI] [PubMed] [Google Scholar]
- 5.Mudher A, Lovestone S. Alzheimer’s disease—do tauists and baptists finally shake hands? Trends Neurosci. 2002;25:22–6. doi: 10.1016/s0166-2236(00)02031-2. [DOI] [PubMed] [Google Scholar]
- 6.Esiri M, Lee V, Trojanowski JQ. The neuropathology of dementia. 2. Cambridge (England): Cambridge University Press; 2004. [Google Scholar]
- 7.Pratico D, Clark CM, Liun F, et al. Increase of brain oxidative stress in mild cognitive impairment: a possible predictor of Alzheimer disease. Arch Neurol. 2002;59:972–6. doi: 10.1001/archneur.59.6.972. [DOI] [PubMed] [Google Scholar]
- 8.DeKosky ST. Pathology and pathways of Alzheimer’s disease with an update on new developments in treatment. J Am Geriatr Soc. 2003;51(5 Suppl Dementia):S314–20. doi: 10.1046/j.1532-5415.5157.x. [DOI] [PubMed] [Google Scholar]
- 9.Bertram L, Tanzi RE. The current status of Alzheimer’s disease genetics: what do we tell the patients? Pharmacol Res. 2004;50:385–96. doi: 10.1016/j.phrs.2003.11.018. [DOI] [PubMed] [Google Scholar]
- 10.Mayeux R, Sano M. Treatment of Alzheimer’s disease. N Engl J Med. 1999;341:1670–9. doi: 10.1056/NEJM199911253412207. [DOI] [PubMed] [Google Scholar]
- 11.Irizarry MC, Hyman BT. Alzheimer disease therapeutics. J Neuropathol Exp Neurol. 2001;60:923–8. doi: 10.1093/jnen/60.10.923. [DOI] [PubMed] [Google Scholar]
- 12.Mattson MP. Excitotoxic and excitoprotective mechanisms: abundant targets for the prevention and treatment of neurodegenerative disorders. Neuromolecular Med. 2003;3:65–94. doi: 10.1385/NMM:3:2:65. [DOI] [PubMed] [Google Scholar]
- 13.DeKosky ST, Marek K. Looking backward to move forward: early detection of neurodegenerative disorders. Science. 2003;302:830–4. doi: 10.1126/science.1090349. [DOI] [PubMed] [Google Scholar]
- 14.Winblad B, Palmer K, Kivipelto M, et al. Mild cognitive impairment–beyond controversies, towards a consensus: report of the International Working Group on Mild Cognitive Impairment. J Intern Med. 2004;256:240–6. doi: 10.1111/j.1365-2796.2004.01380.x. [DOI] [PubMed] [Google Scholar]
- 15.Petersen RC. Mild cognitive impairment as a diagnostic entity. J Intern Med. 2004;256:183–94. doi: 10.1111/j.1365-2796.2004.01388.x. [DOI] [PubMed] [Google Scholar]
- 16.Mohs RC, Marin D, Haroutunian V. Early clinical and biological manifestations of Alzheimer’s disease: implications for screening and treatment. In: Fillit HM, O’Connell AW, editors. Drug discovery and development for Alzheimer’s disease, 2000. Vol. 1. New York: Springer Publishing Company; 2002. pp. 57–63. [Google Scholar]
- 17.Hsu Y, Schuff N, Du A, et al. Comparison of automated and manual hippocampal MR volumetry in aging and Alzheimer disease. J Magn Res Imaging. 2002;16:305–10. doi: 10.1002/jmri.10163. [DOI] [PMC free article] [PubMed] [Google Scholar]
- 18.Davis PC, Gearing M, Gray L, et al. The CERAD experience, part VIII: neuroimaging-neuropathology correlates of temporal lobe changes in Alzheimer’s disease. Neurology. 1995;45:178–9. doi: 10.1212/wnl.45.1.178. [DOI] [PubMed] [Google Scholar]
- 19.Mielke R, Schroder R, Fink GR, et al. Regional cerebral glucose metabolism and postmortem pathology in Alzheimer’s disease. Acta Neuropathol (Berl) 1996;91:174–9. doi: 10.1007/s004010050410. [DOI] [PubMed] [Google Scholar]
- 20.Blennow K. CSF biomarkers for mild cognitive impairment. J Intern Med. 2004;256:224–34. doi: 10.1111/j.1365-2796.2004.01368.x. [DOI] [PubMed] [Google Scholar]
- 21.Irizarry MC. Biomarkers of Alzheimer disease in plasma. Neurorx. 2004;1:226–34. doi: 10.1602/neurorx.1.2.226. [DOI] [PMC free article] [PubMed] [Google Scholar]
- 22.ADNI: Alzheimer’s Disease Neuroimaging Initiative. Data management. [Accessed November 18, 2005]; Available at: http://www.loni.ucla.edu/ADNI/Data/index.shtml.