

Abstract
Objective
The assessment of eating-disordered behaviors in middle childhood is challenging. Frequently, both child and parents are queried about the child’s eating behavior. However, no direct comparisons between parent and child reports of child eating disturbance have been published. We compared results from the adolescent and parent versions of the Questionnaire on Eating and Weight Patterns (QEWP-A and QEWP-P, respectively) in a nontreatment sample of overweight and normal weight children.
Method
The QEWP-A and QEWP-P were administered to 142 overweight (body mass index [BMI] ≥ 85th percentile) and 121 normal weight (BMI 15th–84th percentile) children, age 9.7 ± 1.9 years, recruited from the community.
Results
The QEWP-A and QEWP-P showed good agreement for the absence of eating-disordered behavior but were not concordant in terms of the number or type of binge eating, overeating episodes, or compensatory weight control behaviors in the past 6 months. Children categorized by their own reports (QEWP-A) as engaging in no overeating, simple overeating, or binge eating behaviors did not differ significantly in body composition or in eating and general psychopathology. Children categorized according to their parents’ reports (QEWP-P) as engaging in binge eating had significantly greater body adiposity, eating-disordered cognitions, body dissatisfaction, and parent-reported problems (all ps < .001) than children engaging in no overeating or simple overeating according to the QEWP-P.
Discussion
Child and parent reports of eating behaviors are not concordant regarding the presence of binge eating or compensatory behaviors. Further investigation of the utility of these questionnaires is needed before either can serve as a surrogate for a clinical interview.
Keywords: eating-disordered pathology, binge eating, questionnaires, child, parent
INTRODUCTION
Practitioners and researchers attempting to determine the presence and severity of eating-disordered behaviors in children and adolescents have two potential sources of information: the children themselves, who can be queried directly through interviews or indirectly through questionnaires, and their parents. Studies using child questionnaires suggest that eating-disordered pathology may begin in middle childhood (Maloney, McGuire, Daniels, & Specker, 1989). For example, in a nonclinical sample of overweight children 6–10 years old assessed using the Questionnaire on Eating and Weight Patterns-Adolescent form (QEWP-A; Johnson, Grieve, Adams, & Sandy, 1999), 5.3% met criteria for binge eating disorder (BED), 17.9% self-reported at least one episode of loss of control (LOC) with overeating, and another 15.2% had at least one episode of LOC without overeating (Morgan et al., 2002). In a clinical sample, 36.5% of obese 6–10-year-old children and adolescents seeking residential weight loss treatment met criteria for BED as assessed by the Eating Disorders Examination-Questionnaire (EDE-Q; Decaluwe, Braet, & Fairburn, 2003). Studies in treatment children using interview methodology generally support these findings (Decaluwe & Braet, 2003). Direct comparisons of interviews and questionnaires in children 6–13 years old suggest that questionnaires have high specificity but low sensitivity for the presence of binge eating behaviors (Tanofsky-Kraff et al., 2003).
Although routinely obtained by practitioners, parent reports of their children’s eating disordered behaviors have received considerably less attention from the research community, with few studies comparing child and parent reports. Johnson et al. (1999) compared agreement between adolescent (10–18-year-olds) and parent reports of disordered eating using the QEWP-A and the parent version, the QEWP-P. Although agreement was high (81.6%) for the absence of any diagnosis, there was little concordance when eating-disordered behavior was present (15.5% for nonclinical binge eating and 25% for BED). A literature review, however, found no studies comparing child and parent reports of disordered eating behaviors in younger children.
We therefore compared the responses from the QEWP-A of 6–12-year-old non–treatment-seeking children with their parents’ responses from the QEWP-P, to determine if parent reports accurately reflect children’s self-reported eating and weight control behaviors. We hypothesized that child and parent responses to the QEWP-A and QEWP-P, respectively, would not be concordant.
METHODS
Participants
Two hundred sixty-three children (6–12-year-olds) were recruited as healthy volunteers to participate in metabolic studies at the National Institutes of Health (NIH) Warren Grant Magnuson Clinical Center (Table 1). Participants were recruited through notices mailed to first-grade through fifth-grade children in the Montgomery County and Prince Georges County, Maryland school districts, and by mailings to local family physicians and pediatricians. The children involved in the current study were “healthy volunteers,” as they were not taking any medications for at least 2 weeks before being studied and none had any significant medical disease. All had normal hepatic, renal, and thyroid function. Furthermore, none of the children were currently undergoing weight loss treatment and all were aware that they would not receive medical or psychological treatment as part of the study, but would be monetarily compensated for their time. The National Institute of Child Health and Human Development institutional review board approved the study. Children provided written assent and parents gave written consent for participation in the protocol. Parents of participants also completed questionnaires referenced toward their children.
Table 1.
Sample demographics
| Characteristics | |
|---|---|
| Age (years) | 9.7 ± 1.9 (5.8–12.9) |
| Sex | |
| Female, n = 141 (53.6%) | |
| Male, n = 122 (46.4%) | |
| Race | |
| African American, n = 101 (38.4%) | |
| Caucasian, n = 142 (54.0%) | |
| Other, n = 20 (7.6%) | |
| Hollingshead socioeconomic status index | 2.9 ± 1.1 (1–5) |
| Girl’s breast Tanner stage | 1.9 ± 1.0 (1–5) |
| Boy’s testicular volume (cc) | 2.8 ± 2.3 (1–12) |
| Bone age (years) | 10.5 ± 2.3 (4.6–15.0) |
| Child BMI-SD | 1.7 ± 2.4 (−1.4–11.1) |
| Mother BMI (kg/m2), n = 245 | 33.6 ± 9.1 (18–70) |
| Father BMI (kg/m2), n = 240 | 31.9 ± 7.8 (20–66) |
| DXA fat mass (kg) | 16.9 ± 13.9 (1.9–76.1) |
| DXA fat mass (%) | 31.1 ± 12.3 (7.7–58.0) |
Note: Demographics of study participants (N = 263). BMI-SD = body mass index standard deviation score for age, sex, and race. DXA = dual-energy X-ray absorptiometry.
Psychological Measures
During their visit to the NIH, participants completed self-report questionnaires to assess eating behavior and attitudes towards body shape and weight. A research assistant read questions to children who were unable to read the questions easily themselves. Child measures were completed independent of their parents.
Child Measures
The QEWP-A (Johnson et al., 1999) is a self-report measure designed to identify children with eating disorders as outlined in the 4th ed. of the Diagnostic and Statistical Manual of Mental Disorders (DSM-IV; American Psychiatric Association [APA], 1994). Responses to this questionnaire allow participants to be classified as those reporting overeating (OE), those reporting binge eating behaviors (BE), or those reporting no episodes of disordered eating (NE). It is based on the adult Questionnaire on Eating and Weight Patterns-Revised (QEWP; Spitzer et al., 1993) and differs from the original version in that it substitutes simpler synonyms for difficult words. Psychometric analysis reveals moderate stability, adequate predictive proficiency, and concurrent validity in the adult version (Antony, Johnson, Carr-Nangle, & Abel, 1994; Spitzer et al., 1993). The QEWP-A appears to have adequate concurrent validity when correlated to measures of abnormal eating attitudes and depression (Johnson et al., 1999) and has significant levels of stability for males and females observed over a 3-week period, although males’ responses seem to be more consistent over time than those of females (Johnson, Kirk, & Reed, 2001).
The Children’s Eating Attitudes Test (ChEAT; Maloney et al., 1989) is a 26-item questionnaire that assesses children’s attitudes toward their eating and dieting behavior. This survey is based on the Eating Attitudes Test (EAT; Garner, Olmsted, Bohr, & Garfinkel, 1982), which was developed and tested on adolescents and adults, but was modified to be better understood by younger children. The ChEAT has shown adequate to good internal reliability (Smolak & Levine, 1994) and good test-retest reliability (Maloney et al., 1989).
The Children’s Depression Inventory (CDI; Kovacs & Beck, 1977) is a widely used 27-item self-report measure assessing depressive symptoms. It has demonstrated adequate internal consistency, test-retest reliability, and discriminant validity (Costello & Angold, 1988).
State-Trait Anxiety Inventory for Children (STAIC; Spielberger, Edwards, Lushene, Montuori, & Platzek, 1973) is a 20-question self-report scale of state and trait anxiety. For the current study, only the trait scale was used. The STAIC has been shown to have high internal consistency, high stability for trait anxiety, and adequate validity (Spielberger et al., 1973).
As a measure of body size dissatisfaction (BSD), children discriminated actual from ideal body size among eight silhouettes (Johnson & Rohan, 2002), which have been widely used in the study of body image.
Parent Measures
The QEWP-P (Johnson et al., 1999) is identical to the adolescent version, but the questions are referenced to the child.
The Child Behavior Checklist (CBCL; Achenbach & Elderbrock, 1991), for ages 4–18 years old, is an empirically derived survey that parents complete on the frequency and intensity of behavioral and emotional problems exhibited by their child in the past 6 months. It is a well validated, general screen for child and adolescent psychopathology (Connor et al., 2003). T-scores are derived as age and gender-specific standardized scores for the child, based on the raw scores of responses by the parent.
Physical Measures
Measurement of height (measured three times to the nearest 1 mm) was performed using a stadiometer (Holtain, Crymmych, Wales) calibrated to the nearest 1 mm before each child’s height measurement. Weight to the nearest 0.1 kg was obtained using a calibrated digital scale (Scale-Tronix, Wheaton, IL). From these measurements, body mass index (BMI; kg/m2) was calculated. A z-score standardizing for age, gender, and race was used for BMI (BMI-SD; Frisancho, 1990). Parent height and weight were obtained by self-report.
Participants underwent a dual-energy X-ray absorptiometry (DXA) scan (Hologic QDR-2000 or QDR-4500A, Waltham, MA) in the pencil beam (QDR-2000) or fan beam (QDR-4500A) mode for determination of fat mass and body fat percentage. Findings from DXA fat mass measurements have demonstrated excellent reproducibility in children (>0.96, interassay coefficient of variation [CV] <6%; Figueroa-Colon, Mayo, Treuth, Aldridge, & Weinsier, 1998). A growing body of evidence indicates that DXA is an accurate method of quantifying fatness in small animals (Pintauro, Nagy, Duthie, & Goran, 1996), children (Brunton, Bayley, & Atkinson, 1993; Chan, Pun, & Cheng, 1992; Ellis, Shypailo, Pratt, & Pond, 1994), and obese adults (Hicks et al., 1993).
Children also underwent a physical examination by a pediatric endocrinologist or a trained pediatric nurse practitioner. Pubertal breast and pubic hair stages of development for males and females were assigned through physical examination to one of the five Tanner standards (Marshall & Tanner, 1969, 1970). In addition, testicular volume (in cubic centimeters) for males was assessed using an orchidometer. Pubertal stage and testicular volume reflect neurocognitive and physical maturity (Marshall, & Tanner, 1969, 1970).
Finally, subjects underwent a left hand and wrist roentgenogram to measure bone age, an index of bone maturity (Greulich & Pyle, 1959).
Analyses
Psychological tests were scored according to their manuals. The Pearson chi-square test was used to assess the concordance of eating episodes generated by the QEWP-A and QEWP-P. Partial correlations, controlling for race and gender, were used to compare responses to questions on the QEWP-A and QEWP-P that assessed feelings about overeating and importance of shape and weight with regard to self-evaluation. Comparisons among groups (NE, OE, and BE), based on responses from the QEWP-A and QEWP-P separately, were performed using one-way analysis of covariance (1 × 3 ANCOVAs) with a Bonferroni-Hochberg correction, a conservative test accounting for multiple comparisons, applied to each family of post-hoc tests. To determine relevant covariates for the ANCOVA analyses, we entered age, bone age, socioeconomic status (SES), pubertal stage, race, and gender into each full model and removed the covariates that were not significant. For the QEWP-A analyses, age was used as a covariate in analyses of trait anxiety, CDI Total, Interpersonal, and Anhedonia scores, and BMI-SD. Bone age was covaried in analyses including the CBCL Internalizing t score, BMI-SD, and DXA fat mass. SES was controlled for in CDI Negative Self-Esteem analyses. Race was a significant term in analyses including trait anxiety, and CDI Negative Mood score, and gender was controlled for when analyzing BSD and DXA fat mass. For the QEWP-P analyses, age was used as a covariate in analyses including trait anxiety, CDI Anhedonia, and BMI-SD. Bone age was accounted for in analyses including BMI-SD and DXA fat mass. Race was covaried when analyzing trait anxiety and CDI Negative Mood scores. SES was a significant term in the analysis of CDI Negative Self-Esteem. Race was controlled for in analyses including trait anxiety and CDI Negative Mood and gender was also significant in the analyses of BSD and DXA fat mass.
Means ± SD are reported and nominal p values are shown, unless otherwise indicated. Differences and associations between groups were considered significant when ps ≤ .05. DXA body fat mass was log transformed so that these data approximated a normal distribution. The receiver operating characteristics (Swets, 1988) of the QEWP-P for the diagnosis of OE and BE (determined by QEWP-A responses) were also determined. Sensitivity and specificity were then calculated for each diagnosis (McNeil, Keeler, & Adelstein, 1975).
RESULTS
Two hundred sixty-three children and parents completed the QEWP-A and QEWP-P, respectively (Table 1). Compared with Caucasians, African American children had significantly lower SES (t = 5.6, p < .001) and African American girls were significantly more advanced in breast Tanner staging than Caucasian girls (t = 2.8, p < .01). Female children were significantly more advanced in terms of puberty (t = −7.4, p < .001) and had higher total percent fat as measured by DXA (−2.6, p = .01) compared with boys. No other descriptive variable differed by race or gender.
Comparison of QEWP-A and QEWP-P Responses
Based on DSM-IV criteria (APA, 1994), child reports identified 4 children who met subclinical BED (i.e., DSM-IV binge frequency criteria were met but there was insufficient associated distress to make a diagnosis of BED). Child reports of eating disorders did not differ by race. However, all 4 children diagnosed with subclinical BED were male. Based on parent report, 25 children met subclinical or full-criteria BED. Children identified with an eating disorder by the QEWP-P did not differ by race or gender. The QEWP-A and QEWP-P were not in agreement regarding the diagnosis of BED or subclinical BED for any child.
Responses from the QEWP-A classified 76.8% (n = 202) of participants as having NE, 15.6% (n = 41) of participants as having OE, and 7.6% (n = 20) as having BE. In contrast, by QEWP-P report, 65.4% (n = 172) of participants had NE, 19.0% (n = 50) engaged in OE, and 15.6% (n = 41) had BE (Table 2, Fig. 1). Type of eating episodes, as reported by both children and parents, did not differ by race or gender. With regard to compensatory behaviors, frequencies were somewhat higher in child reports than in hose of their parents (Fig. 2), that is, 1.5% (n = 4) of children compared with none of the parents reported child self-induced vomiting after OE. Fasting as a method of weight control was reported by 8.0% (n = 21) of children versus 1.1% (n = 3) of parents. 8.4% (n = 22) of children reported taking laxatives or diuretics compared with 0.4% (n = 1) of parent reports and 1.1% (n = 3) of children reported the use of diet pills compared with 0.4% (n = 1) of parents. Finally, exercising for more than 1 hr for the purpose of weight control was reported by 11.8% (n = 31) of children compared with 2.3% (n = 6) of parents. Neither child nor parent report of compensatory behaviors differed by gender. However, significantly more African American children reported using medicine (diet pills, laxatives, or diuretics; n = 17 vs. n = 5; χ2 = 15.56; p < .001) or fasting (n = 14 vs. n = 7; χ2 = 8.29; p < .05) as compensatory behavior compared with Caucasian children. Furthermore, all 6 parents reporting that their child engaged in excessive exercise were African American. Responses from the QEWP-A and QEWP-P were not concordant on any reports of compensatory behavior, except for excessive exercise where 4 parents and children were in agreement.
Table 2.
Agreement between children’s eating disordered behaviors reported by children (QEWP-A) and by their parents (QEWP-P)
| QEWP-P |
||||
|---|---|---|---|---|
| Characteristics | No Episode | Overeating | Binge Eating | Total |
| QEWP-A | ||||
| No episode | 53.2% (n = 140) | 11.8% (n = 31) | 11.8% (n = 31) | 76.8% (n = 202) |
| Overeating | 9.5% (n = 25) | 3.8% (n = 10) | 2.3% (n = 6) | 15.6% (n = 41) |
| Binge eating | 2.7% (n = 7) | 3.4% (n = 9) | 1.5% (n = 4) | 7.6% (n = 20) |
| Total | 65.4% (n = 172) | 19.0% (n = 50) | 15.6% (n = 41) | 100% (n = 263) |
Note: QEWP-A = Questionnaire on Eating and Weight Patterns-Adolescent; QEWP-P = Questionnaire on Eating and Weight Patterns-Parent.
Figure 1.
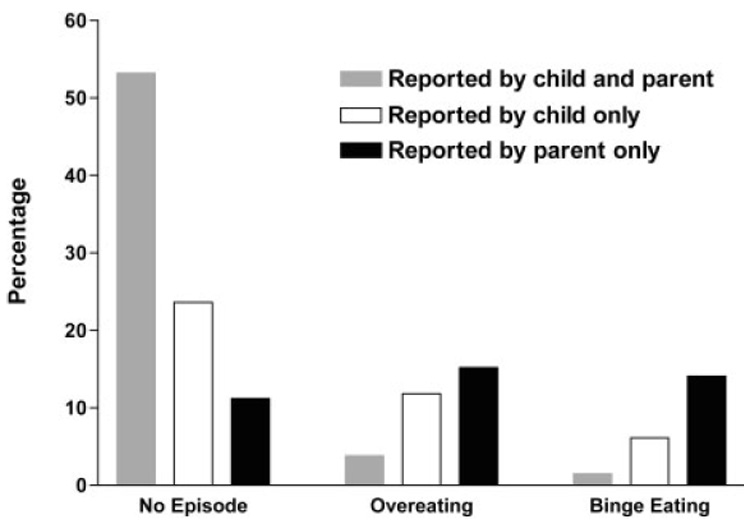
Percentage of subjects with reports of no abnormal eating episodes, simple overeating episodes, or binge eating episodes. Grey bars indicate children with concordant reports from children and their parents; open bars indicate children for whom only the child reported the behavior; black bars indicate children for whom only the parent reported the behavior. Percentages do not add up to 100 percent.
Figure 2.

Percentage of subjects with reports of no abnormal compensatory behaviors, vomiting, fasting, laxative or diuretic use, diet pill use, or intense exercise to control body weight. Grey bars indicate children with concordant reports from children and their parents; open bars indicate children for whom only the child reported the behavior; black bars indicate children for whom only the parent reported the behavior.
The presence and type of eating episodes identified by the QEWP-A and the QEWP-P were not concordant (χ2 = 12.85; p = .01; Table 2). Although the two measures detected relatively similar numbers of children endorsing OE (QEWP-A: n = 41; QEWP-P: n = 50), only 10 participants (3.8%) were found to engage in OE by both the QEWP-A and the QEWP-P. Of the 20 children engaging in BE as detected by the QEWP-A and the 41 identified as having BE by the QEWP-P, the two methods delineated only 4 children (1.5%) in common. Using the QEWP-A as the criterion method, the QEWP-P had 24% sensitivity and 82% specificity for the diagnosis of OE and 20% sensitivity and 80% specificity for the diagnosis of BE. When only the overweight children were evaluated (n = 142), the measures appeared to be in better agreement for the entire group in that the chi-square value was no longer statistically significant (χ2 = 4.365; p =.359). The measures were in agreement only 4.2% (n = 6) for OEs and 2.8% (n = 4) with regard to BE episodes. The QEWP-A and QEWP-P were not concordant when the normal weight children (n = 121) only were examined (χ2 = 18.046; p = .001). When separately examining only the African American, Caucasian, male, or female children, findings did not change.
The positive predictive values (PPV) of the QEWP-P for identification of episodes by the QEWP-A were as follows: for the detection of NE, the PPV of the QEWP-P was .69; for an OE, the PPV was .18; and for a BE, the PPV of the QEWP-P was .10.
Parent and child reports were significantly related for questions asking whether their child felt badly after eating more food than was best for them (r = .26; p < .001) and whether their body weight and shape were important in how they feel about themselves (r = .19; p = .01) after controlling for race and gender. No other responses from the QEWP-A and QEWP-P were significantly associated.
Associations between QEWP-A or QEWP-P–Defined Groups and Other Psychological Measures
When examining the psychological and physical variables based on child-reported eating behavior, no significant relationships were found (Table 3). This finding was consistent when only the African American, Caucasian, male, and female children were analyzed separately. However, based on QEWP-P responses, those engaging in BE had significantly higher BSD scores than participants classified in the OE group, which was still greater than those in the NE group (Table 4). In addition, by the QEWP-P, BE participants had significantly higher BMI-SD, DXA fat mass, and ChEAT scores than participants classified in the NE and OE groups (Table 4). The BE group identified by the QEWP-P also had significantly higher trait anxiety scores than NE children (Table 4). Those in the OE and BE categories according to the QEWP-P had significantly higher CDI Negative Self-Esteem and CBCL Internalizing, Externalizing, and Total t scores than those classified with NE. When examining only African American children, QEWP-P eating categories no longer differed on the ChEAT and CDI Negative Self-Esteem scales. For Caucasian children only, findings remained the same as for the entire sample. When including only parents of boys, differences on the CDI Negative Self-Esteem were no longer detected. Finally, when only examining QEWP-P responses for girls, differences on the trait anxiety scale were no longer significant.
Table 3.
Eating behavior categorized according to the QEWP-A
| NE (n = 202) M (SD) | OE (n = 41) M (SD) | BE (n = 20) M (SD) | F (df) | |
|---|---|---|---|---|
| Psychological measures | ||||
| ChEAT Score | 7.4 (6.1) | 7.4 (4.3) | 9.0 (5.2) | 0.5 (2,216) |
| Children’s Depression Inventory | ||||
| Total | 5.9 (6.2) | 7.7 (14.0) | 7.6 (19.4) | 2.2 (2,246) |
| Negative Mood | 1.2 (1.7) | 1.7 (3.8) | 1.8 (5.2) | 2.1 (2,246) |
| Interpersonal | 0.6 (1.2) | 0.9 (2.7) | 0.6 (3.7) | 1.3 (2,246) |
| Problems | ||||
| Ineffectiveness | 0.8 (1.3) | 1.2 (1.2) | 1.3 (1.5) | 2.1 (2,247) |
| Anhedonia | 2.5 (2.6) | 3.1 (6.0) | 3.5 (8.3) | 2.2 (2,246) |
| Negative Self-Esteem | 0.8 (1.3) | 0.8 (2.8) | 1.1 (4.3) | 0.5 (2,215) |
| State Trait Anxiety Inventory for Children | ||||
| Trait Anxiety | 33.4 (8.1) | 35.6 (18.0) | 35.9 (26.2) | 2.4 (2,258) |
| Silhouettes | ||||
| Body size | 0.9 (1.7) | 0.7 (3.8) | 0.7 (5.5) | 0.3 (2,255) |
| Dissatisfaction | ||||
| Child Behavior Checklist T-score | ||||
| Internalizing | 50.0 (11.3) | 50.4 (11.3) | 51.5 (11.8) | 0.5 (2,252) |
| Externalizing | 47.6 (10.2) | 51.8 (10.8) | 49.8 (11.7) | 2.8 (2,253) |
| Total | 49.0 (11.7) | 52.4 (11.6) | 51.7 (13.3) | 1.7 (2,253) |
| Physical measures | ||||
| BMI-SD | 1.7 (2.3) | 1.7 (5.0) | 1.8 (7.3) | 0.0 (2,258) |
| DXA fat mass (kg) | 11.7 (2.0) | 11.4 (4.7) | 11.6 (9.3) | 0.0 (2,248) |
Note: Psychological and physical variables by QEWP-A eating behavior. No significant findings. Analyses for ChEAT, CDI, STAIC, silhouettes, CBCL, BMI-SD, DXA fat mass, include age, bone age, race, socioeconomic status, gender, and pubertal stage as covariates. QEWP-A = Questionnaire on Eating and Weight Patterns-Adolescent; NE = no episodes of disordered eating; OE = overeating; BE = binge eating; ChEAT = Children’s Eating Attitudes Test; CDI = Children’s Depression Inventory; STAIC = State-Trait Anxiety Inventory for Children; CBCL = Child Behavior Checklist; BMI-SD = body mass index standard deviation score; DXA = dualenergy X-ray absorptiometry.
Table 4.
Eating behavior categorized according to QEWP-P
| NE (n = 172) M (SD) | OE (n = 50) M (SD) | BE (n = 41) M (SD) | F (df) | |
|---|---|---|---|---|
| Psychological measures | ||||
| ChEAT Score | 6.5 (4.7)a | 8.0 (6.4)a | 10.5 (7.4)b | 8.2*** (2,216) |
| CDI | ||||
| Total | 5.7 (5.3) | 7.4 (6.4) | 7.3 (5.5) | 2.5 (2,247) |
| Negative Mood | 1.3 (1.9) | 1.3 (3.4) | 1.4 (3.7) | 0.8 (2,246) |
| Interpersonal | 0.5 (0.9) | 0.8 (1.3) | 0.7 (1.2) | 1.4 (2,247) |
| Problems | ||||
| Ineffectiveness | 0.8 (1.1) | 1.2 (1.6) | 1.1 (1.2) | 2.3 (2,247) |
| Anhedonia | 2.4 (2.9) | 3.1 (5.2) | 3.0 (5.7) | 2.2 (2,246) |
| Negative Self-Esteem | 0.6 (1.4)a | 1.1 (2.5)b | 1.2 (2.6)b | 6.0** (2,215) |
| STAIC | ||||
| Trait Anxiety | 33.1 (8.8)a | 35.3 (16.3)ab | 35.6 (18.0)b | 3.3* (2,258) |
| Silhouettes | ||||
| Body Size | 0.5 (1.7)a | 1.1 (3.2)b | 2.2 (3.6)c | 25.0*** (2,255) |
| Dissatisfaction | ||||
| CBCL T-score | ||||
| Internalizing | 48.4 (11.0)a | 49.5 (9.9)a | 58.4 (10.7)b | 14.2*** (2,253) |
| Externalizing | 46.5 (10.1)a | 50.7 (10.6)b | 53.5 (10.0)b | 9.1*** (2,253) |
| Total | 47.3 (11.8)a | 50.7 (10.3)b | 58.8 (8.8)b | 17.6*** (2,253) |
| Physical measures | ||||
| BMI-SD | 1.3 (2.4)a | 1.8 (4.3)a | 3.2 (5.0)b | 14.5*** (2,258) |
| DXA fat mass (kg) | 10.4 (2.0)a | 11.7 (3.7)b | 18.6 (4.3)c | 16.1*** (2,248) |
Note: Psychological and physical variables by QEWP-P eating behavior.
p < .05.
p < .01.
p < .001.
Analyses for ChEAT, CDI, STAIC, silhouettes, CBCL, BMI-SD, DXA fat mass, include age, bone age, race, socioeconomic status, gender, and pubertal stage as covariates. QEWP-P = Questionnaire on Eating and Weight Patterns-Parent; NE = no episodes of disordered eating; OE = overeating; BE = binge eating; ChEAT = Children’s Eating Attitudes Test; CDI = Children’s Depression Inventory; STAIC = State-Trait Anxiety Inventory for Children; CBCL = Child Behavior Checklist; BMI-SD = body mass index standard deviation score; DXA = dual-energy X-ray absorptiometry.
To determine whether weight status accounted for our findings, we analyzed normal weight and overweight children separately. For the normal weight and overweight children, findings remained the same based on the QEWP-A responses in that no significant differences were detected. On the QEWP-P, for the normal weight children only, BMI-SD, DXA fat mass, ChEAT responses, and CBCL Internalizing and Total t scores no longer differed by parent reports of their children’s eating. However, the parent-identified BE group continued to have higher BSD (p < .01) than the NE or OE groups. Furthermore, the CBCL Externalizing t score (p = .001), as well as the CDI Interpersonal Problems (p < .05) and Ineffectiveness (p < .01) subscales all differed in that OE had significantly higher scores than NE. For overweight children only, QEWP-P findings remained the same with the exception of the Externalizing t-score, which was no longer significantly different among groups.
DISCUSSION
Comparing child reports with parent reports in the assessment of eating-disordered behaviors of normal weight and overweight non–treatment-seeking children, we found that the QEWP-A and QEWP-P did not concur on the presence or type of eating episodes engaged in by the children in our sample. Although parents reported that their children engaged in binge eating more often than their children reported binge eating themselves, the children reported that they engaged in compensatory behaviors more frequently than their parents’ reports would indicate.
Our finding that the QEWP-A and QEWP-P did not demonstrate better agreement was as hypothesized, and supports the previous findings of Johnson et al. (2001) in adolescents. These results also support research in other areas that have demonstrated poor concordance between child and parent reports of child behavior (Briggs-Gowan, Carter, & Schwab-Stone, 1996; Grills & Ollendick, 2003). For example, in a study comparing mothers’ and their daughters’ reports, mothers described significantly more child behavior problems than did their children. The discrepancies were most marked for those mother-daughter dyads where the mother reported maternal affective symptomatology (Briggs-Gowan et al., 1996). Such findings tend to cast doubt on the value of parent reports, because parents neither have access to all actions taken by their children nor view their children’s behavior without bias. There are also limitations of child reports. Particularly when difficult concepts are studied using questionnaire methods, children may fail to comprehend what is asked. Given the feelings of shame, secrecy, and the sense of escapism described during episodes of binge eating (Wilfley, Schwartz, Spurrell, & Fairburn, 1997), individuals experiencing eating-disordered behavior may find it difficult to admit to and describe their disturbance on self-report questionnaires. Furthermore, escape theory suggests that when an individual engages in binge eating, a cognitive shift to a state of low self-awareness may take place, making recall of the behavior difficult, because it may have occurred somewhat outside of one’s cognizance (Heatherton & Baumeister, 1991). Given the limitations of both child and parent reports, it remains unclear how child and parent measures such as the QEWP-A and QEWP-P should be combined to obtain the clearest view of children’s eating behaviors, particularly because the results of questionnaires such as the QEWP-A are not fully concordant with interview-based assessments (Tanofsky-Kraff et al., 2003).
Child-reported eating behaviors from the QEWP-A were unrelated to physical measures of body adiposity or to psychological measures commonly associated with obesity, whereas parent reports of binge eating episodes from the QEWP-P were related to several variables, including body fat mass, ChEAT scores, BSD, CBCL Internalizing, CBCL Externalizing, and CBCL Total scores. It is possible that parents of overweight children ascribe BE and adverse psychological features to their children as an explanation for their greater adiposity. Alternatively, parents of individuals in middle childhood may have greater insight into their children’s experiences based on their own observations, information from teachers and other adults who supervise their children, or from a family history of eating disturbance. Thus, parent report may prove to be a better measurement of child eating behavior than child self-report.
The strengths of the current study include the large size and representative nature of the sample, and the use of non–treatment-seeking, healthy children as participants. Care was also taken to ensure that children and their parents completed the QEWP questionnaires contemporaneously but independently. However, because the sample was non-treatment seeking, there was a low prevalence of eating-disordered behavior among the children. As a result, there was good concordance for the absence of eating-disordered behaviors by child and parent reports.
In summary, for children 6–12 years old, we found that child self-reports of eating and compensatory behaviors are not equivalent to their parents’ reports. Although the QEWP-A and QEWP-P are frequently concordant when no abnormal eating behaviors are described, they show little overlap when either questionnaire suggests the presence of an abnormal eating or compensatory behavior. Further investigation of the utility of these questionnaires is needed before either can be employed as a surrogate for clinical interviews.
Acknowledgments
Supported by Z01-HD-00641 (JAY) and the National Center for Minority Health and Health Disparities. Dr. Yanovski is a commissioned officer in the United States Public Health Service, DHHS.
Footnotes
Emily Steinberg and Marian Tanofsky-Kraff contributed equally to this work.
†This article is a U.S. Government work and, as such, is in the public domain in the United States of America.
REFERENCES
- Achenbach TM, Elderbrock C. Manual for the Child Behavior Checklist and Revised Child Behavior Profile. Burlington: University of Vermont; 1991. [Google Scholar]
- American Psychiatric Association. Diagnostic and statistical manual of mental disorders. 4th ed. Washington, DC: Author; 1994. [Google Scholar]
- Antony MM, Johnson WG, Carr-Nangle RE, Abel JL. Psychopathology correlates of binge eating and binge eating disorder. Comprehensive Psychiatry. 1994;35:386–392. doi: 10.1016/0010-440x(94)90280-1. [DOI] [PubMed] [Google Scholar]
- Briggs-Gowan MJ, Carter AS, Schwab-Stone M. Discrepancies among mother, child, and teacher reports: Examining the contributions of maternal depression and anxiety. Journal of Abnormal Child Psychology. 1996;24:749–765. doi: 10.1007/BF01664738. [DOI] [PubMed] [Google Scholar]
- Brunton JA, Bayley HS, Atkinson SA. Validation and application of dual-energy x-ray absorptiometry to measure bone mass and body composition in small infants. American Journal of Clinical Nutrition. 1993;58:839–845. doi: 10.1093/ajcn/58.6.839. [DOI] [PubMed] [Google Scholar]
- Chan TM, Pun KK, Cheng IK. Total and regional bone densities in dialysis patients. Nephrology Dialysis Transplant. 1992;7:835–839. [PubMed] [Google Scholar]
- Connor DF, Edwards G, Fletcher KE, Baird J, Barkley RA, Steingard RJ. Correlates of comorbid psychopathology in children with ADHD. Journal of the American Academy of Child and Adolescent Psychiatry. 2003;42:193–200. doi: 10.1097/00004583-200302000-00013. [DOI] [PubMed] [Google Scholar]
- Costello EJ, Angold A. Scales to assess child and adolescent depression: Checklists, screens, and nets. Journal of the American Academy of Child and Adolescent Psychiatry. 1988;27:726–737. doi: 10.1097/00004583-198811000-00011. [DOI] [PubMed] [Google Scholar]
- Decaluwe V, Braet C. Prevalence of binge-eating disorder in obese children and adolescents seeking weight-loss treatment. International Journal of Obesity and Related Metabolic Disorders. 2003;27:404–409. doi: 10.1038/sj.ijo.0802233. [DOI] [PubMed] [Google Scholar]
- Decaluwe V, Braet C, Fairburn CG. Binge eating in obese children and adolescents. International Journal of Eating Disorders. 2003;33:78–84. doi: 10.1002/eat.10110. [DOI] [PubMed] [Google Scholar]
- Ellis KJ, Shypailo RJ, Pratt JA, Pond WG. Accuracy of dual-energy x-ray absorptiometry for body-composition measurements in children. American Journal of Clinical Nutrition. 1994;60:660–665. doi: 10.1093/ajcn/60.5.660. [DOI] [PubMed] [Google Scholar]
- Figueroa-Colon R, Mayo MS, Treuth MS, Aldridge RA, Weinsier RL. Reproducibility of dual-energy X-ray absorptiometry measurements in prepubertal girls. Obesity Research. 1998;6:262–267. doi: 10.1002/j.1550-8528.1998.tb00348.x. [DOI] [PubMed] [Google Scholar]
- Frisancho A. Anthropometric standards for the assessment of growth and nutritional status. Ann Arbor: The University of Michigan Press; 1990. [Google Scholar]
- Garner DM, Olmsted MP, Bohr Y, Garfinkel PE. The Eating Attitudes Test: Psychometric features and clinical correlates. Psychological Medicine. 1982;12:871–878. doi: 10.1017/s0033291700049163. [DOI] [PubMed] [Google Scholar]
- Greulich WW, Pyle SI. Radiographic atlas of skeletal development of the hand and wrist. Stanford, CA: Stanford University Press; 1959. [Google Scholar]
- Grills AE, Ollendick TH. Multiple informant agreement and the anxiety disorders interview schedule for parents and children. Journal of the American Academy of Child and Adolescent Psychiatry. 2003;42:30–40. doi: 10.1097/00004583-200301000-00008. [DOI] [PubMed] [Google Scholar]
- Heatherton TF, Baumeister RF. Binge eating as escape from self-awareness. Psychological Bulletin. 1991;110:86–108. doi: 10.1037/0033-2909.110.1.86. [DOI] [PubMed] [Google Scholar]
- Hicks VL, Heyward VH, Baumgartner RN, Flores AJ, Stolarczyk LM, Wotruba EA. Body composition of Native-American women estimated by dual-energy X-ray absorptiometry and hydrodensitometry. Basic Life Sciences. 1993;60:89–92. doi: 10.1007/978-1-4899-1268-8_20. [DOI] [PubMed] [Google Scholar]
- Johnson WG, Grieve FG, Adams CD, Sandy J. Measuring binge eating in adolescents: Adolescent and parent versions of the Questionnaire of Eating and Weight Patterns. International Journal of Eating Disorders. 1999;26:301–314. doi: 10.1002/(sici)1098-108x(199911)26:3<301::aid-eat8>3.0.co;2-m. [DOI] [PubMed] [Google Scholar]
- Johnson WG, Kirk AA, Reed AE. Adolescent version of the Questionnaire of Eating and Weight Patterns: Reliability and gender differences. International Journal of Eating Disorders. 2001;29:94–96. doi: 10.1002/1098-108x(200101)29:1<94::aid-eat16>3.0.co;2-8. [DOI] [PubMed] [Google Scholar]
- Johnson WG, Rohan KJ. The development of binge eating in children and adolescents. Eating Behaviors. 2002;3:179–189. doi: 10.1016/s1471-0153(01)00057-5. [DOI] [PubMed] [Google Scholar]
- Kovacs M, Beck AT. The wish to die and the wish to live in attempted suicides. Journal of Clinical Psychology. 1977;33:361–365. doi: 10.1002/1097-4679(197704)33:2<361::aid-jclp2270330207>3.0.co;2-h. [DOI] [PubMed] [Google Scholar]
- Maloney MJ, McGuire J, Daniels SR, Specker B. Dieting behavior and eating attitudes in children. Pediatrics. 1989;84:482–489. [PubMed] [Google Scholar]
- Marshall WA, Tanner JM. Variations in pattern of pubertal changes in girls. Archives of Disorders of Childhood. 1969;44:291–293. doi: 10.1136/adc.44.235.291. [DOI] [PMC free article] [PubMed] [Google Scholar]
- Marshall WA, Tanner JM. Variations in pattern of pubertal changes in boys. Archives of Disorders of Childhood. 1970;45:13–23. doi: 10.1136/adc.45.239.13. [DOI] [PMC free article] [PubMed] [Google Scholar]
- McNeil BJ, Keeler E, Adelstein SJ. Primer on certain elements of medical decision making. New England Journal of Medicine. 1975;293:211–215. doi: 10.1056/NEJM197507312930501. [DOI] [PubMed] [Google Scholar]
- Morgan CM, Yanovski SZ, Nguyen TT, McDuffie J, Sebring NG, Jorge MR, Keil M, Yanovski JA. Loss of control over eating, adiposity, and psychopathology in overweight children. International Journal of Eating Disorders. 2002;31:430–441. doi: 10.1002/eat.10038. [DOI] [PMC free article] [PubMed] [Google Scholar]
- Pintauro SJ, Nagy TR, Duthie CM, Goran MI. Cross-calibration of fat and lean measurements by dual-energy X-ray absorptiometry to pig carcass analysis in the pediatric body weight range. American Journal of Clinical Nutrition. 1996;63:293–298. doi: 10.1093/ajcn/63.3.293. [DOI] [PubMed] [Google Scholar]
- Smolak L, Levine MP. Psychometric properties of the Children’s Eating Attitudes Test. International Journal of Eating Disorders. 1994;16:275–282. doi: 10.1002/1098-108x(199411)16:3<275::aid-eat2260160308>3.0.co;2-u. [DOI] [PubMed] [Google Scholar]
- Spielberger CD, Edwards CD, Lushene RE, Montouri J, Platzek D. STAIC preliminary manual. Palo Alto, CA: Consulting Psychologist Press; 1973. [Google Scholar]
- Spitzer RL, Yanovski S, Wadden T, Wing R, Marcus MD, Stunkard A, Devlin M, Mitchell J, Hosin D, Horne RL. Binge eating disorder: Its further validation in a multisite study. International Journal of Eating Disorders. 1993;13:137–153. [PubMed] [Google Scholar]
- Swets JA. Measuring the accuracy of diagnostic systems. Science. 1988;240:1285–1293. doi: 10.1126/science.3287615. [DOI] [PubMed] [Google Scholar]
- Tanofsky-Kraff M, Morgan CM, Yanovski SZ, Marmarosh C, Wilfley DE, Yanovski JA. Comparison of assessments of children’s eating-disordered behaviors by interview and questionnaire. International Journal of Eating Disorders. 2003;33:213–224. doi: 10.1002/eat.10128. [DOI] [PubMed] [Google Scholar]
- Wilfley DE, Schwartz MB, Spurrell EB, Fairburn CG. Assessing the specific psychopathology of binge eating disorder patients: Interview or self-report? Behavior Research and Therapy. 1997;35:1151–1159. [PubMed] [Google Scholar]