Abstract
We have characterized the BRCA1 gene product by using four polyclonal antibodies raised against peptides from four different regions of the protein. The antibodies specifically recognize an ≈220-kDa BRCA1 protein that is predominantly expressed in the nucleus of both normal and neoplastic breast cancer cells. It is a serine phosphoprotein that undergoes hyperphosphorylation during late G1 and S phases of the cell cycle and is transiently dephosphorylated early after M phase. We propose that BRCA1 is a phosphoprotein that alters in a qualitative and quantitative manner during cell cycle progression.
Keywords: breast cancer/tumor suppressor/phosphorylation
Breast cancer is one of the most common malignancies affecting women and is diagnosed in approximately 180,000 women each year in the United States. About 5–10% of all cases are estimated to be familial. Susceptibility to early-onset breast and ovarian cancer is conferred by mutations in a gene on chromosome 17q21 (1, 2). This gene, termed BRCA1 (breast cancer gene 1), has been identified by positional cloning (3). Mutations in the BRCA1 gene account for about 50% of inherited breast cancer cases and 80% of families predisposed to both breast and ovarian cancer (4). However, very few mutations in the BRCA1 gene were found in sporadic breast and ovarian cancers (5–8). Instead, alterations in BRCA1 gene expression might lead to sporadic breast cancers (9). Alternatively, BRCA1 protein may be aberrantly localized in sporadic breast cancers. Thus, an associated protein(s) responsible for proper subcellular location of BRCA1 may be mutated in these sporadic forms (10).
The BRCA1 gene is expressed as a 7.8-kb mRNA transcript in several organs, including breast and ovary. The gene encodes a protein of 1,863 amino acids (3). The protein contains a RING domain at its N terminus and putative nuclear localization signals in the central portion (3, 10–13). A RING protein has been identified that interacts in vivo with the N terminus of BRCA1 (14). Conflicting data exist about the subcellular localization of BRCA1; one group suggests that the protein is nuclear in most cell types but cytoplasmic in breast and ovarian cancer cells (10, 11, 15), whereas another group has shown BRCA1 to be localized exclusively in the nucleus of these cells (16). In contrast, another group proposed that BRCA1 is a secreted protein in breast cells (17). These conflicting results may be due to differences in antibody specificity and methods applied to determine the subcellular location of BRCA1 (15, 16, 18).
To examine the properties of BRCA1 protein, we have prepared polyclonal antibodies that specifically recognize BRCA1 protein. These antibodies were used to determine the location of BRCA1 in subcellular fractions by immunoblotting. We report that BRCA1 is predominantly nuclear in both normal and tumor cells. We further show that the mobility of BRCA1 in SDS/polyacrylamide gels changes in a cell cycle-dependent fashion, reflecting changes in the phosphorylation state.
MATERIALS AND METHODS
Generation of BRCA1-Specific Antibodies.
The resin-bound BRCA-1 peptides were synthesized utilizing a standard solid-phase peptide synthesis protocol. The peptides were coupled to the carrier keyhole limpet hemocyanin in the presence of glutaraldehyde and injected into rabbits to raise antisera (19). Antibodies were affinity purified from sera according to standard procedures.
Plasmid Constructions.
pCL-MFG-BRCA1 was constructed as follows: A NcoI site was generated by PCR to enclose the BRCA1 start codon. Full-length BRCA1 cDNA was lifted from this construct as a composite of a NcoI (partial digest)–ApaI and an ApaI–Ecl136II fragment and inserted into the NcoI-cut and EcoRI-cut/blunted pUHD-P1 plasmid. Finally, full-length BRCA1 cDNA was lifted from this construct as a NcoI (partial digest)–XbaI/blunted fragment and inserted into NcoI (partial digest)-cut and BamHI-cut/blunted pCL-MFG retroviral vector (20).
Cell Culture, in Vivo Labeling, and Transfection.
For synchronization in M phase, HeLa cells were treated with 0.1 μg/ml nocodazole (Calbiochem) for ≈15 h, and the nonadherent cells were rinsed off and washed twice with PBS before being replated in Dulbecco’s modified Eagle’s medium (DMEM; Mediatech, Washington, DC) + 10% FBS (Intergen, Purchase, NY). S-phase arrest was performed by treatment with 2 mM thymidine for 12 h, 0.24 μM thymidine/deoxycytidine for 9 h, and 5 μg/ml aphidicolin (Sigma) for 12 h, each time followed by three PBS washes, before fresh medium was added. HeLa cells were separated on the basis of size by centrifugal elutriation using a JE-6B elutriator rotor (Beckman) at constant rotor speed and increasing flow rate (21).
For labeling with [35S]methionine, 293T cells were washed twice with PBS and incubated in DMEM lacking cysteine and methionine and containing 10% dialyzed FBS (GIBCO/BRL) for ≈2 h at 37°C before [35S]methionine (DuPont/NEN) was added at ≈0.8 mCi/ml (1 mCi = 37 MBq). After overnight labeling, cells were washed twice with ice-cold PBS−−, scraped off from the plates, pelleted by centrifugation, and frozen. For 32P labeling, cells were washed twice in phosphate-free DMEM and incubated in phosphate-free DMEM containing 10% dialyzed FBS for 45 min at 37°C before 0.8 mCi/ml 32P (H3PO4; ICN Pharmaceuticals) was added. Cells were harvested after 4 h labeling.
Transfections of 293T cells were performed by the calcium phosphate method adapted from ref. 22. We usually obtained transfection efficiencies of 40–70%, as determined by β-galactosidase assays in duplicate plates that were transfected with a lacZ expression construct.
Western Blot Analysis.
Cells were lysed in 50 mM Hepes, pH 7.4/150 mM NaCl/10% (vol/vol) glycerol/1% Triton X-100/15 mM MgCl2/10 mM EGTA/1 μg/ml pepstatin A/100 mM NaF/10 mM Na4P2O7/1 mM Na3VO4/80 mM β-glycerophosphate/1 mM phenylmethanesulfonyl fluoride/10 μg/ml leupeptin/21 μg/ml aprotinin/1 mM dithiothreitol/10 mM Na2MoO4, and cell debris was removed by centrifugation at 12,000 rpm in a Sorvall Mc 12V centrifuge for 2 min at 4°C. Protein concentrations were determined with protein assay dye reagent (Bio-Rad). Equal amounts of protein per cell line were applied in each experiment. Proteins were electrophoresed through 5% or 6% polyacrylamide gels containing SDS and blotted to poly(vinylidene difluoride) (PVDF) membranes (Immobilon-P; Millipore). Membranes were blocked for 15 min in PBS containing 0.2% Tween 20 (PBST) and 5% dry milk. Primary and secondary (donkey anti-rabbit IgG horseradish peroxidase-linked whole antibody; Amersham) antibody reactions were performed in PBST/1% dry milk, and proteins were detected by Renaissance chemiluminescence reagent (DuPont). Equal protein loading in each cell cycle experiment was monitored by the signal intensities of crossreacting proteins that have a lower molecular mass than the ≈150-kDa protein species.
Immunoprecipitations and Bacterial Alkaline Phosphatase (BAP) Treatment.
Immunoprecipitations of in vivo overexpressed and endogenous proteins were performed in RIPA buffer (100 mM NaCl/20 mM Tris⋅HCl, pH 8.0/0.2% deoxycholic acid/0.2% Triton X-100/0.2% Nonidet P-40) containing 0.1% SDS overnight at 4°C, in the presence of staphylococcal protein A-Sepharose. Prior to precipitations, proteins were heated for 10 min at 100°C in RIPA buffer containing 0.5% SDS, and RIPA buffer was added to make a final concentration of 0.1% SDS. Proteinase and phosphatase inhibitors were added as indicated in the section above. After precipitation, beads were washed four times with RIPA containing 0.1% SDS, and proteins were eluted by heating for 10 min in SDS-loading buffer before SDS/PAGE. For precipitations of in vivo labeled proteins, cells were resuspended in RIPA buffer containing 0.5% SDS plus inhibitors and passed 10 times through a 25-gauge needle (Becton Dickinson). RNase A was added at a concentration of 100 μg/ml to precipitate 32P-labeled BRCA1. To BAP-treated BRCA1 in vitro, beads containing the immunoprecipitated protein were washed twice in RIPA containing 0.1% SDS and three times in BAP reaction buffer (100 mM Tris⋅HCl, pH 8.0/5 mM MgCl2) before incubating in BAP reaction buffer plus BAPF (Worthington) at a concentration of 0.5 mg/ml at 55°C for 20 min.
Peptide Maps and Phosphoamino Acid Analysis.
Two-dimensional TLC peptide and phosphoamino acid analyses were performed as described (23). Briefly, isolated proteins were either digested with trypsin (Worthington) or hydrolyzed with 6 M HCl at 110°C and then spotted onto TLC plates. Peptide maps were obtained by electrophoresis at pH 1.9 (horizontal) and then by chromatography at pH 8.9 (vertical). Phosphoamino acid maps were obtained by electrophoresis first at pH 1.9 (horizontal) and then at pH 3.5 (vertical).
Subcellular Fractionation.
Cytoplasmic and nuclear fractions were prepared in buffer A and C, respectively (24). Membrane fractions were prepared in 50 mM Tris⋅HCl, pH 8.0/1 mM EGTA/5 mM MgCl2/1 mM phenylmethanesulfonyl fluoride (PMSF) as described (25). Whole cell extracts were prepared in RIPA containing 10 mM Na2MoO4, 80 mM β-glycerophosphate, and 1 mM PMSF by passing cells 15 times through a 25-gauge needle before cell debris was removed by centrifugation. To all buffers, the following inhibitors were added: 1 μg/ml pepstatin A, 10 μg/ml leupeptin, 21 μg/ml aprotinin, 10 mM NaF, 10 mM Na4P2O7, and 1 mM Na3VO4.
FACS Analysis.
Trypsinized cells were resuspended in 0.5 ml of PBS−− (minus Ca2+ and Mg2+) and fixed by adding 7 ml of 95% ethanol. Fixed cells were washed twice with PBS−− and resuspended in 1 ml of PBS−− containing 1% FBS, 5 μg/ml propidium iodide (Molecular Probes), and 250 μg/ml RNase A and incubated at 37°C for 30 min. Fluorescence-activated cell sorting analysis was performed by FACScan (Becton Dickinson) and analyzed by the CellQuest program (Version 3.0.1f; Becton Dickinson), and cellular DNA contents were calculated by using the Multicycle program (Phoenix Flow Systems, San Diego). Unless indicated otherwise, 10,000 cells were analyzed in each sample.
RESULTS
Generation and Characterization of Anti-BRCA1 Antibodies.
To analyze the BRCA1 gene product in cultured human cells, we have generated polyclonal antibodies that are directed against four different synthetic peptides derived from the BRCA1 protein sequence (Fig. 1A). Epitopes are located N- and C-terminal to the RING domain [amino acids 2–20 (A) and 70–89 (B), respectively], within the central portion encoded by the large exon 11 [amino acids 768–793 (C)] and in the C terminus of the BRCA1 protein [amino acids 1847–1863 (D)]. Each of the four resulting antisera was tested against in vitro synthesized full-length BRCA1 protein. In all cases an ≈220-kDa protein corresponding to the predicted size of the BRCA1 gene product was immunoprecipitated and efficiently competed with the corresponding peptides against which antibodies were raised (data not shown). We transiently overexpressed BRCA1 in human embryonic kidney cells (293T) and showed that the ≈220-kDa protein is immunoprecipitated with the peptide antisera (Fig. 1 B and C). The endogenous ≈220-kDa protein in HeLa cells can also be identified (Fig. 1B, lanes 4 and 5).
Figure 1.
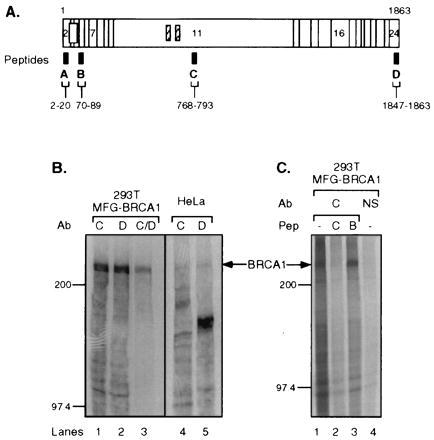
Characterization of BRCA1 antibodies. (A) Diagram showing BRCA1 epitopes against which antibodies were raised. The horizontal bar represents BRCA1 protein consisting of amino acids 1–1863; vertical lines indicate borders of coding exons, some of which are numbered. Open box, RING domain; hatched boxes, putative nuclear localization signals. Antibodies were raised against four different synthetic BRCA1 peptides that were derived from the BRCA1 protein sequence, as indicated by the black boxes (designated A–D). The corresponding amino acid numbers are indicated below. (B) Antibodies Ab-C and Ab-D immunoprecipitate in vivo overexpressed and endogenous BRCA1. The lysates from [35S]methionine-labeled 293T cells transfected with pCL-MFG-BRCA1 (MFG-BRCA1; lanes 1–3) or untransfected HeLa cells (lanes 4 and 5) were immunoprecipitated by the following antibodies: Ab-C, lanes 1 and 4; Ab-D, lanes 2 and 5; Ab-C and -D consecutively, lane 3. (C) BRCA1 protein was precipitated by Ab-C from overexpressing [35S]methionine-labeled 293T cells in the absence or presence of competitor peptide. Lane 1, no peptide added; lane 2, corresponding peptide Pep-C added; lane 3, noncorresponding peptide Pep-B added; lane 4, normal rabbit serum (NS) used for precipitation, no peptide added. Arrows indicate BRCA1 protein. Protein marker bands (200 and 97.4 kDa) are marked on the side.
To confirm that the ≈220-kDa in vitro translated protein, the overexpressed protein, and endogenous BRCA1 protein immunoprecipitated with the peptide antisera are related, we subjected them to a two-dimensional tryptic peptide analysis. Fig. 2 shows congruent peptide patterns in all three cases, thereby authenticating the specificity of the peptide antisera.
Figure 2.
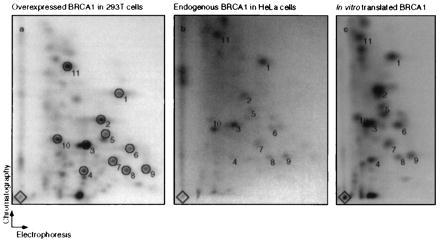
In vitro translated, immunoprecipitated endogenous, and overexpressed BRCA1 reveal the same tryptic peptide pattern. Shown are tryptic peptide maps of overexpressed BRCA1 in 293T cells (Left), endogenous BRCA1 from HeLa cells (Center), and in vitro translated BRCA1 (Right). Immunoprecipitations were performed using either Ab-C or Ab-D, and the precipitates were separated by SDS/PAGE (see Fig. 1B, lanes 1 and 2 and 4 and 5, respectively). BRCA1 from Ab-C and Ab-D precipitations was pooled for each cell type. Tryptic peptide analysis was performed on each pool. The diamonds mark sample origins. Circles (numbered 1–11) indicate common spots in the three maps. Comparable maps were also obtained for endogenous BRCA1 from pooled immunoprecipitates from 293T cells and for overexpressed BRCA1 from 293T cells analyzed after precipitation by either Ab-C or -D alone (data not shown).
Subcellular Localization of BRCA1.
Conflicting data have been presented regarding the subcellular location of BRCA1 (10, 15–18, 26, 27). To help provide a consensus on BRCA1 localization, we investigated its subcellular localization in several human cell lines, including cervix carcinoma (HeLa), “normal” breast (HBL-100) cells, and breast cancer cells (MDA-MB-468). Cells were fractionated into cytoplasmic, nuclear, and membrane extracts, and equal amounts of protein from each fraction were analyzed by immunoblotting. Using C-terminal-specific antisera (Ab-D), we detected the ≈220-kDa BRCA1 protein in the nucleus in MDA-MB-468, HBL-100, and HeLa cells (Fig. 3A). In all three cell types, BRCA1 was also detected in the cytoplasmic fractions, although at a lower level. Virtually the same result was obtained by probing with the N-terminal antibody (Ab-A; Fig. 3B). To validate the fractionation procedure, the blots were stripped and reprobed with antibodies against the cytoplasmic NFκB2 precursor protein (ref. 28; Fig. 3C) and the nuclear HIP protein (ref. 29; Fig. 3D). These proteins fractionated accordingly. Although the results indicate a greater amount of nuclear BRCA1, they do not reflect the relative amount of BRCA1 protein in the cytoplasm and nucleus on a per cell basis. Instead, the results represent the amount of BRCA1 per same amount of cytoplasmic or nuclear protein. All BRCA1 antibodies crossreacted with other proteins, but in a fashion unique for each antibody. Notably, the C-terminal Ab-D detected a protein species of ≈150 kDa that was predominantly found in membrane fractions (Fig. 3A). This protein could be the human epidermal growth factor receptor (EGFR) protein, since it has about the correct size for EGFR, and Ab-D is known to crossreact with EGFR and HER2 (30); see Discussion.
Figure 3.
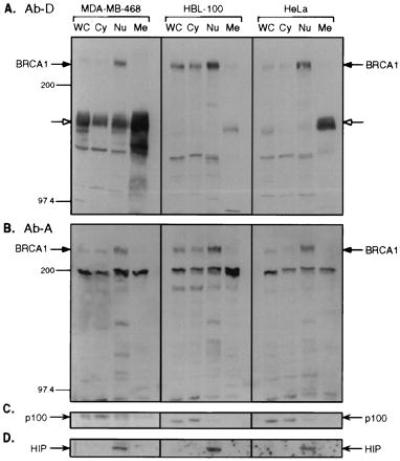
Subcellular localization of BRCA1. Human breast cancer cells (MDA-MB-468), “normal” breast cells (HBL-100), and cervical cancer cells (HeLa) were separated into cytoplasmic (Cy), nuclear (Nu), and membrane (Me) fractions. WC, whole cell extracts. Proteins were separated by SDS/PAGE and blotted to Immobilon-P membranes. Equal amounts of protein per cell line were loaded in each lane. Ab-D (A) and Ab-A (B) were used as primary antibodies for hybridizations. The filled arrows indicate BRCA1 protein. The open arrows indicate the position of the ≈150-kDa crossreacting protein(s). To inspect the fractionation procedure, immunoblotting was performed by using an antibody against NFκB p52 (Santa Cruz Biotechnology) detecting p100 (C) and by an antibody against HIP116 (D).
BRCA1 Is Phosphorylated on Serine.
It has been shown that BRCA1 is a phosphoprotein (10, 31). To determine the identity of the phosphorylated amino acids, a protein species of ≈220 kDa was precipitated by Ab-C in lysates from 32P-labeled HeLa cells and BRCA1-overexpressing 293T cells (Fig. 4A, lanes 1 and 2, respectively). We carried out phosphoamino acid analyses to determine the identity of the phosphorylated amino acids of BRCA1. As shown in Fig. 4B, BRCA1 is phosphorylated predominantly on serine and weakly on threonine residues. On prolonged autoradiographic exposures a weak tyrosine signal was also detected.
Figure 4.
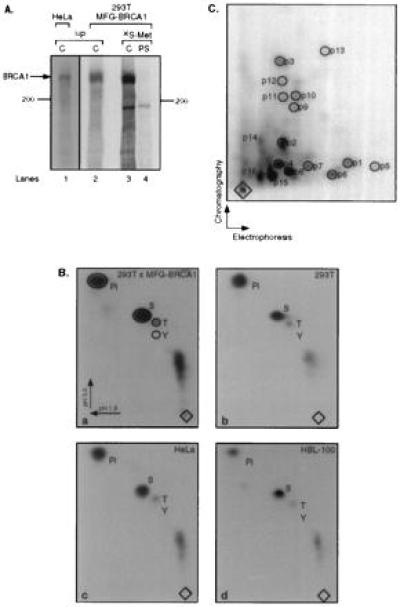
BRCA1 is a phosphoprotein. (A) Immunoprecipitation of overexpressed and endogenous BRCA1 from cells labeled with [32P]phosphoric acid. BRCA1 was precipitated from lysates of HeLa cells (lane 1) and overexpressing 293T cells (lane 2) by using Ab-C. For comparison, overexpressing 293T cells were labeled with [35S]methionine, and BRCA1 was precipitated by Ab-C (lane 3) or preimmune serum (PS, lane 4). (B) Phosphoamino acid analyses of BRCA1 protein labeled in vivo with [32P]phosphoric acid. BRCA1 was precipitated from the following cells: a, 293T cells overexpressing BRCA1; b, mock-transfected 293T cells; c, HeLa cells; d, HBL-100 cells [from nuclear extract; a similar result was obtained for BRCA1 precipitated from cytoplasmic extract (data not shown)]. Pi, orthophosphate; S, T, and Y, phosphoserine, phosphothreonine, and phosphotyrosine, respectively. Electrophoresis was performed in two dimensions, as indicated by the arrows. Diamonds, sample origins. (C) Tryptic phosphopeptide map of in vivo overexpressed BRCA1. A tryptic digestion was performed on BRCA1 precipitated from the lysate of overexpressing, [32P]phosphoric acid-labeled 293T cells. The resulting peptides were separated in the first and second dimension by electrophoresis and chromatography, respectively, as indicated by the arrows. Peptides p14–p16 probably represent partially digested fragments.
To determine the complexity of phosphorylation of BRCA1, we performed two-dimensional tryptic peptide analysis on the protein isolated from 32P-labeled 293T cells overexpressing BRCA1. As shown in Fig. 4C, at least 13 tryptic peptides (p1–p13) could be detected on two-dimensional peptide maps. Subsequently, the phosphoamino acid content of these individual peptides was determined to be solely phosphoserine (data not shown). We conclude that BRCA1 is multiply phosphorylated, mostly on serine residues.
Expression of BRCA1 Protein Is Modulated During the Cell Cycle.
BRCA1 has been postulated to be a tumor suppressor protein (3, 5). Because the tumor suppressors p53 and Rb have been shown to be involved in cell cycle regulation and themselves are subject to changes during cell cycle progression (32), we investigated if BRCA1 similarly undergoes cell cycle-specific changes. To investigate the characteristics of BRCA1 protein during G1 progression, lysates were prepared from synchronously growing HeLa cells that were harvested at different times after release from a nocodazole-induced M-phase block. Total proteins were isolated, separated by SDS/PAGE, and immunoblotted using Ab-D. Arrested cells contain a BRCA1 protein species that has a lower mobility than cells that are initially released from the block (Fig. 5A). The migration of BRCA1 is faster within the first 7.5 h past release before it starts to decrease (data not shown). The amount and the mobility of BRCA1 increases and decreases, respectively, during progression through G1 to S phase. This result indicates a qualitative and a quantitative change of the protein. The same result was obtained when Ab-C was used instead of Ab-D (data not shown). However, the ≈150-kDa protein(s) that also undergoes a change in electrophoretic mobility early after M block release (Fig. 5A, and data not shown) is detected only by the C-terminal antibody (Ab-D) and not by the Ab-C antisera.
Figure 5.
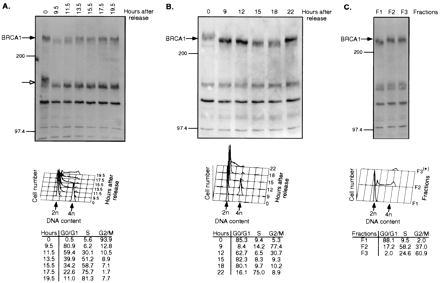
Cell cycle-specific changes of BRCA1. (A and B) Change of BRCA1 protein in HeLa cells following release of a nocodazole-induced M-phase block (A) and a thymidine–aphidicolin G1/S block (B). (C) HeLa cells were separated by centrifugal elutriation according to size. (Upper) Immunoblotting of proteins from cell lysates by Ab-D. Numbers above the panels denote hours after block release (A and B) or individual elutriated fractions (C). The bands representing BRCA1 protein (filled arrows) and the crossreacting ≈150-kDa species (open arrows) are indicated on the side. (Lower) Corresponding cellular DNA contents. The numbers in the tables represent the number of cells (in percentage) in G0/G1, S, and G2/M at different times after block release. *Due to limited number of cells, only 2,784 cells were analyzed by FACS for DNA content.
We next arrested HeLa cells in S phase by a thymidine–aphidicolin double block. After release from the block, BRCA1 was analyzed by immunoblotting using Ab-D. As shown in Fig. 5B, the mobility of BRCA1 is increased in early G1 phase compared with S and G2/M phases, again underscoring modification of BRCA1 during this phase. The amount of BRCA1 protein is highest during S phase and remains elevated toward G2/M, before it declines in early G1. To extend these observations, HeLa cells were serum-starved and analyzed at different times after serum addition. The mobility of BRCA1 in S-phase-enriched cells was decreased compared with cells that were G0-enriched (data not shown). In an attempt to isolate HeLa cells at different phases of the cell cycle without imposing a reversible block, we subjected them to centrifugal elutriation. Again, the mobility of BRCA1 was decreased in S- and G2/M-phase-enriched cells (Fig. 5C).
BRCA1 Is Differentially Phosphorylated During Cell Cycle Progression.
The changes of BRCA1 mobility detected by SDS/PAGE could be attributed to changes in phosphorylation, since BRCA1 is a phosphoprotein (Fig. 4). We therefore prepared immunoprecipitates of lysates from synchronized HeLa cells and treated the immunoprecipitated BRCA1 protein with BAP. Fig. 6A shows the BRCA1 mobility change at the different cell cycle phases by immunoblotting using Ab-D. Upon treatment with BAP, BRCA1 protein from the different lysates migrated faster (Fig. 6B). This result demonstrates that the mobility changes of BRCA1 during the cell cycle are likely due to changes in phosphorylation. The fact that phosphatase-treated BRCA1 from G0/G1-enriched cells had a faster mobility than untreated protein suggests that BRCA1 has a certain level of constitutive phosphorylation (hypophosphorylation) and that progression through S phase causes a hyperphosphorylation of the protein.
Figure 6.
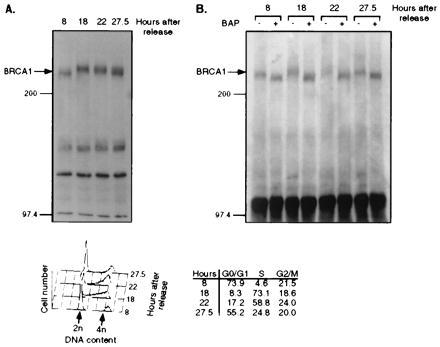
BRCA1 phosphorylation is increased in S phase. HeLa cells were released from a nocodazole-induced block as described for Fig. 5. (Upper) (A) Immunoblotting by Ab-D for BRCA1 from lysates of cells that were released from the block for different periods of time. (B) BRCA1 was immunoprecipitated from the same lysates as described for A by Ab-D, prior to incubation without (−) or with (+) BAP. The precipitates were separated by SDS/PAGE and immunoblotted using Ab-D. Numbers above the panels indicate hours after block release. (Lower) Cellular DNA content after each time period.
DISCUSSION
We present evidence that BRCA1 is a nuclear phosphoprotein that is regulated in a cell cycle-specific manner. Our conclusions are based on the use of antibodies prepared against synthetic peptides derived from four different regions of the BRCA1 sequence.
Because BRCA1 contains at least two nuclear localization signals, it has the ability to translocate to the nucleus. Furthermore, BRCA1 interacts with the importin-α subunit of the nuclear transport signal receptor (11). The C-terminal domain of BRCA1 can activate transcription of a heterologous promoter (33, 34). Thus BRCA1 can function as a transcriptional transactivator. Consistent with these ideas, subcellular fractionation of a human breast cancer, a “normal” breast cell, and a cervical carcinoma cell line revealed that the concentration of BRCA1 protein is highest in the nucleus. Our results are in agreement with those of others (13, 16, 26, 27). However, one group claims that BRCA1 is normally nuclear but localizes to the cytoplasm in most breast and ovarian cancer cells (10, 11, 15). Additionally, another group has reported that BRCA1 is a 190-kDa protein that localizes to secretory vesicles (17).
The conflicting results regarding the localization of BRCA1 protein can partially be explained by the nature of the antisera used for detection. For instance, the commercially available antibody C-20 (Santa Cruz Biotechnology) raised against the extreme C-terminal BRCA1 epitope crossreacts with EGFR and HER2 (30). With our C-terminal antibody (Ab-D), we also detected a strongly crossreacting protein(s) at ≈150 kDa, mainly in membrane fractions (Fig. 3). However, our N-terminal and central antibodies [Ab-A and -C (data not shown)] did not react with the ≈150-kDa species. Therefore, this protein(s) may share an epitope related to the extreme BRCA1 C terminus but is probably not a BRCA1 protein. Certain lower molecular weight proteins detected in some cell lines might represent alternatively spliced variants of BRCA1 (3, 12, 13, 27). In addition to antibody quality, immunofluorescence results are subject to a variety of experimental conditions. Variations in fixation and staining conditions can dramatically influence immunostaining experiments (15, 16). We have carried out immunofluorescence experiments. Our results depended on the cell lines analyzed, the antibodies used, and the processing conditions applied. Staining ranged from periplasmic, to cytoplasmic, to nuclear (homogenous and dot pattern), and to both cytoplasmic and nuclear.
Since BRCA1 is involved in oncogenesis, the fate of BRCA1 protein during cell cycle progression was followed. HeLa cells synchronized by reversible arrest in S or M phase or partial arrest in G0 were harvested at different times after release from the block. Additionally, cells in different cell cycle phases were separated by centrifugal elutriation. All three methods revealed that BRCA1 undergoes hyperphosphorylation during G1–S transition and remains in this state throughout M phase. The protein is partially dephosphorylated in early G1 phase but maintains a level of constitutive phosphorylation. It also appears that the level of BRCA1 protein changes in a cell cycle-dependent manner. BRCA1 levels are highest during S-phase progression and remain elevated until M phase. The changes in BRCA1 levels parallel its hyperphosphorylation and correlate with changes in BRCA1 mRNA levels (data not shown). In T24 bladder carcinoma cells, BRCA1 is also expressed and phosphorylated in a cell cycle-dependent manner (31). The fluctuations of BRCA1 with respect to the cell cycle indicate that BRCA1 may play a role in cell cycle regulation at G1–S transition and/or G2–M phase. In contrast, BRCA1 protein levels appear unaltered during cell cycle in MCF10A cells (35).
Consistent with its identification as a tumor suppressor gene, several reports attribute a negative role for BRCA1 in regulation of cell proliferation (9, 27, 36). BRCA1 has also been shown to be a positive regulator of the proliferative process in early embryonic development (37). Mice lacking the Brca1 gene die early during embryonic development (37–39). These animal experiments contrast with the normal growth and development of human homozygous mutants (40). In human breast epithelial cells, BRCA1 mRNA levels are subject to changes during the cell cycle, reaching maximal levels in late G1 and S phases (41, 42). BRCA1 has also been associated with cellular differentiation (43, 44). Moreover, BRCA1 associates with Rad51 in mitotic and meiotic cells, suggesting that BRCA1 is involved in control of recombination and genome integrity (45). Finally, BRCA1 may function by regulating apoptosis (46). However, no defect in apoptosis was observed in homozygous Brca1-mutant mice (37).
Since BRCA1 is a good candidate as a cell cycle regulator, the phosphorylation state of BRCA1 may prove to be important for this function. Identification of the protein kinase(s) involved in BRCA1 hyperphosphorylation and the protein phosphatase(s) involved in its subsequent dephosphorylation will provide further insight into BRCA1 function. Although the biochemical consequences of phosphorylation are not known, it may influence the subcellular localization of BRCA1 and/or its interaction with other proteins. Finally, if BRCA1 regulates the cell cycle as a transcription factor, it will be important to determine if it binds DNA directly or is a coactivator.
Acknowledgments
We thank Eddie Schwartz, Jayne Lesley, and Kun Ping Lu for excellent technical advice, David Chambers for helping with the FACS analysis, Carl Hoeger and Tammy Goedken for synthesizing peptides, Joan Vaughn and Steve Sutton for preparing and purifying BRCA1 antibodies, Jeff Holt (Vanderbilt) for providing MDA-MB-468 cells, Sean Tavtigian (Myriad Genetics) for providing a full-length BRCA1 cDNA clone, Philip Sheridan for providing anti-HIP116 antibody, Jenny Stevenson and Mark Chapman for critical reading of the manuscript, Nik Somia and Tal Kafri for providing reagents, and other members of the Verma laboratory for valuable discussions. H.R. is supported by a fellowship of the Schweizerische Nationalfonds für wissenschaftliche Forschung. I.M.V.’s laboratory is supported by grants from the National Institutes of Health and the American Cancer Society. I.M.V. is an American Cancer Society Professor of Molecular Biology.
ABBREVIATIONS
- BAP
bacterial alkaline phosphatase
- EGFR
epidermal growth factor receptor
References
- 1.Easton D F, Bishop D T, Ford D, Crockford G P the Breast Cancer Linkage Consortium. Am J Hum Genet. 1993;52:678–701. [PMC free article] [PubMed] [Google Scholar]
- 2.Hall J M, Lee M K, Newman B, Morrow J E, Anderson L A, Huey B, King M-C. Science. 1990;250:1684–1689. doi: 10.1126/science.2270482. [DOI] [PubMed] [Google Scholar]
- 3.Miki Y, Swensen J, Shattuck-Eidens D, Futreal P A, Harshman K, et al. Science. 1994;266:66–71. doi: 10.1126/science.7545954. [DOI] [PubMed] [Google Scholar]
- 4.Castilla L H, Couch F J, Erdos M R, Hoskins K F, Calzone K, Garber J E, Boyd J, Lubin M B, Deshano M L, Brody L C, Collins F S, Weber B L. Nat Genet. 1994;8:387–391. doi: 10.1038/ng1294-387. [DOI] [PubMed] [Google Scholar]
- 5.Futreal P A, Liu Q, Shattuck-Eidens D, Cochran C, Harshman K, et al. Science. 1994;266:120–122. doi: 10.1126/science.7939630. [DOI] [PubMed] [Google Scholar]
- 6.Fitzgerald M G, MacDonald D J, Krainer M, Hoover I, O’Neil E, Unsal H, Silva-Arrieto S, Finkelstein D M, Beer-Romero P, Englert C, Sgroi D C, Smith B L, Younger J W, Garber J E, Duda R B, Mayzel K A, Isselbacher K J, Friend S H, Haber D A. N Engl J Med. 1996;334:143–149. doi: 10.1056/NEJM199601183340302. [DOI] [PubMed] [Google Scholar]
- 7.Langston A A, Malone K E, Thompson J D, Daling J R, Ostrander E A. N Engl J Med. 1996;334:137–142. doi: 10.1056/NEJM199601183340301. [DOI] [PubMed] [Google Scholar]
- 8.Merajver S D, Pham T M, Caduff R F, Chen M, Poy E L, Cooney K A, Weber B L, Collins F S, Johnston C, Frank T S. Nat Genet. 1995;9:439–443. doi: 10.1038/ng0495-439. [DOI] [PubMed] [Google Scholar]
- 9.Thompson M E, Jensen R A, Obermiller P S, Page D L, Holt J T. Nat Genet. 1995;9:444–450. doi: 10.1038/ng0495-444. [DOI] [PubMed] [Google Scholar]
- 10.Chen Y, Chen C F, Riley D J, Allred D C, Chen P L, Von Hoff D, Osborne C K, Lee W H. Science. 1995;270:789–791. doi: 10.1126/science.270.5237.789. [DOI] [PubMed] [Google Scholar]
- 11.Chen C-F, Li S, Chen Y, Chen P-L, Sharp Z D, Lee W-H. J Biol Chem. 1996;271:32863–32868. doi: 10.1074/jbc.271.51.32863. [DOI] [PubMed] [Google Scholar]
- 12.Thakur S, Zhang H B, Peng Y, Le H, Carroll B, Ward T, Yao J, Farid L M, Couch F J, Wilson R B, Weber B L. Mol Cell Biol. 1997;17:444–452. doi: 10.1128/mcb.17.1.444. [DOI] [PMC free article] [PubMed] [Google Scholar]
- 13.Wilson C A, Payton M N, Elliott G S, Buaas F W, Cajulis E E, Grosshans D, Ramos L, Reese D M, Slamon D J, Calzone F J. Oncogene. 1997;14:1–16. doi: 10.1038/sj.onc.1200924. [DOI] [PubMed] [Google Scholar]
- 14.Wu L C, Wang Z W, Tsan J T, Spillman M A, Phung A, Xu X L, Yang M-C W, Hwang L-Y, Bowcock A M, Baer R. Nat Genet. 1996;14:430–440. doi: 10.1038/ng1296-430. [DOI] [PubMed] [Google Scholar]
- 15.Chen Y, Chen P-L, Riley D J, Lee W-H, Allred D C, Osborne C K. Science. 1996;272:125–126. doi: 10.1126/science.272.5258.125. [DOI] [PubMed] [Google Scholar]
- 16.Scully R, Ganesan S, Brown M, De Caprio J A, Cannistra S A, Feunteun J, Schnitt S, Livingston D M. Science. 1996;272:123–125. doi: 10.1126/science.272.5258.123. [DOI] [PubMed] [Google Scholar]
- 17.Jensen R A, Thompson M E, Jetton T L, Szabo C I, van der Meer R, Helou B, Tronick S R, Page D L, King M C, Holt J T. Nat Genet. 1996;12:303–308. doi: 10.1038/ng0396-303. [DOI] [PubMed] [Google Scholar]
- 18.Jensen R A, Thompson M E, Jetton T L, van der Meer R, Helou B, Arteaga C L, Page D L, Holt J T, Tronick S R, Gown A M, Skelly M, Ostermeyer B, Schieltz D, Szabo C I, King M-C. Nat Genet. 1996;13:269–271. doi: 10.1038/ng0396-303. [DOI] [PubMed] [Google Scholar]
- 19.Vale W, Vaughan J, Yamamoto G, Bruhn T, Douglas C, Dalton D, Rivier C, Rivier J. Methods Enzymol. 1983;103:565–577. doi: 10.1016/s0076-6879(83)03040-2. [DOI] [PubMed] [Google Scholar]
- 20.Naviaux R K, Costanzi E, Haas M, Verma I M. J Virol. 1996;70:5701–5705. doi: 10.1128/jvi.70.8.5701-5705.1996. [DOI] [PMC free article] [PubMed] [Google Scholar]
- 21.Mitchell B F, Tupper J T. Exp Cell Res. 1977;106:351–355. doi: 10.1016/0014-4827(77)90180-x. [DOI] [PubMed] [Google Scholar]
- 22.Wigler M, Pellicer A, Silverstein S, Axel R, Urlaub G, Chasin L. Proc Natl Acad Sci USA. 1979;76:1373–1376. doi: 10.1073/pnas.76.3.1373. [DOI] [PMC free article] [PubMed] [Google Scholar]
- 23.van der Geer P, Luo K, Sefton B M, Hunter T. In: Cell Biology: A Laboratory Handbook. Celis J E, editor. Vol. 3. San Diego: Academic; 1994. pp. 422–448. [Google Scholar]
- 24.Andrews N C, Faller D V. Nucleic Acids Res. 1991;19:2499. doi: 10.1093/nar/19.9.2499. [DOI] [PMC free article] [PubMed] [Google Scholar]
- 25.Naldini L, Cirillo D, Moody T W, Comoglio P M, Schlessinger J, Kris R. Biochemistry. 1990;29:5153–5160. doi: 10.1021/bi00473a022. [DOI] [PubMed] [Google Scholar]
- 26.Thomas J E, Smith M, Rubinfeld B, Gutowski M, Beckmann R P, Polakis P. J Biol Chem. 1996;271:28630–28635. doi: 10.1074/jbc.271.45.28630. [DOI] [PubMed] [Google Scholar]
- 27.Rao V N, Shao N, Ahmad M, Reddy E S. Oncogene. 1996;12:523–528. [PubMed] [Google Scholar]
- 28.Mercurio F, Didonato J, Rosette C, Karin M. DNA Cell Biol. 1992;11:523–537. doi: 10.1089/dna.1992.11.523. [DOI] [PubMed] [Google Scholar]
- 29.Sheridan P L, Schorpp M, Voz M L, Jones K A. J Biol Chem. 1995;270:4575–4587. doi: 10.1074/jbc.270.9.4575. [DOI] [PubMed] [Google Scholar]
- 30.Wilson C A, Payton M N, Pekar S K, Zhang K, Pacifici R E, Gudas J L, Thukral S, Calzone F J, Reese D M, Slamon D I. Nat Genet. 1996;13:264–265. doi: 10.1038/ng0796-264. [DOI] [PubMed] [Google Scholar]
- 31.Chen Y, Farmer A A, Chen C-F, Jones D C, Chen P-L, Lee W-H. Cancer Res. 1996;56:3168–3172. [PubMed] [Google Scholar]
- 32.Beijersbergen R L, Bernards R. Biochim Biophys Acta. 1996;1287:103–120. doi: 10.1016/0304-419x(96)00002-9. [DOI] [PubMed] [Google Scholar]
- 33.Chapman M S, Verma I M. Nature (London) 1996;382:678–679. doi: 10.1038/382678a0. [DOI] [PubMed] [Google Scholar]
- 34.Monteiro A N A, August A, Hanafusa H. Proc Natl Acad Sci USA. 1996;93:13595–13599. doi: 10.1073/pnas.93.24.13595. [DOI] [PMC free article] [PubMed] [Google Scholar]
- 35.Aprelikova O, Kuthiala A, Bessho M, Ethier S, Liu E T. Oncogene. 1996;13:2487–2491. [PubMed] [Google Scholar]
- 36.Holt J T, Thompson M E, Szabo C, Robinson-Benion C, Arteaga C L, King M C, Jensen R A. Nat Genet. 1996;12:298–302. doi: 10.1038/ng0396-298. [DOI] [PubMed] [Google Scholar]
- 37.Hakem R, de la Pompa J L, Sirard C, Mo R, Woo M, Hakem A, Wakeham A, Potter J, Reitmair A, Billia F, Firpo E, Hui C C, Roberts J, Rossant J, Mak T W. Cell. 1996;85:1009–1023. doi: 10.1016/s0092-8674(00)81302-1. [DOI] [PubMed] [Google Scholar]
- 38.Gowen L C, Johnson B L, Latour A M, Sulik K K, Koller B H. Nat Genet. 1996;12:191–194. doi: 10.1038/ng0296-191. [DOI] [PubMed] [Google Scholar]
- 39.Liu C-Y, Flesken-Nikitin A, Li S, Zeng Y, Lee W-H. Genes Dev. 1996;10:1835–1843. doi: 10.1101/gad.10.14.1835. [DOI] [PubMed] [Google Scholar]
- 40.Boyd M, Harris F, McFarlane R, Davidson H R, Black D M. Nature (London) 1995;375:541–542. doi: 10.1038/375541b0. [DOI] [PubMed] [Google Scholar]
- 41.Gudas J M, Li T, Nguyen H, Jensen D, Rauscher F J, III, Cowan K H. Cell Growth Differ. 1996;7:717–723. [PubMed] [Google Scholar]
- 42.Vaughn J P, Davis P L, Jarboe M D, Huper G, Evans A C, Wiseman R W, Berchuck A, Iglehart J D, Futreal P A, Marks J R. Cell Growth Differ. 1996;7:711–715. [PubMed] [Google Scholar]
- 43.Lane T F, Deng C, Elson A, Lyu M S, Kozak C A, Leder P. Genes Dev. 1995;9:2712–2722. doi: 10.1101/gad.9.21.2712. [DOI] [PubMed] [Google Scholar]
- 44.Marquis S T, Rajan J V, Wynshaw-Boris A, Xu J, Yin G Y, Abel K J, Weber B L, Chodosh L A. Nat Genet. 1995;11:17–26. doi: 10.1038/ng0995-17. [DOI] [PubMed] [Google Scholar]
- 45.Scully R, Chen J, Plug A, Xiao Y, Weaver D, Feunteun J, Ashley T, Livingston D M. Cell. 1997;88:265–275. doi: 10.1016/s0092-8674(00)81847-4. [DOI] [PubMed] [Google Scholar]
- 46.Shao N, Chai Y L, Shyam E, Reddy P, Rao V N. Oncogene. 1996;13:1–7. [PubMed] [Google Scholar]


