

Abstract
Objectives. We investigated whether self-reported ethnic discrimination in the workplace was associated with well-being among Japanese Brazilians who had returned to Japan. Further, we examined interactions between discrimination and education on well-being.
Methods. We obtained data from a cross-sectional survey of Japanese Brazilian workers (n = 313) conducted in 2000 and 2001. Outcomes were self-rated health, psychological symptoms as measured by the 12-item General Health Questionnaire (GHQ-12) score, and a checklist of somatic symptoms.
Results. Reports of ethnic discrimination were associated with increased risk of poor self-rated health and psychological symptoms (GHQ-12 score), after we controlled for self-assessed workload, supportive relations at work, physically dangerous working conditions, workplace environmental hazards, shift work, number of working hours, age, gender, marital status, income, education, Japanese lineage, length of residence, and Japanese language proficiency. Further, the relationship between discrimination and self-rated health and somatic symptoms was most robust for those with the least education.
Conclusions. Ethnic discrimination appears to be a correlate of morbidity among Japanese Brazilian migrants. Future research should investigate how educational and workplace interventions may reduce discrimination and possibly improve health.
Many emigrants dream of returning to the homeland of their ancestors. Romantic as this notion is, returnees are not always welcome. They may encounter stigma and discrimination, which in turn may contribute to illness.
Since the 1907 authorization by the Brazilian state of São Paulo that permitted the exchange of contract workers, Japan has been sending emigrants to Brazil, most of whom have been employed on contract with coffee and sugar plantations.1 Upon fulfilling their contracts, many have remained to raise their families in Brazil. Today, with an estimated 1.3 million people of Japanese descent, Brazil has the highest concentration of ethnic Japanese outside of Japan.
A shortage of workers in the 1980s prompted the Japanese government to amend its immigration policy. Although still not enjoying the same rights as citizens, Japanese Brazilian immigrants were granted residence status that privileged them over other immigrants. Whereas most immigrants were restricted in their employment opportunities, Japanese Brazilians, because of their Japanese heritage, were allowed to work in any sector. Indeed, many employers preferred Japanese Brazilian workers because of their cultural lineage. Many Japanese Brazilians emigrated to Japan, and by 2000, there were approximately 250 000 Japanese Brazilians in Japan. In this context, Japanese Brazilians occupy a structurally and socially superior niche compared with most other immigrants in Japan.2
This relatively high status, however, is qualified: although Japanese by heritage, Japanese Brazilians are generally viewed as outsiders.3–5 Despite being favored over other immigrants, Japanese Brazilians continue to occupy a low social position, taking jobs that most Japanese find undesirable.5–7 They are often stereotyped as ignorant, dirty, and culturally inferior and seen as failures for emigrating from Japan. Many are even seen as double failures (regardless of whether they were first- or later-generation emigrants) for migrating back to Japan as laborers.3,4 These stereotypes can lead to ethnic discrimination.
Prior studies have found that self-reported discrimination, the recounting of events that one perceives as being unfair and related to one’s social group membership, may be an important stressor and marker of structural disadvantage.8–11 Stressors may contribute to allostatic load—the “wear and tear” on organ systems.12,13 Discrimination may also harm mental health by injuring one’s self-concept, sense of safety, and sense of belonging.14,15 Because stressors may influence a variety of body systems, researchers have long argued that the study of stressors should include a range of health outcomes.16,17
Consistent with this perspective, self-reported discrimination has been associated with problems ranging from coronary calcification18 to low birthweight19 to mood disorders.20 Reports of discrimination are associated with job stressors.21 Workplace discrimination and other occupational stressors are associated with hypertension, distress, and other problems.22–24 Given this diversity of outcomes, it is not surprising that self-reported discrimination is also associated with global markers of illness, including self-rated health, psychological well-being, and total number of health problems.25
Associations between discrimination and morbidity have been found in a variety of groups, including African Americans, Latinos, and American Indians.10,26–28 Studies have also examined discrimination among Asians in the United States,29,30 Canada,31,32 and the United Kingdom.33,34 However, these studies have focused on Asians who are phenotypically (visually) dissimilar to the “majority” population.
For our study, we focused on Japanese Brazilians, which allowed us to investigate an ethnic group whose phenotype is arguably similar to that of the majority group but whose immigration history makes them socially distinct.5,7 These considerations lead to the hypothesis that self-reported ethnic discrimination in the workplace will be associated with increased morbidity, as indicated by psychological symptoms, self-rated health status, and somatic symptoms. Because our study focused on workplace discrimination, we also included several other psychosocial and physical hazards in the workplace as potential confounders. This permitted us to evaluate whether ethnic discrimination is a risk factor distinct from other important factors.
Additionally, we investigated whether the association between discrimination and morbidity is stronger among those with less education. This interaction between multiple forms of disadvantage has been called the “double jeopardy” hypothesis.35,36 One of the major stereotypes of Japanese Brazilians is that they are ignorant.3,4 For well-educated Japanese Brazilians, academic achievements can temper the effects of discrimination. Those with less formal education, however, may not have such resources at their disposal. We therefore examined interactions between discrimination and education.
METHODS
Sample
Japanese Brazilians, who are often mobile, comprised only 0.2% of the population in Japan in 2000.1,6 It was therefore not feasible to draw a random sample. Instead, data came from a convenience sample of Japanese Brazilian adults visiting the Brazilian consulate in Nagoya, Japan, and from a snowball sample of adults residing in a municipal housing complex in Aichi Prefecture in 2000 and 2001. This prefecture was chosen because a sizable Japanese Brazilian population resides there. The response rates in the consulate and snowball samples were 92% and 80%, respectively (combined n = 483). Because our focus was on work-related discrimination among Japanese Brazilians, we excluded 106 individuals who were not employed during the study period and 64 who were not of Japanese lineage from our analysis and focused on 313 individuals.
A survey, aimed at a secondary-school level of literacy, was developed in Japanese, was translated into Portuguese by bilingual Japanese Brazilian medical experts, and checked independently by a bilingual Japanese Brazilian clinical psychologist. Surveys were self-administered (in Portuguese) to minimize biases of social desirability that may result from face-to-face administration. More details on the survey and sample are available from the authors.
Of the 313 participants, 246 were employed at firms producing industrial goods (e.g., electronics, automobile components). The remaining workers were technicians (n=15), clerical workers (n=12), construction workers (n=7), or employed in other occupations (n = 33). Because of the small numbers of nonindustrial workers, our analyses did not distinguish by occupational title but included several psychosocial and physical workplace conditions.
Measures
Because stressors have nonspecific and diverse effects on well-being,13,16,17 our dependent variables were 3 broad outcomes: General Health Questionnaire score, self-rated health, and somatic conditions. Independent variables were work discrimination, other workplace factors, and sociodemographic characteristics.
The 12-item General Health Questionnaire (GHQ-12) has been used worldwide to measure psychological problems, mainly those related to anxiety or depression and social dysfunction.37 We used the Portuguese version of the GHQ-12, edited slightly for clarity and scored by the 0-0-1-1 method.38 The Cronbach α for this sample was 0.79.
Self-rated health is a widely used indicator of overall health status that has predicted mortality and clinical morbidity in longitudinal studies across numerous countries.39,40 Respondents were asked, “Compared with others your age, would you rate your health as excellent, good, average or poor?” We dichotomized responses into “excellent/good” and “average/ poor” because the distribution was skewed.
Somatic conditions were self-assessed with a checklist of 20 problems (e.g., pain, headaches, chest pain, upset stomach) adapted from the Symptoms and Problems Complexes for the Quality of Well-Being Scale.41 These conditions were summed to arrive at a score ranging from 0 to 20.
Work discrimination was assessed with an adapted 10-item, 5-point scale developed by Sanchez and Brock.42 The scale included the following items, all referring to experiences at work: (1) “I feel uncomfortable when others make jokes or negative comments about people of my ethnic background,” (2) “I sometimes feel that my ethnicity is a limitation,” (3) “Many people have stereotypes about my culture or ethnic group and treat me as if they were true,” (3) “People think I am unsociable when in fact I have trouble communicating in Japanese,” (4) “I sometimes feel that people actively try to stop me from advancing because of my ethnic origin,” (5) “It bothers me when people pressure me to assimilate into Japanese culture and customs,” (6) “I do not get enough recognition because I am different,” (7) “I feel that others exclude me from their activities because of my ethnic background,” (8) “People look down upon me if I practice customs of my culture,” and (9) “The difficulty of building relations in Japanese is my limitation at work.” Responses ranged from 1 (strongly disagree) to 5 (strongly agree). Items were summed, and higher scores indicated greater perceptions of discrimination. The Cronbach α for this sample was 0.87.
To account for confounding by other work-place stressors, we included measures adapted from the Occupational Stress Questionnaire.43 A factor analysis uncovered 3 factors that explained 55% of the total variance (25%, 16%, and 14% explained by first, second, and third factors, respectively). The first factor, workload, consisted of 4 items, including “Do you have to hurry to get your work done?” and “Is your work usually too much?” Responses to each item ranged from 1 (never) to 5 (constantly). The second factor, physically dangerous work conditions, had 3 items, including “Does your work involve the risk that you might hurt yourself?” and “Does your work involve the risk that you might cause someone else to have an accident?” Responses ranged from 1 (never) to 5 (very frequently). The third factor, supportive relations at work, had 3 items, including “How do workmates get along at your workplace?” and “Does your superior provide help and support when needed?” Responses ranged from 1 (never) to 5 (very much).
Environmental hazards were determined from a checklist of 11 items adapted from other studies on physical dangers at work.44 This checklist included items on exposure to dust, chemicals, noise, vibration, poor lighting, freezing temperature, and narrow work spaces. Checked items were summed.
The workload, physically dangerous work conditions, and environmental hazards measures correspond to the undesirable “3K’s” described in the Japanese literature7,45: kitsui (demanding), kiken (dangerous), and kitani (dirty). We also asked about the average hours worked per day and whether the respondent performed shift work (yes/no).
Respondents were asked to provide information on sociodemographic variables, including gender, age, marital status, household monthly income, education, length of residence in Japan, and proficiency in Japanese. Income and length of residence were coded as ordinal variables. Education was “less than high school diploma,” “high school diploma,” or “some college or more.” We also asked whether the respondent was of “pure Japanese lineage” or of “mixed lineage.”
Analytic Plan
We first present the bivariate association between self-reported discrimination and health outcomes and then report the results of multivariate analyses. We estimated robust standard errors to account for clustering within the prefecture and consulate. For analyses of GHQ-12 scores and somatic symptoms, we used negative binomial regression; for analyses of self-rated health, we used logistic regression.46 For all analyses, we used SAS version 9.13 (SAS Institute Inc, Cary, NC). We also tested interaction terms between discrimination and education. Continuous variables were centered at their mean (to reduce multicollinearity and facilitate interpretation of the intercept), and significant interactions were clarified with graphs and analyses of slopes.47
RESULTS
Table 1 ▶ summarizes the characteristics of the sample. Respondents, on average, were 34 years old. Slightly more than half (58%) were men, and most were married (71%). Most (69%) were of “pure” Japanese lineage, although only 37% felt they spoke Japanese well or very well. The modal length of residency in Japan was between 6 and 9 years. The modal monthly income was 200 000 to 299 000 yen, and 34% had attended college. About 33% of respondents described their health as average or poor. Respondents reported 2.4 somatic symptoms on average and a mean GHQ-12 score of 2.3 (possible range = 0–12).
TABLE 1—
Sample Characteristics of Japanese Brazilians (n = 313): Japan, 2000–2001
| Value, Mean (SD) or % | Range | |
| Health measures | ||
| GHQ-12 score | 2.3 (2.3) | 0–12 |
| Poor/average self-rated health | 32.9 | |
| No. of somatic symptoms | 2.4 (2.3) | 0–20 |
| Workplace ethnic discrimination | 25.1 (9.7) | 10–50 |
| Work conditions | ||
| Workload | 12.0 (3.0) | 4–19 |
| Supportive relations at work | 11.7 (2.4) | 4–14 |
| Physically dangerous work conditions | 6.5 (2.5) | 3–14 |
| Environmental hazards | 2.8 (2.2) | 0–10 |
| Did shift work | 29.4 | |
| Hours worked per day | 9.9 (1.9) | 5–14 |
| Sociodemographics | ||
| Age | 33.9 (10.7) | 16–65 |
| Men | 57.5 | |
| Currently married/cohabitating | 70.6 | |
| Income, yena | ||
| < 100 000 | 6.1 | |
| 100 000–199 999 | 8.8 | |
| 200 000–299 999 | 28.7 | |
| 300 000–399 999 | 23.0 | |
| 400 000–499 999 | 13.5 | |
| 500 000–599 999 | 8.1 | |
| ≥ 600 000 | 11.9 | |
| Education | ||
| Less than high school | 24.9 | |
| High school graduate | 40.6 | |
| Some college or more | 34.5 | |
| Lineage | ||
| Both parents of Japanese heritage | 68.7 | |
| One parent Japanese, one parent other | 31.3 | |
| Length of residence in Japan, y | ||
| < 3 | 16.4 | |
| 3–5 | 27.7 | |
| 6–9 | 33.7 | |
| 10–16 | 22.2 | |
| Japanese language proficiency | ||
| Good/excellent | 36.8 | |
| Speak a little | 44.9 | |
| Unable to speak | 18.3 | |
Note. GHQ-12 = 12-item General Health Questionnaire (Portuguese version).The theoretically possible range of scores was identical to the observed range, with the following exceptions: supportive relations at work: 3–15; physically dangerous work conditions: 3–15; workload: 4–20; environmental hazards: 0–11.
aOn January 1, 2001, one US dollar was worth 116.67 yen.
Respondents indicated a moderate level of workplace concerns. The mean level of work-place discrimination was 25.1 (scale=10–50). Respondents also reported an average level of workload (mean=12.0 on a scale of 4–20), supportive relations at work (mean=11.7 on a scale of 3–15), and relatively fewer physically dangerous work conditions (mean=6.5 on a scale of 3–15). Respondents noted 2.8 work-place hazards on average. Respondents worked an average of 9.9 hours per day and 29% performed shift work.
Table 2 ▶ shows the relationship between discrimination, occupational factors, and health outcomes. Models A1, B1, and C1 show the bivariate relationships for GHQ-12 score, self-rated health, and somatic symptoms, respectively. Ethnic discrimination was positively associated with all 3 outcomes. Several work factors were associated with health in the expected direction. For example, supportive relations at work were associated with lower GHQ-12 score and fewer somatic symptoms. One unexpected finding was that those with less education had lower GHQ-12 scores and fewer somatic symptoms than those with more education.
TABLE 2—
Association Between Ethnic Discrimination and Health Outcomes Among Japanese Brazilians: Japan, 2000–2001
| GHQ-12a | Poor/Average Self-Rated Healthb | Somatic Symptomsa | ||||
| Model A1, b (SE) | Model A2, b (SE) | Model B1, b (SE) | Model B2, b (SE) | Model C1, b (SE) | Model C2, b (SE) | |
| Workplace ethnic discrimination | 0.03*** (0.005) | 0.020*** (0.004) | 0.045*** (0.005) | 0.036*** (0.008) | 0.016*** (0.005) | 0.006 (0.007) |
| Supportive relations at work | –0.094*** (0.027) | –0.056** (0.020) | –0.037 (0.048) | 0.021 (0.052) | –0.093*** (0.016) | –0.045* (0.022) |
| Workload | 0.076*** (0.012) | 0.047*** (0.004) | –0.022 (0.030) | –0.042 (0.039) | 0.033 (0.031) | 0.001 (0.026) |
| Physically dangerous work conditions | 0.108*** (0.029) | 0.100*** (0.029) | 0.041 (0.034) | 0.026 (0.044) | 0.061*** (0.015) | 0.022 (0.016) |
| Environmental hazards | 0.049** (0.015) | –0.055*** (0.006) | 0.069** (0.028) | –0.003 (0.049) | 0.115*** (0.013) | 0.100*** (0.013) |
| Shift work | 0.151 (0.102) | –0.011 (0.041) | 0.032 (0.282) | 0.053 (0.247) | –0.029 (0.137) | –0.235* (0.102) |
| Hours worked per day | 0.046** (0.015) | 0.012 (0.023) | –0.045 (0.059) | –0.063 (0.093) | 0.047* (0.023) | 0.043* (0.021) |
| Education | ||||||
| Less than high school | –0.227* (0.112) | −0.228* (0.090) | –0.267 (0.384) | –0.342 (0.470) | –0.216** (0.072) | –0.157 (0.135) |
| High school graduate | 0.006 (0.088) | −0.060 (0.050) | –0.074 (0.316) | –0.203 (0.380) | –0.070 (0.180) | –0.133 (0.157) |
| Some college or more (Ref) | 1.00 | 1.00 | 1.00 | 1.00 | 1.00 | 1.00 |
Note. GHQ-12 = 12-item General Health Questionnaire (Portuguese version). Models A1, B1, and C1 are bivariate models. Models A2, B2, and C2 are multivariate models. Multivariate models were adjusted for age, gender, marital status, Japanese lineage, income, length of residence, and Japanese language proficiency.
aNegative binomial regression.
bLogistic regression.
*P<.05; **P<.01; ***P<.001.
Although the bivariate analyses show that discrimination was associated with all 3 outcomes, occupational and demographic factors may have confounded these associations. We therefore performed multivariate analyses. Models A2, B2, and C2 in Table 2 ▶ show the multivariate analyses for GHQ-12 score, self-rated health, and somatic symptoms, respectively. When covariates were accounted for, self-reported ethnic discrimination in the workplace was associated with greater GHQ-12 score (b = 0.02; P < .01) and lower self-rated health (b = 0.036; P < .01), but there was no main-effect association between discrimination and somatic symptoms (b = 0.006; P > .05). Additionally, several of the other variables were significant as follows: supportive relations at work were associated with lower GHQ-12 score and fewer somatic symptoms; workload and physically dangerous work conditions were associated with higher GHQ-12 score; environmental hazards were associated with lower GHQ-12 score and more somatic symptoms; hours worked were associated with more somatic symptoms, and shift work was associated with fewer symptoms; persons with more education reported higher GHQ-12 score than those with the least education.
We also tested interaction terms between discrimination and education for each outcome. These interactions were statistically significant for self-rated health and for somatic symptoms. To assist interpretation, we plotted these interactions (Figures 1 ▶ and 2 ▶) for 3 levels of education (less than high school diploma, high school degree, and college or higher). The x-axis shows the values of discrimination at the mean and at −2, −1, +1, and +2 standard deviations from the mean.47 The visual interpretations are helpful, but to probe the interactions further, we examined whether a given line’s slope was statistically different from zero.
FIGURE 1—
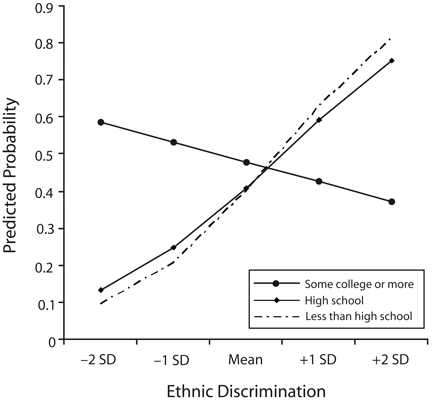
Predicted probability of poor/average self-rated health among Japanese Brazilians, by education and self-reported discrimination: Japan, 2000–2001.
Note. These interactions are adjusted for age, gender, marital status, Japanese lineage, income, length of residence, and Japanese language proficiency. The regression line slope for college graduates is not statistically different from zero (b = −0.007; P > .05). The regression line slopes for high school education and less than high school education are both significantly greater than zero (b = 0.02; P < .05) but do not differ from one another.
FIGURE 2—
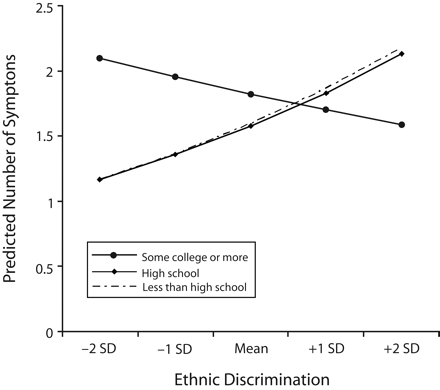
Number of somatic symptoms among Japanese Brazilians, by education and self-reported discrimination: Japan, 2000–2001.
Note. These interactions are adjusted for age, gender, marital status, Japanese lineage, income, length of residence, and Japanese language proficiency. The regression line slope for college graduates is not statistically different from zero (b = −0.02; P > .05). The regression line slopes for high school education and less than high school education are both significantly greater than zero (b = 0.08; P < .001) but did not differ from one another.
Figure 1 ▶ shows that the association between discrimination and the probability of poor self-rated health varied by level of education. Among both those who finished high school and those who did not, the probability of poor self-rated health increased with report of discrimination (b = 0.077; P < .001), with no statistically significant difference between the 2 groups. Although there appears to be a negative slope for college attendees, this slope was not statistically different from zero (b= −0.023; P > .05).
Figure 2 ▶ shows a similar pattern for somatic symptoms. Again, there was a positive association between discrimination and somatic symptoms among those who finished high school and those who did not (b = 0.016; P < .05), and these 2 educational levels did not differ from one another. Additionally, the slope for discrimination among those with a college education was not statistically different from zero (b = −0.007; P > .05).
Thus, discrimination was associated with increased likelihood of poor self-rated health and somatic symptoms among those with a high school education or less. However, there was no association between discrimination and these outcomes among those with a college education.
In supplemental analyses, we reanalyzed our data, including the 64 employed Brazilians of non-Japanese origin, and obtained similar results. In post hoc analyses, we found interactions between discrimination and lineage and language. Specifically, the strength of association between discrimination and GHQ-12 score was stronger for Japanese Brazilians of Japanese descent (b=0.12) than for those of “mixed” lineage (b=0.05). Additionally, the strength of association for discrimination was stronger for those more fluent in Japanese (b=0.04) than those less fluent (b=0.01).
DISCUSSION
We found that among Japanese Brazilians, reports of ethnic discrimination in the workplace were associated with more psychological problems, lower self-rated health, and more somatic symptoms. These associations persisted even after we accounted for other workplace factors, including workload, supportive relations at work, shift work, hours worked, physically dangerous work conditions, other workplace hazards, and several sociodemographic characteristics. Additionally, education protected against discrimination with regard to self-rated health and somatic symptoms.
Other studies have also found that discrimination is associated with morbidity.21 In the United States, workplace discrimination among African American women was associated with job stress.21,48 Pavalko et al. reported that workplace discrimination among Black and White women was associated with distress over 5 years of follow-up.24 In Britain, ethnic minorities who felt that the majority of British employers were racist had higher odds of fair or poor self-rated health than those who felt that a minority of employers were racist.34 A key extension of our study is the finding that workplace discrimination is associated with health outcomes independent of workplace stressors and hazards.
Our findings partially echo the work of Din-Dzietham et al., who noted that work-place discrimination by African Americans against other African Americans predicted high blood pressure.22 In our study, there appears to be discrimination against Japanese Brazilians by their Japanese counterparts. Interestingly, a supplemental analysis found that the strength of association between ethnic discrimination and mental health status was weaker for mixed-lineage and non-Japanese Brazilians than for Japanese Brazilians. These interactions are consistent with the “black sheep effect,” which hypothesizes that when both “in-group” and “out-group” members both do something regarded as unfavorable, the in-group members (the “black sheep”) are judged more harshly than the out-group members.49,50 In our example, “pure” Japanese Brazilians may be considered in-group members and may therefore be treated with greater discrimination and encounter more distress than mixed-lineage (out-group) Japanese Brazilians.
We also found interactions with language, where the effects of discrimination were stronger for those more fluent in Japanese. This might be because those who were more fluent were more attuned to subtle slights than those who were less fluent. We were unable to fully explore whether these processes generate heightened levels of discrimination against “pure” and language-fluent Japanese Brazilians. These interactions, however, suggest that discrimination may be experienced as more unfair by these groups, and these experiences may contribute to a greater level of stress and subsequent greater morbidity. We caution, however, that these interactions were conducted post hoc and should not be seen as confirmatory; rather, they should be used for generating and testing hypotheses.
Prior studies based on the “double jeopardy” hypothesis have reported interactions between racial and socioeconomic discrimination among African Americans.36 Our analyses also support this hypothesis. Discrimination was associated with lower self-rated health and more somatic symptoms among those with less than a college education, but there was no association between discrimination and these outcomes for those with some college education. Individuals with a college education may encounter qualitatively different forms of discrimination compared with those with less education. This may be especially important in Japan, where a premium is placed on formal education. Additionally, people with higher education may have resources that help buffer them from discrimination. Future research should evaluate these potential mechanisms.
One anomalous finding was that those with more education reported a higher GHQ-12 score than those with the least education. It is not clear why this is so, but we speculate that Japanese Brazilians with a high education who take low-skill jobs may encounter depression. This suggests that a mismatch between one’s education and one’s job may lead to psychological problems, but at the same time, educational achievements may still protect against the potential effects of discrimination on somatic and general health.
Several prior studies have found direct associations between discrimination and somatic conditions.27,29 We did not find such a “main effects” association; rather, discrimination was associated with somatic conditions only when we distinguished different levels of education. This serves as a reminder that failure to attend to subgroup differences may lead to type 2 error (i.e., failure to reject a false null hypothesis).
Limitations and Strengths
Several caveats should be acknowledged. First, the data were cross-sectional so the temporal relationship between discrimination and health outcomes could not be determined. Although theory suggests that ethnic discrimination may cause morbidity, it is possible that illness causes one to report ethnic discrimination. Several longitudinal studies support the purported causal direction of perceived discrimination on health, but more longitudinal studies are needed.24,51,52
Second, the nonrandom sampling method we used raises questions about generalizability and selection biases. For example, individuals visiting the Brazilian consulate may differ in their employment experiences from those not visiting, and residents of Aichi Prefecture may differ from those living elsewhere in Japan. These concerns, however, were balanced by the exigencies of recruiting a relatively rare, mobile, and seldom-studied population. Indeed, the recruitment from a known source may have accounted for the excellent response rates. The Japanese Census provides only estimates of gender and age for Japanese Brazilians. Compared with the Japanese Census, our sample is similar with respect to gender but has slightly more individuals aged 30 to 49 years and fewer of other ages. Compared with Japanese in general, our sample reports higher levels of fair or poor self-rated health and comparable GHQ-12 scores.53,54
Third, self-reported data, commonly used in studies of stressors, are subject to a variety of response biases (e.g., recall bias).55 Previous research suggests that the association between self-reported discrimination and health outcomes persists even after accounting for social desirability bias and affective disposition (the tendency to complain about innocuous events).29,30,56 However, it will be important for future studies to include “objective” measures of exposure and health.
Our study had several strengths. First, this was the first study to our knowledge that empirically examined discrimination and health among Japanese Brazilians. The examination of this population is important not only for improving the health of a disadvantaged population but also for the broader theoretical development of discrimination research. It suggests that ethnic discrimination may not only arise from unfair treatment based on phenotype, as is often framed in the US discourse on race, but also from other dimensions of difference.
Second, whereas most studies of discrimination measure global experiences, our study focused on workplace discrimination; an advantage of focusing on a specific setting is that points of intervention are more clearly specified. Thus, although reducing societal discrimination is important, it is also important to devote resources to reducing discrimination in the workplace.
Third, we controlled for a variety of other stressors. One issue facing many studies that examine discrimination as a stressor is that they do not measure other stressors. Thus, it is often unclear whether discrimination is an important factor in itself or simply serves as a proxy for other more well-characterized stressors. Our study provides evidence that ethnic discrimination in the workplace may indeed be an independent stressor.
Conclusions
We found that Japanese Brazilians who reported ethnic discrimination at work had greater morbidity, a finding that appears to be most relevant to those with less education. Our data suggest that policies and practices designed to decrease ethnic discrimination in the workplace and to improve education may help improve health. Whereas appreciation for diversity may be growing in the United States, this trend has yet to gain the same recognition in Japan. Moreover, with growing globalization, there remains a critical need to explore the health of migrants, not only those who leave but also those who return to the home of their ancestors.
Acknowledgments
This work was supported by a grant-in-aid for scientific research from the Japan Society for the Promotion of Science (grant 19490011).
We thank the Brazilian consulate in Nagoya for providing us with the opportunity to contact Japanese Brazilians for the study. We gratefully acknowledge Cintia Yoko Morioka of the University of São Paulo and Neusa Inoue of the secretariat of the Brazilian Consulate in Nagoya (2000–2001) for their help with implementing our survey.
Human Participant Protection Although Tokyo Gakugei University did not have an institutional review board when we started this research, our research proposal was reviewed and approved by the board of the Japan Society for the Promotion of Science. All individuals provided informed consent before participating in this study.
Peer Reviewed
Contributors T. Asakura conceptualized the study and led all aspects of its implementation. G. C. Gee assisted with the analyses and led the writing. K. Nakayama assisted with the study and the analyses. S. Niwa assisted with implementation of the study. All authors helped to conceptualize ideas, interpret findings, review drafts of the article, and approve the final version.
References
- 1.Higuchi N. Brazilian Migration to Japan: Trends, Modalities, and Impact. Mexico City, Mexico: United Nations Secretariat; January 28, 2006. Publication UN/POP/EGM-MIG/2005/11. Available at: http://www.un.org/esa/population/meetings/IttMigLAC/P11_Higuchi.pdf. Accessed April 22, 2007.
- 2.Shipper AW. The political construction of foreign workers in Japan. Crit Asian Stud. 2002;34:41–68. [Google Scholar]
- 3.Tsuda T. The stigma of ethnic difference: the structure of prejudice and “discrimination” toward Japan’s new immigrant minority. J Jpn Stud. 1998;24: 317–359. [Google Scholar]
- 4.Tsuda T. Domesticating the immigrant other: Japanese media images of Nikkeijin return migrants. Ethnology. 2003;42:289–305. [Google Scholar]
- 5.de Carvalho D. Migrants and identity in Japan and Brazil: the Nikkeijin. London, England: Routledge Curzon; 2003.
- 6.Asakura T, Murata AK. Demography, immigration background, difficulties with living in Japan, and psychological distress among Japanese Brazilians in Japan. J Immigr Minor Health. 2006;8:325–338. [DOI] [PubMed] [Google Scholar]
- 7.Tsuda T. Strangers in the Ethnic Homeland: Japanese Brazilian Return Migration. New York, NY: Columbia University Press; 2003.
- 8.Clark R, Anderson A, Clark VR, Williams DR. Racism as a stressor for African Americans. Am Psychol. 1999;54:805–816. [DOI] [PubMed] [Google Scholar]
- 9.Krieger N. Does racism harm health? Did child abuse exist before 1962? On explicit questions, critical science, and current controversies: an ecosocial perspective. Am J Public Health. 2003;93:194–199. [DOI] [PMC free article] [PubMed] [Google Scholar]
- 10.Mays VM, Cochran S, Barnes NW. Race, race-based discrimination, and health outcomes among African Americans. Annu Rev Psychol. 2007;58:201–225. [DOI] [PMC free article] [PubMed] [Google Scholar]
- 11.Williams DR, Neighbors H, Jackson JS. Racial/ethnic discrimination and health: findings from community studies. Am J Public Health. 2003;93:200–208. [DOI] [PMC free article] [PubMed] [Google Scholar]
- 12.Geronimus AT, Hicken M, Keene D, Bound J. “Weathering” and age patterns of allostatic load scores among blacks and whites in the United States. Am J Public Health. 2006;96:826–833. [DOI] [PMC free article] [PubMed] [Google Scholar]
- 13.McEwen BS. Protective and damaging effects of stress mediators. N Engl J Med. 1998;338:171–179. [DOI] [PubMed] [Google Scholar]
- 14.Harrell SP. A multidimensional conceptualization of racism-related stress: implications for the well-being of people of color. Am J Orthopsychiatry. 2000;70: 42–57. [DOI] [PubMed] [Google Scholar]
- 15.Williams DR, Williams-Morris R. Racism and mental health: the African American experience. Ethn Health. 2000;5:243–268. [DOI] [PubMed] [Google Scholar]
- 16.Aneshensel CS. Social stress: theory and research. Annu Rev Sociol. 1992;18:15–38. [Google Scholar]
- 17.Pearlin LI. The sociological study of stress. J Health Soc Behav. 1989;30:241–256. [PubMed] [Google Scholar]
- 18.Lewis TT, Everson-Rose SA, Powell LH, et al. Chronic exposure to everyday discrimination and coronary artery calcification in African-American women: The SWAN Heart Study. Psychosom Med. 2006;68: 362–368. [DOI] [PubMed] [Google Scholar]
- 19.Collins JW, David RJ, Handler A, Wall S, Andes S. Very low birthweight in African American infants: the role of maternal exposure to interpersonal racial discrimination. Am J Public Health. 2004;94:2132–2138. [DOI] [PMC free article] [PubMed] [Google Scholar]
- 20.Kessler RC, Michelson KD, Williams DR. The prevalence, distribution and mental health correlates of perceived discrimination in the United States. J Health Soc Behav. 1999;40:208–230. [PubMed] [Google Scholar]
- 21.Mays VM, Coleman LM, Jackson JS. Perceived race-based discrimination, employment status, and job stress in a national sample of black women: implications for health outcomes. J Occup Health Psychol. 1996;1:319–329. [DOI] [PMC free article] [PubMed] [Google Scholar]
- 22.Din-Dzietham R, Nembhard WN, Collins R, Davis SK. Perceived stress following race-based discrimination at work is associated with hypertension in African Americans: The Metro Atlanta Disease Study, 1999–2001. Soc Sci Med. 2004;58:449–461. [DOI] [PubMed] [Google Scholar]
- 23.Karasek R, Theorell T. Healthy Work: Stress, Productivity, and the Reconstruction of Working Life. New York, NY: Basic Books; 1990.
- 24.Pavalko E, Mossakowski KN, Hamilton VJ. Does perceived discrimination affect health? Longitudinal relationships between work discrimination and women’s physical and emotional health. J Health Soc Behav. 2003;44:18–34. [PubMed] [Google Scholar]
- 25.Finch B, Kolody B, Vega WA. Perceived discrimination and depression among Mexican-origin adults in California. J Health Soc Behav. 2000;41:295–313. [PubMed] [Google Scholar]
- 26.Krieger N, Sidney S. Racial discrimination and blood pressure: the CARDIA Study of young black and white adults. Am J Public Health. 1996;86:1370–1378. [DOI] [PMC free article] [PubMed] [Google Scholar]
- 27.Finch BA, Hummer RA, Kolody B, Vega WA. The role of discrimination and acculturative stress in Mexican-origin adults’ physical health. Hisp J Behav Sci. 2001; 23:399–429. [Google Scholar]
- 28.Whitbeck LB, McMorris BJ, Hoyt DR, Stubben JD, LaFromboise TD. Perceived discrimination, traditional practices, and depressive symptoms among American Indians in the Upper Midwest. J Health Soc Behav. 2002;43:400–418. [PubMed] [Google Scholar]
- 29.Gee GC, Spencer M, Chen J, Takeuchi DT. A nationwide study of discrimination and chronic health conditions among Asian Americans. Am J Public Health. 2007;97:1275–1282. [DOI] [PMC free article] [PubMed] [Google Scholar]
- 30.Gee GC, Spencer M, Chen J, Yip T, Takeuchi DT. The association between self-reported discrimination and 12-month DSM-IV mental disorders among Asian Americans nationwide. Soc Sci Med. 2007;64: 1984–1996. [DOI] [PMC free article] [PubMed] [Google Scholar]
- 31.Noh S, Beiser M, Kaspar V, Hou F, Rummens J. Perceived racial discrimination, depression, and coping: a study of Southeast Asian refugees in Canada. J Health Soc Behav. 1999;40:193–207. [PubMed] [Google Scholar]
- 32.Noh S, Kaspar V. Perceived discrimination and depression: moderating effects of coping, acculturation and ethnic support. Am J Public Health. 2003;93: 232–238. [DOI] [PMC free article] [PubMed] [Google Scholar]
- 33.Bhui K, Stansfeld S, McKenzie K, Karlsen S, Nazroo J, Weich S. Racial/ethnic discrimination and common mental disorders among workers: findings from the EMPIRIC Study of Ethnic Minority Groups in the United Kingdom. Am J Public Health. 2005;95: 496–501. [DOI] [PMC free article] [PubMed] [Google Scholar]
- 34.Karlsen S, Nazroo JY. Relation between racial discrimination, social class, and health among ethnic minority groups. Am J Public Health. 2002;92:624–631. [DOI] [PMC free article] [PubMed] [Google Scholar]
- 35.King D. Multiple jeopardy, multiple consciousness: the context of a black feminist ideology. Signs. 1988; 14:42–72. [Google Scholar]
- 36.Ren XS, Amick BC, Williams DR. Racial/ethnic disparities in health: the interplay between discrimination and socioeconomic status. Ethn Dis. 1999;9: 151–165. [PubMed] [Google Scholar]
- 37.Golderberg D, Williams P. A User’s Guide to the General Health Questionnaire. Windsor, Ontario: NFER-Nelson; 1988.
- 38.Mari JJ, Williams P. A comparison of the validity of two psychiatric screening questionnaires (GHQ-12 & SRQ-20) in Brazil, using relative operative characteristic (ROC) analysis. Soc Sci Med. 1985;15:651–659. [DOI] [PubMed] [Google Scholar]
- 39.Idler EL, Benyamini Y. Self-reported health and mortality: a review of twenty-seven community studies. J Health Soc Behav. 1997;38:21–37. [PubMed] [Google Scholar]
- 40.Idler EL, Hudson SV, Leventhal H. The meanings of self-ratings of health. Res Aging. 1999;21:458–476. [Google Scholar]
- 41.McDowell I, Newell C. Measuring Health: A Guide to Rating Scales and Questionnaires. 2nd ed. New York, NY: Oxford University Press; 1996.
- 42.Sanchez JI, Brock P. Outcomes of perceived discrimination among Hispanic employees: is diversity management a luxury or a necessity? Acad Manage J. 1996;39:704–719. [Google Scholar]
- 43.Elo AL, Leppanen A, Lindstrom K. Occupational Stress Questionnaire: User’s Instructions. Helsinki, Finland: Institute of Occupational Health; 1992.
- 44.McIntosh NJ. Exhilarating work: an antidote for dangerous work? In: Sauter SL, Murphy LR, eds. Occupational Risk Factors for Job Stress. Washington, DC: American Psychological Association; 1995:303–316.
- 45.Martil PL. Labor migration in Asia. Int Migr Rev. 1991;25:176–193. [PubMed] [Google Scholar]
- 46.Long JS. Regression Models for Categorical and Limited Dependent Variables. Thousand Oaks, Calif: Sage Publications; 1997.
- 47.Aiken LS, West SG. Multiple Regression: Testing and Interpreting Interactions. Newbury Park, Calif: Sage Publications; 1991.
- 48.Mays VM. Black women, work, stress, and perceived discrimination: the focused support group model as an intervention for stress reduction. Cult Divers Ment Health. 1995;1:53–65. [PMC free article] [PubMed] [Google Scholar]
- 49.Matthews D, Dietz-Uhler B. The black-sheep effect: how positive and negative advertisements affect voters’ perceptions of the sponsor of the advertisement. J Appl Soc Psychol. 1998;28:1903–1915. [Google Scholar]
- 50.Marques JM, Yzerbyt VY. The black sheep effect: judgmental extremity in inter- and intra-group situations. Eur J Soc Psychol. 1988;18:287–292. [Google Scholar]
- 51.Jackson JS, Brown TN, Williams DR, Torres M, Sellers SL, Brown K. Racism and the physical and mental health status of African Americans: a thirteen year national panel study. Ethn Dis. 1996;6:132–147. [PubMed] [Google Scholar]
- 52.Schulz AJ, Gravlee CC, Williams DR, Israel B, Mentz G, Rowe Z. Discrimination, symptoms of depression, and self-rated health among African American women in Detroit: results from a longitudinal analysis. Am J Public Health. 2006;96:1265–1270. [DOI] [PMC free article] [PubMed] [Google Scholar]
- 53.Fukuda Y, Nakao H, Imai H. Different income information as an indicator for health inequality among Japanese adults. J Epidemiol. 2007;17:93–99. [DOI] [PMC free article] [PubMed] [Google Scholar]
- 54.Doi Y, Minowa M. Factor structure of the 12-item General Health Questionnaire in the Japanese general adult population. Psychiatry Clin Neurosci. 2003;57: 379–383. [DOI] [PubMed] [Google Scholar]
- 55.Krieger N, Smith K, Naishadham D, Hartman C, Barbeau EM. Experiences of discrimination: validity and reliability of a self-report measure for population health research on racism and health. Soc Sci Med. 2005;61:1576–1596. [DOI] [PubMed] [Google Scholar]
- 56.Schneider KT, Hitlan RT, Radhakrishnan P. An examination of the nature and correlates of ethnic harassment experiences in multiple contexts. J Appl Psychol. 2000;85:3–12. [DOI] [PubMed] [Google Scholar]