

Abstract
Rapid deformation of brain matter caused by skull acceleration is most likely the cause of concussion, as well as more severe traumatic brain injury (TBI). The inability to measure deformation directly has led to disagreement and confusion about the biomechanics of concussion and TBI (Shaw, 2002). In the present study, brain deformation in human volunteers was measured directly during mild, but rapid, deceleration of the head (20−30 m/s2 peak, ∼40 ms duration), using an imaging technique originally developed to measure cardiac deformation. Magnetic resonance image sequences with imposed “tag” lines were obtained at high frame rates by repeating the deceleration and acquiring a subset of image data each repetition. Displacements of points on tag lines are used to estimate the Lagrangian strain tensor field. Qualitative (visual) and quantitative (strain) results illustrate clearly the deformation of brain matter due to occipital deceleration. Strains of 0.02−0.05 were typical during these events (0.05 strain corresponds roughly to a 5% change in the dimension of a local tissue element). Notably, compression in frontal regions and stretching in posterior regions were observed. The motion of the brain appears constrained by structures at the frontal base of the skull; it must pull away from such constraints before it can compress against the occipital bone. This mechanism is consistent with observations of contrecoup injury in occipital impact.
Keywords: Strain, deformation, traumatic brain injury, acceleration, magnetic resonance imaging, tagging
Introduction
Traumatic brain injury is widespread, ranging from mild events, such as concussions, that occur commonly in contact sports, to devastating injuries typical of automobile accidents. In concussion, rapid deformation of brain tissue is thought to cause “diffuse mechanically-induced depolarization” of cortical neurons (Shaw, 2002). In severe trauma, diffuse axonal injury (DAI) occurs throughout the white matter of the brain, as axons are stretched beyond a physiological injury threshold (Graham et al., 1995).
The details of brain deformation in human TBI remain largely unknown, although they have been the subject of intense interest and indirect study for decades. In occipital impacts contrecoup injury is often observed in frontal regions (Pudenz et al., 1946, Graham et al., 1995). Many biomechanical explanations of contrecoup injury, such as skull vibration, pressure waves, cavitation, brain rotation and shear deformation have been proposed (see Pudenz and Shelden, 1946, Shaw et al., 2002, e.g.). No explanation has been confirmed by direct experiment, largely due to the practical difficulty of measuring brain deformation in human subjects. Holbourn (1943) showed that angular acceleration of a model human skull was sufficient to cause large “shearing” deformation of gel inside. Pudenz and Shelden (1946) replaced the top half of the skull of a monkey with transparent plastic, and filmed the top of the brain moving and distorting during blunt impact. They hypothesized that brain rotation was the dominant factor in contrecoup injury, but could not visualize the internal deformations they postulated. Quantitative studies of brain biomechanics were undertaken more recently by Margulies et al. (1990) and Meaney et al. (1995) who filmed the motion of grid patterns in gel inside animal and human skulls during imposed angular acceleration. Shear strain was estimated from the change in angle between local grid elements. Shear strains of 0.20−0.30 were observed during angular accelerations typical of diffuse axonal injury in pigs (Meaney et al., 1995). These gel models, however, lack vasculature, meninges, tissue structure, and cerebrospinal fluid (CSF), each of which can drastically affect mechanical response. Hardy et al. (2001) used high-speed (250/sec-1000/sec) bi-planar x-ray imaging to track the displacement of eleven neutral-density radio-opaque markers in the brains of cadavers during impacts. Arcuate, looping tissue displacements of approximately ±5 mm relative to the skull were observed during accelerations up to 108g. The tissue returned to its original configuration after impact (i.e. it was not permanently deformed) at these accelerations. These studies provide the best picture to date of brain motion in injury, but because of the limited spatial resolution, it was not possible to determine tissue strain (Hardy et al., 2001). In addition the mechanical properties of cadavers may differ significantly from those of a live subject (Margulies and Meaney, 1998). A recent study by Ji et al. (2004) describes measurement of brain tissue displacement as a function of head position; this study was performed under quasi-static conditions and did not consider acceleration-induced deformation. In short, direct experimental measurement of mechanical strain in human brain tissue due to acceleration of the skull has eluded researchers, despite more than six decades of interest.
Research on brain trauma is commonly done on animals, such as rodents or pigs, in which the geometry of the brain and skull are quite different from the human. Even in these models, quantitative measurements of deformation are lacking. The clearest studies of rapid neural deformation and injury have been performed outside the brain, for example on guinea pig optic nerve (Bain and Meaney, 2000) and in in vitro cell culture preparations (Smith et al., 1999, Morrison et al., 2000, Geddes et al., 2003, e.g.). However these studies do not provide information on the macroscopic biomechanics of injury.
Computer simulations of injury mechanics (Ruan et al., 1991, Zhang et al., 2004, for example) offer enormous potential for the study of brain biomechanics, because they can be used to replace experiments that can not be performed for ethical reasons (i.e., injury-level accelerations in humans), or that are extremely difficult or expensive. However, accurate computer models require accurate models of tissue and tissue connectivity, as well as experimental data to confirm their accuracy and predictive ability. Lacking such data, numerical predictions of brain deformation remain uncertain. One of the most important reasons to measure deformation in the human brain is to improve the quality and credibility of numerical models of brain injury (Zhang et al., 2004).
Deformation can be described precisely and comprehensively by the mechanical strain tensor. In this study, we describe 2-D images of the 3-D strain fields in sagittal and transverse planes of the intact human brain during mild acceleration of the head. We used a method originally developed to measure deformation of the heart (Zerhouni et al., 1988). In this approach, MR images of periodic motion are obtained with high temporal resolution by acquiring only a single line in the frequency domain (k-space) each repetition. Lines that move with the material are imposed on the tissue before deformation begins by applying magnetic field gradients between radiofrequency pulses. The technique causes harmonic variations of the longitudinal magnetization (Axel and Dougherty, 1989). These “tag lines” move with the tissue, and can be tracked to characterize its kinematics (Zerhouni et al., 1988). To achieve high temporal resolution, the deformation is repeated and a single spatial frequency is observed each repetition. With this approach we have obtained the first quantitative measurements of strain caused by known levels of acceleration. Such measurements are the key to clear understanding of injury biomechanics, including the integration of in vivo, in vitro and numerical models.
Methods
Human volunteers (n=3 subjects, healthy adults 22−39 years old, 2 male, 1 female) performed consistent mild accelerations of the head inside the imaging coil of a clinical MR scanner (Siemens Sonata 1.5T). Potential volunteers with a history of brain injury were excluded. The volunteer placed his or her head inside a rigid fiberglass frame (Figure 1). The head was supported underneath by an elastic pocket and was pre-loaded against this support by Velcro straps around the forehead and chin. The frame was constrained to pivot in the direction of neck flexion-extension. To prepare for each event, the volunteer raised his or her head until a latch engaged to support the frame. The subject then pulled on a cord which released the latch, and the frame fell 2 cm onto a rigid stop (Figure 2). The head was caught by the elastic suspension and decelerated, with peak deceleration of 20−30 m/s2 (2−3 Gs), over about 40 ms (Figure 3). Acceleration, measured after scanning with an accelerometer (PCB Model 336C04) strapped to the subject's forehead, is approximately the head acceleration experienced when jumping vertically a few inches and landing flat-footed. It is roughly 10−15% of the acceleration experienced in “heading” a soccer ball (Naunheim et al., 2003). The protocol was approved by the Institutional Review Board of the Washington University School of Medicine.
Figure 1.
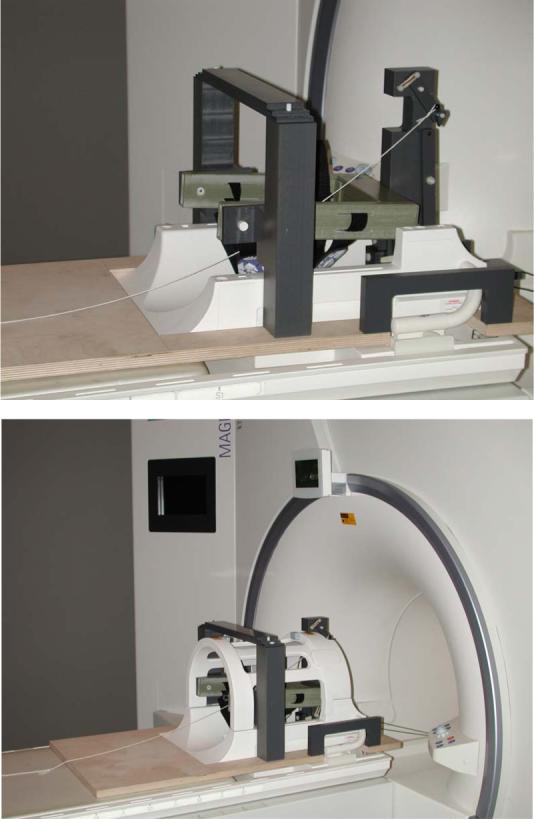
Photographs of the MR compatible device that constrains head motion and produces repeatable accelerations for measurement of intra-cranial strain. The head is in an elastic suspension that provides controlled deceleration of 20−30 m/s2 (2−3G).
Figure 2.

Schematic diagrams of head motion in the (a) sagittal and (b) axial plane. Arrows indicate the approximate trajectory of the mass center of the skull in each plane.
Figure 3.
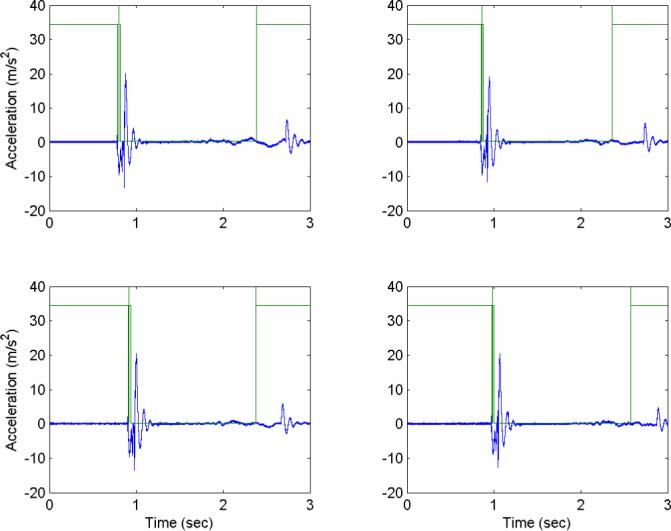
Acceleration profiles measured with an accelerometer strapped to the head, shown relative to the optical trigger signal (square wave) that synchronizes the MRI. Peak acceleration magnitudes are obtained shortly after the optical trigger, as the elastic suspension slows head motion. These four consecutive events are extremely similar, showing good evidence of repeatability of head acceleration. For the entire series of eleven impacts from which these four events are taken, peak accelerations (mean±std. dev.) were (i) 21.1±2.9 m/s2. Calibration tests performed on other dates had peak accelerations of (ii) 25.7±2.7 m/s2 (11 impacts), (iii) 26.9±2.9 m/s2 (6 impacts), (iv) 32.5±3.2 m/s2 (25 impacts). Acceleration data were not acquired during imaging, as the measurement system interfered with the MR signal.
To image such rapid events via MR, the motion must be repeated, since only a fraction of the image can be acquired during the acceleration pulse. The imaging sequence must therefore be synchronized precisely with the motion. In our study, the MR imaging pulse sequence was triggered by an optical switch on the latch release mechanism. Tag lines were applied within the first 10 ms, before the head began to fall. A fast gradient-echo cine sequence (FLASH2D, repetition time TR=6 ms, echo time TE=2.9 ms) was then initiated to acquire a single line of k-space data (192 spatial frequencies) at 90 time points separated by 6 ms. To acquire the next line in k-space at the same time points, the acceleration and acquisition sequence was repeated exactly, except with an incremented value of the phase-encoding gradient. Motion was repeated 72 times to obtain a 192×72 data matrix at each of 90 time points. In two of the four experiments, two sets of images, one with vertical tag lines and another with horizontal tag lines were acquired to better visualize motion in the direction perpendicular to the tag lines. The subject thus performed 4×72 = 288 repetitions to obtain two sagittal tagged images (one with vertical lines, one with horizontal lines) and two axial tagged images. In the other two experiments, both sets of perpendicular tag lines were applied simultaneously, so the subject performed 2×72 = 144 repetitions to obtain one sagittal image and one axial image. In a typical experiment, each image takes several minutes to acquire, and the subject rests in the apparatus for several minutes between each image acquisition.
Image analysis was performed by a variation of the HARP method developed originally by Osman et al. (2000). This method has since been refined and applied by others to measure cardiac deformation (Kuijer et al., 2001, Kraitchman et al., 2003, Liu et al., 2004). Briefly, tagged MRI data is filtered in the frequency domain and then Fourier-transformed to obtain a complex value at every spatial point. The phase of this complex variable is a property that moves with the material. Images with two sets of tag lines provide two sets of phase contours. The intersections of phase contours are found and used to define vertices of a triangular mesh in reference images and deformed images. If a side of a triangle in the reference image is described by the vector DXi, i = 1,2,3, and the corresponding side of the corresponding triangle in the deformed image is dxi, the elements of the local deformation gradient tensor F can be estimated by solving Equation 1 for F (in the least squares sense) simultaneously for i=1, 2, 3. The corresponding 2-D apparent Lagrangian strain tensor E is computed directly from F (Equation 2).
| (1) |
| (2) |
where I is the 2nd rank unit tensor and FT denotes the transpose of the deformation gradient tensor. The strain tensor is dimensionless, essentially describing the change in size and shape of an infinitesimal element, relative to its original size. With respect to Cartesian coordinates in the reference image plane, its elements are
| (3) |
This strain tensor is zero for any rigid body motion (translation or rotation).
Results
Tagged images were obtained in a sagittal plane approximately 1 cm lateral to the midline, and in an axial plane roughly tangent to the inferior limits of the corpus callosum (Figures 4a and 4d). The tagged images in Figure 4, acquired 10−12 ms after the peak deceleration of the skull, show tag lines that are barely deformed enough to detect by eye. The brain has translated backward and rotated clockwise in the sagittal plane, relative to the skull. The originally vertical tag lines in Figure 4c (sagittal) show a slight reverse “S” shape and the originally horizontal tag lines in Figure 4e (axial) have curved slightly concave down.
Figure 4.
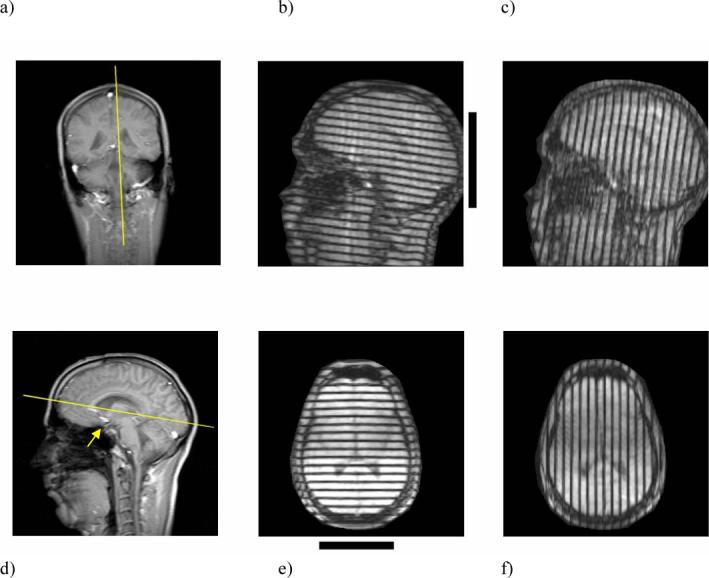
(a) Sagittal image plane. (b) Initially-horizontal and (c) initially-vertical tag lines in the sagittal image obtained 78 ms after tagging, 5−10 ms after peak deceleration of the skull. Horizontal and vertical tag lines were applied immediately after triggering, before the head drops; the tag lines rotate and deform with the tissue. (d) Axial image plane. (e) Initially-horizontal and (f) initially-vertical tag lines in the axial image obtained 5−10 ms after peak deceleration. The arrow in panel (d) indicates the postulated region of tethering described in the text. Black bars next to panels (b) and (e) show the location of contact with the elastic support at the back of the head. Tag lines are initially perfectly straight and either horizontal and vertical in the image plane.
Contours of constant phase from HARP image analysis provide quantitative measurements of displacement in the plane. In Figure 5, such phase contours are shown for the reference image and for the images of Figure 4, except that the displacements have been amplified by a factor of 5. The deformed, scaled contours show clearly the deformations that were barely apparent in Figure 4.
Figure 5.

(a) Reference (0 ms after tagging) and (b) deformed (78 ms post-tagging) phase contours (deformation 5× actual) from pairs of tagged sagittal MR images. (c) Maximum principal Lagrangian strain field, ε1, for the deformed sagittal image. (d) Reference and (e) deformed phase contours from pairs of tagged axial images. (f) Maximum principal Lagrangian strain, ε1, field for the deformed axial image. The value ε1 describes the maximum elongation of an element, relative to its original length, when the element is oriented so it experiences only elongation and shortening. In principal strain figures, the length of each line reflects the magnitude of ε1; the direction of each line shows the orientation of principal strain.
The displacements of points on phase contours can be used to quantify, as well as visualize, deformation. The largest eigenvalue of the Lagrangian strain tensor, the maximum principal strain, ε1, characterizes the amount of stretch of an element, relative to its undeformed length, with the element oriented so it experiences only elongation or shortening (not shear). The corresponding eigenvector describes the direction of maximal stretch. Thus a principal strain value of ε1=0.05 corresponds to a 5% increase in length along this specific direction. The maximum principal Lagrangian strain field is used to illustrate the degree and direction of deformation in Figures 5c and 5f.
Elements of the 2-D apparent strain tensor are shown in Figure 6 for sagittal and axial images before and after deceleration. The Lagrangian strain field is computed with respect to referential coordinates, and is shown on the reference image. In all four experiments with three subjects we consistently observed three features of the sagittal strain fields: (1) Horizontal, or anterior-posterior, shortening (negative εxx, blue) in the frontal lobes of the brain, opposite the site of contact, and horizontal elongation (positive εxx, red) in the occipital regions near the site of contact; (2) Vertical, or inferior-superior, shortening (negative εyy, blue) in superior frontal areas, and vertical elongation (positive εyy, red) in regions further occipital; (3) Shear bands at the top and bottom of the brain (negative εxy, blue) and in an intermediate layer (positive εxy).
Figure 6.

Sagittal and axial Lagrangian strain tensor fields at several time points after tagging at 0 ms. Peak deceleration occurred at 70−75 ms. Note anterior shortening and posterior elongation in both planes, hypothesized to be due to frontal tethering of the brain. The black bars in the upper left images show the location of contact with the elastic support at the back of the head.
In axial strain fields there are also three salient features seen in all four experiments: (1) lack of significant lateral deformation (small magnitudes of εxx); (2) vertical, or anterior-posterior, shortening (negative εyy, blue) anterior to a point about 1/3 down in the image, and elongation (positive εyy, red) below that point; (3) Regions of shear, εxy, of opposite sense on the left and right sides of the image. The sense of the shear strain reflects the fact that both sides of the brain appear to sag relative to the middle, so that on one side the slope is negative and on the other the slope is positive. Observations in axial images of anterior-posterior shortening in the frontal areas opposite the occipital contact site, and elongation near the contact site are consistent with sagittal strain fields described above.
Distributions of strain magnitudes observed at specific times are shown in Figure 7. The fraction of the strain field in which ε1 exceeds a given value, λ, is plotted as a function of λ and as a function of time relative to the acquisition of the reference frame. Values of this fractional area are shown for data obtained very soon (0 and 18 ms) after tagging, and again for data obtained immediately after peak deceleration, which occurs 70−75 ms later. For example, almost none of the axial or sagittal strain fields exhibit ε1 > 0.03 (roughly speaking, 3% deformation) 18 ms after tagging, but by 78 ms, just after peak deceleration, almost 40% of both strain fields exhibit ε1 > 0.03. A summary of corresponding numerical results from all four experiments is shown in Table 1. Roughly half of the strain field exhibits ε1 > 0.02, a small fraction of the strain field exhibits ε1 > 0.05, and essentially no strains greater than 0.07 are seen. Strain magnitudes are reasonably consistent among subjects and between axial and sagittal planes (although strain values in different planes are not directly comparable).
Figure 7.

Fraction of the area of the strain field in which the maximum principal Lagrangian strain, ε1, exceeds a given value λ. (a) Sagittal area fraction vs λ for various times after tagging. (b) Sagittal area fraction vs time for several strain levels. (c) Axial area fraction vs λ for various times. (d) Axial area fraction vs time for several strain levels. Note that data are not available between 18 ms and 78 ms; strain was not computed during the fast free-fall phase of head motion because of tag line blurring.
Table 1.
The fraction of area in which the maximum principal Lagrangian strain, ε1, exceeds a specific value, λ, during peak deceleration, for λ=0.02, λ=0.05, λ=0.07. Results are given for each test to characterize experimental variability. The same subject performed Test 1 and Test 4 (asterisks).
| Sagittal | Axial | |||||
|---|---|---|---|---|---|---|
| Area fraction | Fraction ε1>0.02 | Fraction ε1>0.05 | Fraction ε1>0.07 | Fraction ε1>0.02 | Fraction ε1>0.05 | Fraction ε1>0.07 |
| Test 1* | 0.541 | 0.072 | 0.013 | 0.423 | 0.058 | 0.017 |
| Test 2 | 0.501 | 0.048 | 0.008 | 0.371 | 0.018 | 0.000 |
| Test 3 | 0.497 | 0.023 | 0.000 | 0.488 | 0.081 | 0.000 |
| Test 4* | 0.539 | 0.030 | 0.000 | 0.593 | 0.000 | 0.000 |
| Mean | 0.520 | 0.043 | 0.005 | 0.469 | 0.039 | 0.004 |
| Std. Dev. | 0.024 | 0.022 | 0.006 | 0.096 | 0.037 | 0.009 |
Discussion
The images of deformation and strain in this paper are explained readily by the following scenario. When the skull decelerates, the brain's center of mass continues to move, but the motion of the base of the brain appears constrained near the sellar and supra-sellar space (see arrow in Figure 4d). Tethering loads may be borne by the vascular, neural, and dural elements which bind the brain to the base of the skull. Such anatomic structures might include the distal internal carotid arteries, the optic nerves, the olfactory tracts, the oculomotor nerves, and the pituitary stalk. All these structures pass through fixed bony or dural rings which restrict their movement. These features attach to or penetrate the more mobile brain parenchyma. As a result, the brain begins to rotate about this region, while material anterior is compressed and material posterior is stretched by inertial effects. As the brain rotates backward and upward relative to the skull, the superior-frontal surface of the brain appears to compress against the top of the cranial vault. Normal forces, tangential forces, and possibly tension in the bridging veins on the superior surface of the brain eventually arrest the rotation of the brain about its base. In doing so, the top of the brain in front of the superior contact region is compressed and pushed forward. Behind the superior points of contact, the brain is elongated as the brain's inertia pulls it backward and clockwise. Finally, behind the basal tethering region, material in the brainstem experiences shortening and shear as the posterior and inferior parts of the brain continue rotating downward and forward.
The observed fields of displacement and strain (Figure 6), particularly anterior compression and posterior stretching, contrast with the expectation that occipital impact would preferentially compress the occipital part of the brain. Our images support the idea that the frontal areas of the brain experience significant deformation before the occipital part of the brain contacts the skull, because of the basal tethering of the brain, and its subsequent rotation upward and backward. This is consistent with the observation that occipital impacts commonly lead to contrecoup injury more severe than the “coup” injury. Our data do not support other explanations of contrecoup injury listed by Pudenz and Shelden (1946) and Gurdjian and Lissner (1961), such as the propagation of a pressure wave, deformation of the skull, cavitation, or the bouncing of the brain back and forth. While some of these effects may be present, at these acceleration levels their contribution would be dwarfed by the effects described above.
The data from this study show that angular acceleration of the skull is not required to cause angular acceleration of the brain. The tangential components of the tethering forces change the angular momentum of the brain about its mass center, causing rotation. White matter is stiffer than gray matter, and therefore strain concentrations are expected at interfaces between the two. This expectation has been supported by observations of more severe local injury near these boundaries (Graham et al., 1995). It is not easy to identify unambiguously such effects in our strain images. However the corpus callosum, which is medial and basal in these images, appears to follow more closely the motion of the skull than the more compliant gray matter that deforms around it.
This study builds explicitly on the work of Holbourn et al. (1943), Pudenz and Shelden (1946), Margulies et al. (1990), Meaney et al. (1995) and Hardy et al. (2001). A concise comparison between these earlier studies and the current study is provided in Table 2. The current measurements of human brain motion are generally consistent with Holbourn's (1943) seminal observations of gel deformation in a rotated human skull. Our data are also in accord with the observations of motion on the surface of the macaque brain made by Pudenz and Shelden (1946). The use of MR imaging to visualize deformation in an arbitrary interior plane of the live human brain addresses major shortcomings of these earlier studies. Holbourn (1943) was restricted by his use of a surrogate material with unrealistic suspension in a model skull, and Pudenz and Shelden (1946) could only observe the superior surface of the macaque brain. Furthermore, rather than qualitative or relative observations, the use of MR tagging and HARP strain analysis in the current study provides quantitative strain measurements that can be used to guide computer simulations or in vitro experiments.
Table 2.
Comparison of studies of acceleration-induced brain deformation.
| |
Methods / Acceleration |
Measurements / Deformation |
|---|---|---|
| Holbourn (1943) | Gel in human skull model | Qualitative strain fields |
| Angular acceleration | Unknown strain magnitude | |
| |
Unknown accel. magnitude |
|
| Pudenz and Shelden (1946) | Transparent calvarium in macaque monkey | Qualitative displacement images |
| Impact | Few mm relative displacement | |
| |
Unknown accel. magnitude |
|
| Margulies et al. (1990) | Gel in human and baboon skull. | Shear strain |
| Angular acceleration | 0.1 − 0.2 max. shear strain | |
| |
3.7×10³ − 7.0×10⁴ rad/s2 |
|
| Meaney et al. (1995) | Gel in miniature pig skull | Shear strain |
| Angular acceleration | ∼0.3 max. shear strain | |
| |
5×10⁴ − 2.0×10⁵ rad/s2 |
|
| Hardy et al. (2001) | Cadaver — high speed x-ray | Marker displacement |
| Impact | ∼5 mm relative displacement | |
| Linear accel.: 102−103 m/s2 | ||
| |
Angular accel.: 103−104 rad/s2 |
|
| Current study | Human - in vivo, MRI tagging | Lagrangian strain tensor |
| Impact | 0.02−0.05 max. principal strain | |
| Linear accel.: 20−30 m/s2 |
The more recent quantitative studies of gel deformation in human and baboon skulls (Margulies et al., 1990) and in the porcine skull (Meaney, 1995) under angular acceleration, directly motivate and underlie the current work. These studies provide estimates of shear strain in gels induced by angular accelerations at levels associated with concussion or diffuse axonal injury (Meaney et al., 1995). In both of these studies, strain was estimated by measuring the deformation of grid lines inscribed on the gel. The current study extends the approach of Margulies et al. (1990) and Meaney et al. (1995) by using MR tagging to “inscribe” a grid of lines non-invasively in brain tissue, thus enabling images to be acquired in vivo in humans.
The current study also complements the work of Hardy et al. (2001), who measured displacement of the cadaveric brain at eleven points during moderately severe impacts. Hardy et al. (2001) replicate the conditions of human brain injury more closely than any other study of brain deformation, although there may be significant differences between the cadaver and the live human (Margulies and Meaney, 1998; Hardy et al., 2001). In Hardy et al. (2001) the spatial resolution of measurements is too low to estimate the strain tensor, and measurements are restricted to one plane. In comparison, the spatial resolution of the current study is much higher (points on a regular grid with 5 mm spacing are tracked), but temporal resolution is lower (6 ms/frame, as opposed to 4 ms/frame or 1 ms/frame), and accelerations are limited to sub-injury levels. The current approach provides sufficient spatial resolution for estimation of strain fields, it can be applied in arbitary sagittal or axial planes, and it can be used in the live human subjects.
The MR tagging approach has been used recently by Ji et al. (2004) to estimate displacements of the brain due to quasi-static changes in neck flexion and head position. As in the current study, the HARP method was used to track displacements of specific points. However, Ji et al. (2004) do not investigate acceleration-induced displacement or estimate strain.
The current approach has several important limitations. The accelerations used in this study, and the strains observed, are both well below those observed to cause injury (Bain and Meaney, 2000, Zhang et al., 2004, Margulies and Thibault, 1992). While this is a necessary practical feature of these experiments, brain matter and meningeal tissue will likely respond differently (nonlinearly) at higher strains and strain rates. Other effects, such as skull deformation and associated pressure waves may become relatively more important in more severe impacts.
We present only 2-D apparent strain fields when deformation is actually 3-D. In our axial images, out-of-plane motion clearly occurs as the head rotates approximately 6 degrees. However, very little motion occurs perpendicular to the sagittal image plane, as shown by our axial slices. The number of repetitions required to produce 3-D strain fields by applying our current technique to multiple slices is prohibitive. It should be possible to reduce the number of acquisitions required by acquiring only spatial frequencies near that of the tagging pattern. Increased temporal resolution would be desirable for acquisition of images at speeds required for actual injury, for example in cadaver or animal acceleration injury models. Images obtained in our studies exhibited some blurring when velocity was highest (during the 30−40 ms period before peak deceleration) and were not analyzed in this study. The current resolution, 6 ms/frame, is clearly able to capture temporal variations in strain immediately after peak deceleration (Figures 6 and 7). The number of subjects (n=3) and experiments (m=4) in this study was limited by the expense of MRI facility time, including both imaging and set-up time, and by the laborious nature of the experiment, which required motivated and reliable subjects. However, the strain fields in these four experiments are qualitatively and quantitatively (Table 1) similar.
Like all estimation methods, the HARP approach has inherent limits to its accuracy, which may depend on image quality and parameter choices. Bayly et al. (2004) evaluated the HARP method using data from physical models and simulation. For a simulation of a uniform strain state (εxx = 0, εyy = 0.005, εxy = 0.05) the elements of the estimated strain tensor were within 0.002 strain (0.2% strain) of the exact values. Errors in strain are more likely to occur near borders where tag lines end and are harder to track (Bayly et al., 2004). The inherent error in the HARP method in this particular application can be estimated from variations in strain amplitude in images where almost no deformation is expected. In this study, such strain fields are seen at 18 ms in Figure 6, before the brain has had a chance to deform. Based on the small variations in these fields, as well as on the work of Bayly et al. (2004) we are confident that intrinsic variation in strain estimates in this experimental study is less than 1% strain (0.01 strain).
This study provides the first quantitative images of acceleration-induced strain fields in the human brain. The results of this study will have immediate application in the validation and testing of numerical models of brain trauma. Numerical models offer an appealing way to evaluate safety standards and develop protective equipment, but simulations are useful only if they are known to be accurate. Our data provide clear evidence of the basic mechanism of contrecoup injury: brain rotation constrained by basal and frontal tethering, an idea discussed over 50 years ago by Holbourn (1943) and by Pudenz and Shelden (1946) but never directly confirmed. The current approach may be used to study deformation during other head movements typical of TBI, and to explore hypotheses concerning imposed strains and subsequent neurodegeneration in animal models.
Acknowledgements
This work was supported in part by the U.S. Department of Transportation, National Highway Traffic Safety Administration Grant No. DTNH22-01-H-07551 and/or the Federal Highway Administration grant No. FHWA ICRC(1) to the Southern Consortium on Injury Biomechanics at the University of Alabama at Birmingham. Technical assistance from Richard Nagel, Glenn Foster, John Kreitler and Dennis Tapella is gratefully acknowledged. James Skeath and Brian Bayly provided many valuable suggestions.
References
- Axel L, Dougherty L. MR imaging of motion with spatial modulation of magnetization. Journal of Biomechanics. 1989;171(3):841–845. doi: 10.1148/radiology.171.3.2717762. [DOI] [PubMed] [Google Scholar]
- Bain AC, Meaney DF. Tissue-level thresholds for axonal damage in an experimental model of central nervous system white matter injury. Journal of Biomechanical Engineering. 2000;122:615–622. doi: 10.1115/1.1324667. [DOI] [PubMed] [Google Scholar]
- Bayly PV, Ji S, Song S-K, Okamoto RJ, Massouros P, Genin GM. Measurement of strain in physical models of brain injury: A method based on HARP analysis of tagged magnetic resonance images. Journal of Biomechanical Engineering. 2004;126(4):523–528. doi: 10.1115/1.1785811. [DOI] [PMC free article] [PubMed] [Google Scholar]
- Geddes DM, Cargill RS, LaPlaca MC. Mechanical stretch to neurons results in a strain rate and magnitude-dependent increase in plasma membrane permeability. Journal of Neurotrauma. 2003;20(10):1039–1049. doi: 10.1089/089771503770195885. [DOI] [PubMed] [Google Scholar]
- Graham DI, Adams JH, Nicoll JAR, Maxwell WL, Gennarelli TA. The nature, distribution and causes of traumatic brain injury. Brain Pathology. 1995;5:397–406. doi: 10.1111/j.1750-3639.1995.tb00618.x. [DOI] [PubMed] [Google Scholar]
- Gurdjian ES, Lissner HR. Photoelastic confirmation of the presence of shear strains at the craniospinal junction in closed head injury. Journal of Neurosurgery. 1961;18:58–60. doi: 10.3171/jns.1961.18.1.0058. [DOI] [PubMed] [Google Scholar]
- Hardy WN, Foster CD, Mason MJ, Yang KH, King AI, Tashman S. Investigation of head injury mechanisms using neutral density technology and high-speed biplanar X-ray. Stapp Car Crash Journal. 2001;45:337–368. doi: 10.4271/2001-22-0016. [DOI] [PubMed] [Google Scholar]
- Holbourn AHS. The mechanics of head injuries. Lancet. 1943:438–441. [Google Scholar]
- Ji S, Zhu Q, Dougherty L, Margulies SS. In vivo measurements of human brain displacement. Stapp Car Crash Journal. 2004;48(04S38):1–11. doi: 10.4271/2004-22-0010. [DOI] [PubMed] [Google Scholar]
- Kraitchman DL, Sampath S, Castillo E, Derbyshire JA, Boston RC, Bluemke DA, Gerber BL, Prince JL, Osman NF. Quantitative ischemia detection during cardiac magnetic resonance stress testing by use of FastHARP. Circulation. 2003;107:2025–2030. doi: 10.1161/01.CIR.0000062684.47526.47. [DOI] [PubMed] [Google Scholar]
- Kuijer JPA, Jansen E, Marcus JT, van Rossum AC, Heethaar RM. Improved harmonic phase myocardial strain maps. Magnetic Resonance in Medicine. 2001;46:993–999. doi: 10.1002/mrm.1286. [DOI] [PubMed] [Google Scholar]
- Liu W, Chen J, Ji S, Allen S, Bayly PV, Wickline SA, Yu X. HARP MRI tagging for direct quantification of Lagrangian strain in rat hearts after myocardial infarction. Magnetic Resonance in Medicine. 2004;52(6):1282–1290. doi: 10.1002/mrm.20276. [DOI] [PubMed] [Google Scholar]
- Margulies SS, Meaney DF. Brain tissues. In: Black J, Hastings G, editors. Handbook of Biomaterial Properties. Chapman and Hall; London: 1998. pp. 70–80. [Google Scholar]
- Margulies SS, Thibault LE, Gennarelli TA. Physical model simulations of brain injury in the primate. Journal of Biomechanics. 1990;23:832–836. doi: 10.1016/0021-9290(90)90029-3. [DOI] [PubMed] [Google Scholar]
- Margulies SS, Thibault LE. A proposed tolerance criterion for diffuse axonal injury in man. Journal of Biomechanics. 1992;25:7–23. doi: 10.1016/0021-9290(92)90231-o. [DOI] [PubMed] [Google Scholar]
- Meaney DF, Smith DH, Ross DT, Gennarelli TA. Biomechanical analysis of experimental diffuse axonal injury in the miniature pig. Journal of Neurotrauma. 1995;12(4):689–695. doi: 10.1089/neu.1995.12.689. [DOI] [PubMed] [Google Scholar]
- Morrison B, III, Meaney DF, Margulies SS, McIntosh TK. Dynamic mechanical stretch of organotypic brain slice cultures induces genomic expression: relationship to mechanical parameters. Journal of Biomechanical Engineering. 2000;122:224–230. doi: 10.1115/1.429650. [DOI] [PubMed] [Google Scholar]
- Naunheim R, Bayly PV, Standeven JW, Neubauer JS, Lewis LM, Genin GM. Linear and angular accelerations during heading of a soccer ball. Medicine and Science in Sports and Exercise. 2003;35(8):1406–12. doi: 10.1249/01.MSS.0000078933.84527.AE. [DOI] [PubMed] [Google Scholar]
- Osman NF, McVeigh ER, Prince JL. Imaging heart motion using harmonic phase MRI. IEEE Transactions on Medical Imaging. 2000;19(3):186–202. doi: 10.1109/42.845177. [DOI] [PubMed] [Google Scholar]
- Pudenz RH, Shelden CH. The Lucite calvarium – a method for direct observation of the brain. Journal of Neurosurgery. 1946;3:487–505. doi: 10.3171/jns.1946.3.6.0487. [DOI] [PubMed] [Google Scholar]
- Ruan JS, Khalil T, King AI. Human head dynamic response to side impact by finite element modeling. Journal of Biomechanical Engineering. 1991;113(3):276–283. doi: 10.1115/1.2894885. [DOI] [PubMed] [Google Scholar]
- Shaw NA. The neurophysiology of concussion. Progress in Neurobiology. 2002;67:281–344. doi: 10.1016/s0301-0082(02)00018-7. [DOI] [PubMed] [Google Scholar]
- Smith DH, Wolf JA, TA Lusardi TA, Lee VM, Meaney DF. High tolerance and delayed elastic response of cultured axons to dynamic stretch injury. Journal of Neuroscience. 1999;19(11):4263–4269. doi: 10.1523/JNEUROSCI.19-11-04263.1999. [DOI] [PMC free article] [PubMed] [Google Scholar]
- Zerhouni EA, Parish DM, Rogers WJ, Yang A, Shapiro EP. Human heart tagging with MR imaging – a method for noninvasive assessment of myocardial motion. Radiology. 1988;169:59–63. doi: 10.1148/radiology.169.1.3420283. [DOI] [PubMed] [Google Scholar]
- Zhang L, Yang KH, King AI. A proposed injury threshold for mild traumatic brain injury. Journal of Biomechanical Engineering. 2004;126(2):226–236. doi: 10.1115/1.1691446. [DOI] [PubMed] [Google Scholar]