

Abstract
Continuous-flow inlets from oxidation reactors are commonly used systems for biological sample introduction into isotope ratio mass spectrometers (IRMS) to measure 13C enrichment above natural abundance. Because the samples must be volatile enough to pass through a gas chromatograph, silylated derivatization reactions are commonly used to modify biological molecules to add the necessary volatility. Addition of a t-butyldimethylsilyl (TBDMS) group is a common derivatization approach. However, we have found that samples do not produce the expected increment in measured 13C abundance as the TBDMS derivatives. We have made measurements of 13C enrichment of leucine and glutamate standards of known 13C enrichment using derivatives without silicon (N-acetyl n-propyl ester), with silicon (TBDMS), and an intermediate case. The measurements of 13C in amino acids derivatized without silicon were as expected. The 13C enrichment measurements using the TBDMS derivative were higher than expected, but could be corrected to produce the expected 13C enrichment measurement by IRMS if one carbon was removed per silicon. We postulate that the silicon in the derivative forms silicon carbide compounds in the heated cupric oxide reactor, rather than forming silicon dioxide. Doing so reduces the amount of CO2 formed from the carbon in the sample. Silylated derivatives retain carbon with the silicon and must be used carefully and with correction factors to measure 13C enrichments by continuous-flow IRMS.
INTRODUCTION
Isotope ratio mass spectrometry (IRMS) has been used since the 1940’s to determine 13C abundance at natural levels. The technology did not change significantly until resurgence for measurement of 13C tracer molecules in biological samples in the 1980’s using continuous flow systems.1–4 The key advantage of IRMS has always been its sensitivity to measure very fine differences in 13C abundance, but its key limitation is that IRMS only measures 13C in CO2. All compounds to be measured must be isolated, purified and oxidized to CO2 prior to measurement by IRMS. Because biological compounds usually exist in complex matrices (e.g. blood), isolation of a specific compound in sufficient quantities for IRMS measurement is difficult. However, the introduction of gas chromatography-combustion-IRMS (GC-C-IRMS) resolved these problems.5 The GC-C-IRMS puts a GC in front to provide separation of mixtures of compounds, prior to their oxidation in the flow-through combustion tube and entrance into the IRMS.4,6,7 The introduction of samples by a continuous flow of helium carrier gas allows delivery of very small amounts of sample into the IRMS and greatly improves the sensitivity of the IRMS to measure 13CO2 from metabolites in biological matrices.4 However, most biological compounds must be chemically modified (“derivatized”) to make them volatile enough to pass through the GC prior to measurement.8 A popular derivatization approach is to form the t-butyl dimethyl silyl (TBDMS) derivative. Because the TBDMS group can be attached to almost all functional groups, it is a good choice for derivatizing polyfunctional species, such as amino acids.9,10
The derivatization process, however, adds C to the molecule, and this C becomes part of the total C measured when the compound is oxidized to CO2. The 13C abundance of the core molecule can be determined if the 13C abundance of the derivative is known. In many cases, it is not. However, most biological applications using GC-C-IRMS make measurements of 13C-labeled compounds are administered to animals or humans as tracers for the purpose of determining in vivo kinetics. For 13C tracer applications, it is simple enough to prepare a standard curve of known 13C-tracer content (either mole fraction of 13C tracer against unlabeled or mole ratio of 13C tracer against unlabeled) by mixing known amounts of the 13C-labeled compound with known amounts of unlabeled compound. These standard samples are derivatized and measured by GC-C-IRMS.
Because the C added by the derivative adds to the total CO2 produced when the derivatized compound is oxidized, the measured 13C/12C ratio of the tracer will be reduced by the amount of C added by the derivatization process. This effect is seen by plotting the measured 13C mole fraction from the GC-C-IRMS against the 13C mole fraction of the tracer dilution standards. A 1:1 response (slope of unity) of the IRMS system is expected for 13C/12C measurement. However, the slope of the line of the IRMS-measured 13C enrichment from the CO2 versus the prepared 13C-labeled to unlabeled ratio of the standards will be less than unity by the amount of C added from the derivative. This dilution can be corrected because we know the total number of unlabeled and labeled carbons in the molecule. A simple mass balance equation can be used to convert from the 13C content of the total molecule to the 13C content for the specific carbons in the molecule that are labeled. Doing so will change the measured slope upward to equal unity.
Because a CO2 gas of known 13C content is pulsed into the ion source during a GC-C-IRMS run to define and normalize the 13C/12C ratio measurement, many investigators do not prepare and run standard curves of their 13C-labeled tracers. They assume that the response of the IRMS will be 1:1 in terms of the measured 13C/12C ratio for the amount of 13C put in. This assumption is correct, with certain exceptions that have nothing to do with the IRMS system. Our practice is to compare our GC-C-IRMS measurements against standards of known 13C content of every new tracer and derivative we use. Normally we obtain the expected 1:1 13C response from the GC-C-IRMS, after adjusting for the amount of C added to the compound by the derivatization. However, when we began measuring TBDMSderivatives of 13C-labeled amino acids, we observed slopes significantly greater than unity after correcting for total C. We believe these higher-than-unity slopes occur because silicon in the TBDMS sequesters C in the combustion tube during the oxidation process; i.e. the silicon does not oxidize completely in the combustion tube to SiO2, but forms silicon carbide complexes. Silicon carbide formation reduces the amount of total CO2 formed from the sample and alters the conversion calculations of measured 13C tracer enrichment. This paper presents the data to confirm this hypothesis.
EXPERIMENTAL SECTION
Instrumentation and conditions
A Finnigan Delta Plus (Finnigan MAT, Bremen, Germany) GC-C-IRMS with a GCC-III interface and a HP6890 gas chromatograph (Agilent, Palo Alto, CA) was exclusively used. Samples were injected by a CTC-A200S autosampler (CTC Analytics, Zwingen, Switzerland) mounted to the HP6890 GC. The effluent from the GC passed immediately into and through a standard Finnigan alumina oxidation tube (0.5-mm i.d. x 1.55-mm o.d. x 320 mm) containing of cupric oxide wires, 240 mm in length. The oxidation tube was held at 960 °C. The effluent then passed through a water separator consisting of a Nafion® tube in the GCC-III interface prior to entering the mass spectrometer.
The GC column used for all measurements was a 30-m x 250-μm i.d., 0.250-μm film thickness Zebron ZB-5 (Phenomenex, Torrance, CA) fused-silica capillary column. For measuring leucine samples, a 20:1 split of sample in the inlet, a helium column flow of 2.2 ml/min, and an inlet temperature of 265 °C were used. The GC temperature program was an initial temperature of 160 °C, increased to 190 °C at 2 °C/min. For glutamate samples, a 35:1 inlet split at 265 °C and a helium flow of 2.2 ml/min were used. The GC program was 162 °C isothermal for 11 min followed by ramping the temperature to 200 °C for 5 min. For all samples, 1 μl was injected into the GC. The effluent from the GC was diverted away from the oxidation oven during the initial period of solvent elution and out a divert valve to the atmosphere while helium was passed backwards through the oxidation tube. After the solvent had completely eluted from the column, the divert valve was automatically closed, and the GC effluent returned to passing through the oxidation tube. During the solvent-divert period, CO2 gas of known 13Ccontent was automatically cycled into the IRMS and its 13C/12C ratio measured. After the solvent-divert period, the effluent from the GC and oxidation tube entered the IRMS. The IRMS automatically measured the ion intensities of m/z = 44, 45, and 46 in its three Faraday cups, corresponding to 13C16O2, 13C16O2, and 12C16O18O, respectively. The Finnigan Isodat data system automatically computed the 13C/12C and 18O/16O ratios of each sample peak, referenced to the standard CO2 gas and its known 13C/12C and 18O/16O content. These data were then used here for the various samples measured.
Reagents and chemicals
Triethylamine, 1-propanol, acetic anhydride, ethyl acetate, acetyl chloride, and acetone at >99% purity were obtained from Sigma-Aldrich (St. Louis, MO). Acetonitrile at 99.99% purity was purchased from EM Science (Gibbstown, NJ). N-Methyl-N-(t-butyldimethylsilyl)-trifluoroacetamide (MTBSTFA) was purchased from Regis Technologies (Morton Grove, IL).
L-[1,2-13C2]Leucine was purchased from Mass Trace (Woburn, MA), and L-[1,2-13C2]glutamic acid was purchased from Cambridge Isotope Laboratories (Andover, MA). The [1,2-13C2]leucine was measured by gas chromatography-mass spectrometry (GCMS) to have a chemical purity of 100% and a 13C isotopic content of 98.4% in carbon positions 1 and 2. The [1,2-13C2]glutamic acid was measured by GCMS to have a chemical purity of 95.3% and a 13C isotopic content of 97.5% in carbon positions 1 and 2. Unlabeled L-leucine and L-glutamate were purchased from Sigma-Aldrich with an assumed chemical purity of >99%.
Quantitative solutions of [1,2-13C2]leucine and [1,2-13C2]glutamate were prepared by weighing containers before and after aliquots of the labeled amino acids and distilled water were added. Three standards of known 13C content in the range of 0 – 0.6 mole % excess (mpe) [1,2-13C2]leucine and [1,2-13C2]glutamate were prepared in a two-step process. First containers were weighed before and after adding amounts of the [1,2-13C2]leucine or [1,2-13C2]glutamate standard solutions. Next amounts of unlabeled leucine or glutamate were added to the containers, and the containers weighed again. Unlabeled standards were made by adding no labeled material. Distilled water was then added to the containers to dilute the leucine or glutamate to concentrations of ~30 mM. About ~1 μmol aliquots of these various solutions were taken for derivatization and measurement.
Reagent solutions were first prepared for the formation of the N-acetyl n-propyl ester (NAP) derivatives described below. Propylating reagent was formed by mixing acetyl chloride with ice-cold propanol at a ratio of 6.25:1 with constant stirring. Acetylating agent was prepared by mixing acetone, triethylamine, and acetic anhydride in the ratio of 5:2:1 with constant stirring.
Derivatization of amino acids
Leucine and glutamate samples were derivatized in 2-ml conical-bottom glass screw-cap vials as the NAP and TBDMS esters. In addition, a third derivative type was made that was mixture of the NAP and TBDMS (designated “mixed”). For preparation of the NAP derivatives, aqueous aliquots of the amino acids were taken and dried under nitrogen gas in the 2-ml vials. Propylating reagent (350 μl) was added to each vial, and the vials were capped and heated at 75 °C for 35 min. The reagents were evaporated from the vials by drying under a stream of nitrogen gas. Next, 500 μl of acetylating reagent was added, the vials were capped and heated at 75 °C for 35 min. The reagent was then removed by evaporation under a stream of nitrogen. Sufficient ethyl acetate was added to the vials as the final solvent to give an amino acid concentration of 9 nmol/μl.
TBDMS derivatives were prepared by first drying aqueous aliquots of the amino acids under nitrogen gas. A 50-μL 1:1 mixture of MtBSTFA:acetonitrile was added to each of the vials, and the vials were capped and heated at 100 °C for 40 min. Additional acetonitrile was added to obtain a final amino acid concentration of 9 nmol/μl.
The “mixed” derivatives were formed by first drying aqueous aliquots of the amino acids under a nitrogen gas in the vials, and propylated as described above. After the propylating mixture had been evaporated under a stream of nitrogen gas, a 50-μL mixture of the 1:1 MtBSTFA:acetonitrile was then added to each of the vials, and the vials were capped and heated at 100 °C for 30 minutes. Acetonitrile was added to obtain a final amino acid concentration of 9 nmol/μl.
Rationale for derivative and amino acid choices
The NAP derivative was chosen because it adds no silicon and could be used to compare the effects of adding silicon by the TBDMS derivative. As shown in Table 1, the NAP derivative adds an acetyl group to the amino-N and a propyl group to the carboxyl. The TBDMS derivative adds a TBDMS group to both amino-N and carboxylic acid functional groups. The “mixed” derivative was chosen to form an intermediate case: one TBDMS group added to the amino-N and a propyl group to the carboxylic acids (Table 1). Leucine was chosen as one test amino acid because it has a single carboxylic acid and amino group without any additional functional groups (Figure 1). Glutamate was chosen because it has two carboxylic acids and a single amino group (Figure 1). The number of silyl groups range from 0 – 3 for the two amino acids and three derivative types (Table 1). The key difference between glutamate and leucine is both the number of silyl derivatives added and the location. These differences provide enough different cases for study to define whether an effect of silicone is specific to amino-N bonded silyl, O-bonded silyl, or equally similar for both types.
Table 1.
Carbon Content of the Different Leucine and Glutamate Derivatives Testeda
| Derivative species added to the | Number of carbons | Number of silicons | |||||
|---|---|---|---|---|---|---|---|
| Amino acid core | Derivative type | Amino-N | Carboxyl group | Core | Derivative | Total | |
| Leucine | NAP | CH3CO- | -C3H7 | 6 | 5 | 11 | 0 |
| TBDMS | -Si(CH3)2C4H9 | -Si(CH3)2C4H9 | 6 | 12 | 18 | 2 | |
| mixed | -Si(CH3)2C4H9 | -C3H7 | 6 | 9 | 15 | 1 | |
| Glutamate | NAP | CH3CO- | -C3H7 | 5 | 8 | 13 | 0 |
| TBDMS | -Si(CH3)2C4H9 | -Si(CH3)2C4H9 | 5 | 18 | 23 | 3 | |
| mixed | -Si(CH3)2C4H9 | -C3H7 | 5 | 12 | 17 | 1 | |
NAP = N-acetyl n-propyl ester; TBDMS = t-butyldimethylsilyl ester; and mixed = N-acetyl t-butyldimethylsilyl ester.
Figure 1.

Chemical structures of leucine and glutamic acid with the location of the derivative shown. The derivative located on the amino-N is marked with an XN and derivative on the carboxyl group is marked with an XO. The structure of XN and XO vary with the derivative type and are shown in Table 1. Note that glutamate contains two carboxylic groups and will have two XO units attached for each derivative used.
Experiments
Derivatives were prepared for each of the [1,2-13C2]leucine and [1,2-13C2]glutamate enrichment standard solutions for each derivative type: NAP, TBDMS, and “mixed”. Each of these derivatives was then injected into the GC-C-IRMS in replicate. Pulses of CO2 reference gas of known 13C content were also admitted several times during each GC-C-IRMS run. The peaks for both the reference gas and the samples were automatically integrated by the data system on each run and the 13C content of each sample peak determined in units relative to the reference gas measurements:
| (1) |
where Rsample and Rref are the GC-C-IRMS measured 13C/12C ratios of the sample and reference gas CO2 peaks, respectively. The δ13C(ref) was corrected for 17O contributions. Because the reference tank gas had been standardized to PDB, the δ13C(ref) was converted to a delta value referenced to PDB (δ13C(PDB)). All of these calculations were performed automatically by the Finnigan Isodat data system.
The 13C/12C ratio of the sample was then calculated from its measured delta value by rearranging equation 1:
| (2) |
where (13C/12C)PDB was assumed to be 0.0112372. The (13C/12C)sample ratio values for each measurement were then used in the calculations outlined below.
Enrichment calculations
The 13C/12C-measured ratio of each sample was converted to 13C abundance (F):
| (3) |
This 13C abundance is the abundance of 13C in the entire molecule and is usually expressed as atom % 13C. This abundance can be separated into the portion that is labeled with 13C and that which is not by simple mass balance:
| (4) |
where N is the total number of carbons in the derivatized molecule, nl is the number of carbons that are labeled with 13C in the molecule, Fu is the 13C abundance of the unlabeled carbons and Fl is the 13C abundance of the carbon in the positions containing the labels (always positions 1 and 2 in the amino acid samples used in this study).
This equation can be simplified by considering only the 13C in excess of natural abundance in the sample, i.e. subtracting the natural abundance contribution (N·Fu) from both sides. Doing so reduces equation 4 to:
| (5) |
This subtraction is normally done by measuring an unlabeled sample (sample 0) of natural 13C abundance (F0) and subtracting this 13C abundance from all other samples. This subtraction gives the 13C enrichment in excess above natural abundance: E = F – F0, usually expressed as atom % excess 13C (ape). Substituting, F0 for Fu in equation 5, gives
| (6) |
where E is the enrichment in excess of natural abundance in the whole molecule and El is the enrichment in excess of natural abundance of the labeled C in the molecule. This equation can be rearranged to determine the average 13C enrichment in the labeled portion of the molecule in excess of natural abundance (El=Fl–F0) relative the measured 13C enrichment of the whole molecule:
| (7) |
The 13C enrichment in the labeled positions of each standard (Fl) was defined from the amounts of unlabeled and labeled amino acids mixed together for each standard using the following mass-balance dilution equation:
| (8) |
where x(l) and x(u) are the amounts of labeled amino acid and unlabeled amino acid, respectively, in the solution in moles and Fl(l) is the GCMS determined average 13C enrichment in atom % in the labeled positions of the labeled amino acid. Note that Fl is the enrichment in atom % of the 13C in the labeled positions in the molecule, be it leucine or glutamate standards. The enrichment of 13C in the whole molecule is lower due to the presence of unlabeled C from the other carbons in the amino acid that are not labeled and the addition of C from the derivatives. The enrichment of 13C in the whole molecule (F) can be calculated from Fl according to equation 4 above. The 13C enrichment above natural abundance (atom % excess) in the labeled positions of these standards is simply El = Fl – F0 where F0 is the natural abundance 13C value defined above.
Statistics
Linear least-square regression analyses were performed on each standard curve measured. Standard errors of both the intercept and slope were calculated in the process. From these data, the slope of each regression line was tested by a two-tailed t-test for being different from unity.11 A P-value < 0.05 was used to indicate significance. All data are expressed as mean ± standard error or ±standard deviation, as indicated.
RESULTS
Simple GC programs were used to measure all three derivatives for leucine and for glutamate. Figure 2 shows the GC-C-IRMS time course of each of the three different leucine derivatives eluting from the column and being measured by the GC-C-IRMS system. The figure is a composite of three injections: one for each derivative type. Each trace is offset from the other on the y-axis to make them distinguishable. The peaks that appear as “square-waves” in each of the traces represent the automatic injection of the CO2 reference gas. Although the m/z = 44, 45 and 46 signal intensities are simultaneously recorded by separate Faraday cups, only the m/z = 44 signal intensity is shown in Figure 2. The elution order of the different leucine derivatives was NAP, “mixed”, and TBDMS.
Figure 2.
Time course of leucine measured by GC-C-IRMS. The graph plots the intensity versus time of the m/z = 44 CO2+ ion signal. The graph is a composite of three injections: one for each derivative type. The three injections are deliberately offset from each other on the y-axis to make the three traces distinguishable. The “square wave” peaks are injection of the reference tank CO2 gas into the system (denoted “Ref CO2”) and occur before and after elution of each of the leucine derivatives. Elution order of the leucine derivatives was N-acetyl n-propyl ester (NAP), t-butyldimethylsilyl n-propyl ester (“mixed”), and bis-t-butyldimethylsilyl ester (TBDMS).
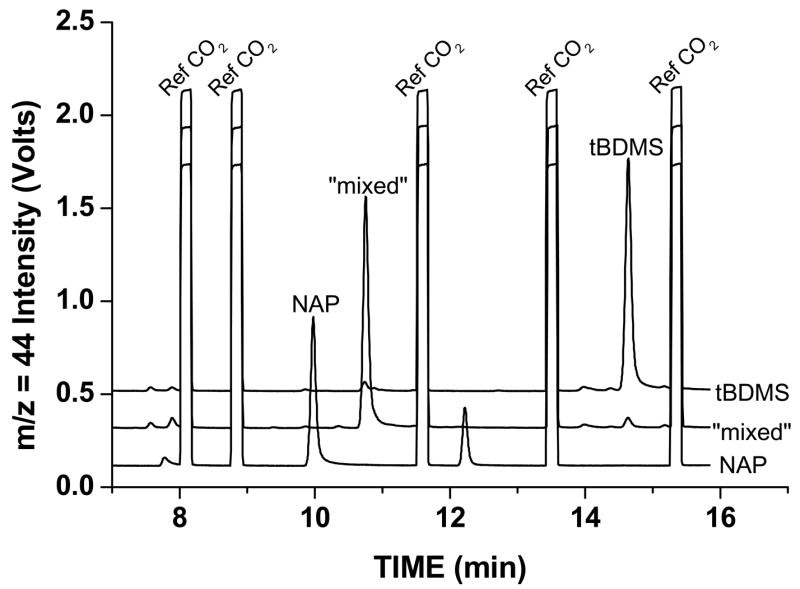
Figure 3 shows the time course of the three different glutamate derivatives eluting and being measured (m/z = 44) by the GC-C-IRMS system. Different GC programs and placement of reference CO2 peaks were used for glutamate compared to leucine. The elution order of the glutamate derivatives was NAP, “mixed”, then TBDMS.
Figure 3.

Time course of glutamate measured by GC-C-IRMS. The graph plots the intensity versus time of the m/z = 44 CO2+ ion signal. The graph is a composite of three injections: one for each derivative type. The three injections are deliberately offset from each other on the y-axis to make the three traces distinguishable. The “square wave” peaks are injection of the reference tank CO2 gas into the system (denoted “Ref CO2”) and occur before and after elution of each of the leucine derivatives. Elution order of the glutamate derivatives was N-acetyl n-propyl ester (NAP), t-butyldimethylsilyl n-propyl ester (“mixed”), and tris-t-butyldimethylsilyl ester (TBDMS).
The measurements of the [1,2-13C2]leucine standards for each derivative type are shown in Table 2. The three samples are an unlabeled leucine sample and two unlabeled leucine samples to which small amounts of [1,2-13C2]leucine have been added (Std 1 and Std 2). The enrichments of the standards are defined relative to the unlabeled leucine and are 0.193 and 0.365 atom % excess for Std 1 and Std 2, respectively. These enrichments are the average 13C enrichment in the 1- and 2-C in the [1,2-13C2]leucine (El) and are the same among the different derivatives. When these standards are oxidized to CO2, their enrichments (E) are less than the enrichment in the labeled positions due to dilution of C both in the leucine and that C added by the derivative. The expected 13C enrichments are shown for each standard and derivative type in Table 2. The E values vary by derivative for two enriched standards.
Table 2.
GC-C-IRMS Leucine Data for the Three Derivatives Testeda
| Expected 13C enrichment
|
Measured 13C enrichment
|
||||||
|---|---|---|---|---|---|---|---|
| Sample ID | Derivative Type | E (ape) | El(ape) | δ13CPDB (per mil) | F (atom %) | E (ape) | El ape) |
| Natural | NAP | 0.0000 | 0.0000 | −31.95 ± 0.45 | 1.0761 ± 0.0005 | 0.0000 | 0.0000 |
| Std 1 | NAP | 0.0350 | 0.1928 | 1.04 ± 0.21 | 1.1124 ± 0.0002 | 0.0363 | 0.1994 |
| Std 2 | NAP | 0.0663 | 0.3647 | 27.95 ±0.48 | 1.1419 ± 0.0005 | 0.0658 | 0.3620 |
| Natural | “mixed” | 0.0000 | 0.0000 | −28.12 ± 0.23 | 1.0803 ± 0.0003 | 0.0000 | 0.0000 |
| Std 1 | “mixed” | 0.0257 | 0.1928 | −2.48 ± 0.50 | 1.10851 ± 0.0006 | 0.0257 | 0.2115 |
| Std 2 | “mixed” | 0.0486 | 0.3647 | 19.93 ± 0.29 | 1.1331 ± 0.0003 | 0.0486 | 0.3961 |
| Natural | tBDMS | 0.0000 | 0.0000 | −27.77 ± 0.19 | 1.0809 ± 0.0002 | 0.0000 | 0.0000 |
| Std 1 | tBDMS | 0.0214 | 0.1928 | −5.81 ± 0.10 | 1.1049 ± 0.0001 | 0.0214 | 0.2172 |
| Std 2 | tBDMS | 0.0405 | 0.3647 | 14.14 ± 0.31 | 1.1268 ± 0.0003 | 0.0405 | 0.4145 |
E = 13C enrichment in the entire derivatized molecule; El = 13C enrichment in the two labeled carbons (C-1 and C-2) in the leucine; F = the measured 13C in the derivatized molecule; NAP = N-acetyl n-propyl ester; TBDMS = t-butyldimethylsilyl ester; and mixed = N-acetyl t-butyldimethylsilyl ester.
The GC-C-IRMS data system automatically calculates the 13C content of each sample as δ13C versus PDB. These values are shown in Table 2 as measured, then were converted first to mole fraction of 13C (F), then to enrichment of 13C in the whole molecule (E), and finally to 13C enrichment in the labeled positions. This latter measured term (El) is independent of the amount of C added by the derivative and makes it possible to compare measurements among derivatives. The measured El enrichments in Table 2 are plotted in Figure 4 against the expected El enrichment values for each standard and derivative type. The anticipated result is that a 1-unit increase in 13C enrichment will produce a 1-unit increase in measured 13C enrichment. The slope of the measured versus expected 13C enrichment for the NAP-leucine derivative was as predicted: not distinguishable from unity (Figure 4). However, the slopes for both the mixed derivative and the TBDMS derivative were significantly greater than unity and significantly greater than the NAP-leucine slope.
Figure 4.

Plot of the measured 13C enrichment versus expected 13C enrichment for the [1,2-13C2]leucine enrichment standards. The data for the three standards (natural, std 1, and std 2) plotted in this figure are presented in Table 2 for the El columns, i.e. the average enrichment in the 13C of positions 1 and 2 in the labeled molecule. The regression lines for the three derivatives are El(msrd) = (0.003±0.003) + (0.994±0.011)·El(std) for the NAP derivative (r2 = 0.9992); El(msrd) = (0.001±0.002) + (1.087±0.007) ·El(std) for the mixed derivative (r2 = 0.9997), and El(msrd) = (0.000±0.001) + (1.136±0.005) ·El(std) for the TBDMS derivative (r2 = 0.9999). The subscripts msrd and std refer to the measured and expected values of the standards, respectively. The slope of each line was tested for a difference from a value of unity by a 2-tailed t-test. The slope of the NAP-leucine line was not statistically different from unity, but both the “mixed” and tBDMS derivatives slopes were significantly different (p < 0.001 for both).
The measurements of the [1,2-13C2]glutamate standards as each derivative type are shown in Table 3 The three samples are an unlabeled and two unlabeled glutamate samples, similar to those used for leucine. The enrichments are defined for glutamate, as they were for leucine: the average 13C enrichment in the 1- and 2-C in the [1,2-13C2]glutamate (El). When these standards are oxidized to CO2 as their derivatized molecules, the enrichments of the resulting CO2 (E) are less than the enrichments in the labeled positions due to dilution of C from the glutamate and that added the derivative. The expected 13C enrichments are shown for each standard and derivative type in Table 3. The E values vary by derivative for two enriched standards.
Table 3.
GC-C-IRMS Glutamate Data for the Three Derivatives Testeda
| Expected 13C enrichment
|
Measured 13C enrichment
|
||||||
|---|---|---|---|---|---|---|---|
| Sample | Derivative Type | E (ape) | El(ape) | δ13 CPDB (per mil) | F (at %) | E (ape) | El(ape) |
| Natural | NAP | 0.0000 | 0.0000 | −33.54 ±0.52 | 1.0744 ±0.0006 | 0.0000 | 0.0000 |
| Std 1 | NAP | 0.0364 | 0.2368 | −1.31 ±0.09 | 1.1098 ±0.0001 | 0.0354 | 0.2303 |
| Std 2 | NAP | 0.0800 | 0.5202 | −40.45 ±0.19 | 1.1557 ±0.0002 | 0.0813 | 0.5284 |
| Natural | “mixed” | 0.0000 | 0.0000 | −30.43 ±0.09 | 1.0778 ±0.0001 | 0.0000 | 0.0000 |
| Std 1 | “mixed” | 0.0279 | 0.2368 | −2.92 ±0.17 | 1.1080 ±0.0002 | 0.0302 | 0.2570 |
| Std 2 | “mixed” | 0.0612 | 0.5202 | 29.10 ±0.19 | 1.1432 ±0.0002 | 0.0654 | 0.5560 |
| Natural | tBDMS | 0.0000 | 0.0000 | −28.29 ±0.22 | 1.0801 ±0.0002 | 0.0000 | 0.0000 |
| Std 1 | tBDMS | 0.0197 | 0.2368 | −7.93 ±0.06 | 1.1025 ±0.0001 | 0.0224 | 0.2685 |
| Std 2 | tBDMS | 0.0433 | 0.5201 | 16.19 ±0.38 | 1.1290 ±0.0004 | 0.0489 | 0.5866 |
E = 13C enrichment in the entire derivatized molecule; El = 13C enrichment in the two labeled carbons (C-1 and C-2) in the glutamate; F = the measured 13C in the derivatized molecule; NAP = N-acetyl n-propyl ester; TBDMS = t-butyldimethylsilyl ester; and mixed = N-acetyl t-butyldimethylsilyl ester.
The measured δ13C values for the glutamate standards (Table 3) were converted to mole fraction of 13C (F), then to enrichment of 13C in the whole molecule (E), and finally to 13C enrichment in the labeled positions (El). The measured El enrichments in Table 3 are plotted in Figure 5 against the expected El enrichment values for each standard and derivative type. The anticipated result was that each derivative type would produce a slope of unity. The slope of the measured versus expected 13C enrichment for the NAP-glutamate derivative was not distinguishable from unity (Figure 5). However, the slopes for both the mixed derivative and the TBDMS derivative were significantly greater than unity and significantly greater than the NAP-glutamate slope.
Figure 5.

Plot of the measured 13C enrichment versus expected 13C enrichment for the [1,2-13C2]glutamate enrichment standards. The data for the three standards (natural, std 1, and std 2) plotted in this figure are presented in Table 3 for the El columns, i.e. the average enrichment in the 13C of positions 1 and 2 in the labeled molecule. The regression lines for the three derivatives are El(msrd) = (−0.004±0.003) + (1.017±0.009) ·El(std) for the NAP derivative (r2 = 0.9995); El(msrd) = (0.001±0.001) + (1.069±0.004) ·El(std) for the mixed derivative (r2 = 0.9999), and El(msrd) = (0.001±0.002) + (1.128±0.005) ·El(std) for the TBDMS derivative (r2 = 0.9999). The subscripts msrd and std refer to the measured and expected values of the standards, respectively. The slope of each line was tested for a difference from a value of unity by a 2-tailed t-test. The slope of the NAP-glutamate line was not statistically different from unity, but both the “mixed” and tBDMS derivatives slopes were significantly different (p < 0.001 for both).
DISCUSSION
Because the same standards gave different measured 13C enrichments by GC-C-IRMS depending upon derivative type, we conclude that the derivative type affects the result. What is different about the three derivative types and two amino acids tested? The amount of silicon is different in the different derivatives. The samples without silicon (NAP derivative) produced the anticipated GC-C-IRMS response of an equal increase in measured 13C signal for an increase of 13C in the sample. However, both the TBDMS derivative and the “mixed” derivative produced 13C measurements greater than expected (Figures 4 and 5). We believe that the silicon does not proceed to SiO2 in the oxidation furnace, but forms a silicon carbide (SiCx) compound. Any carbon retained as silicon carbide in the oxidation reactor would be unavailable to form CO2 and would not appear to dilute the 13C in our labeled 13C standards.
How much carbon is retained by silicon in this process? We can define for the amount of C sequestered by silicon by asking how much C must be removed from the pool of CO2 produced in the oxidation reactor to produce a correct measurement of our leucine or glutamate 13C standards? We can modify equation 4 by adding a term, X, which is the amount of C that does not appear as CO2 when the sample is oxidized:
| (9) |
where N is the total number of carbon atoms in the derivatized molecule, nl is the number of carbon atoms that are labeled with 13C in the molecule, X is the number of C atoms retained by Si, Fu is the 13C abundance of unlabeled carbon in the molecule and Fl is the 13C abundance of the carbon in the positions containing the labels (always positions 1 and 2 in the amino acid samples used in this study). This equation can be simplified by first rearranging equation 9:
| (10) |
then subtracting (N-X)Fu from each side:
| (11) |
converting from terms using mole fraction (F terms) to enrichment above natural abundance (E terms where E = F – Fu). The term Fu cannot be evaluated directly, but we can substitute the measurement of 13C abundance for the unlabeled standard in for Fu: E = F – F0. Doing so, reduces equation 11 to
| (12) |
where E is the 13C enrichment (atom % excess) in the whole molecule (measured as CO2) and El is the 13C enrichment (atom % excess) in the labeled positions. This equation can be rearranged
| (13) |
to solve for El. We can use equation 13 to ask the question: as we increase the value of X from zero, when does the slope of the standard curve decrease to equal unity? At that point, the value for X will be the number of C atoms retained per molecule by the silicon during the oxidation event.
The problem with simply recalculating the slopes of the measured versus expected 13C enrichment lines in Figures 4 and 5 to produce a slope of unity is that we do not get a measure of uncertainty. We need a determination that places 95% confidence limits on our calculation of carbon retention by silicon. To do this, we have incrementally recalculated the results shown in Figure 4 for the leucine standard curves for a range of X values. At each X value, we calculated the P value of significance of the line being different from unity. In Figure 6 we plot the results of these calculations. The x-axis is X, the number of C atoms in the molecule that do not appear as CO2. The y-axis is the P value of significance that the slope of the measured versus expected 13C enrichment is different from unity. P values greater than 0.05 are not significant, i.e. the line at this point is indistinguishable from expected. Thus, each peak in Figure 6 indicates the range of values that X could be. A line segment is drawn across the bottom of each peak indicating the P = 0.05 point. This line segment denotes the 95% confidence limits for each peak.
Figure 6.

Plot of significance of the slope of the line of the GC-C-IRMS measured leucine 13C enrichment calibration curves being different from unity as a function of removal of C. The x-axis plots the amount of C removed from the derivatized leucine molecule (X) by silicon for each derivative measured in Figure 4. The total number of C in each derivative is given in Table 1. The y-axis plots the P-value that the slope of the measured versus expected 13C enrichment line is different from unity. P-values >0.05 are considered not significant. Three peaks are shown: one for each derivative type in Figure 4. Each peak top indicates the closest agreement of the measured enrichments to the expected enrichments. The X value at that point (shown in the figure at each peak top) indicates the number of C retained by silicon in the molecule. The three derivative curves are labeled on the figure. The line segment at the base of each peak indicates that region of the peak that lies above P <0.05.
We plotted the data for the NAP derivative for leucine as well as the data for the “mixed” and TBDMS derivatives in Figure 6. Because the NAP-leucine data produced a slope slightly less than unity (Figure 4), the peak shown in Figure 6 has a peak top at a negative X-value. However, the slope of the NAP-derivative curve in Figure 4 was not significantly different from unity, and the line segment shown in Figure 6 defines the 95% confidence limits that include the value of X = 0. Thus, the value of X in Figure 6 has a mean value of −0.05 with a confidence range of −0.36 ≤ X ≤ 0.20 for the NAP-leucine 13C curve.
The peak tops for the “mixed” and TBDMS derivatives of leucine in Figure 6 are X = 1.20 and 2.15, respectively. The confidence intervals for these derivative include integer values of X = 1 for the “mixed” derivative and X = 2 for the TDBMS derivative, which would be a stoichiometric ratio of one C per Si because there is one silicon in the “mixed” derivative and two silicon in the TBDMS derivative (Table 1).
In Figure 7 we plot the result of X upon the slope of the line being different from expected for the glutamate data shown in Figure 5. Each peak in Figure 7 indicates the range of values of X where the measured curve is not different from expected for each derivative. The NAP derivative for glutamate has a peak top at X = 0.22, consistent with its slope slightly being slightly (but not significantly greater) than unity (Figure 5). The 95% confidence limits of the NAP derivative (−0.06 ≤ X ≤ 0.48) include the value of X = 0.
Figure 7.
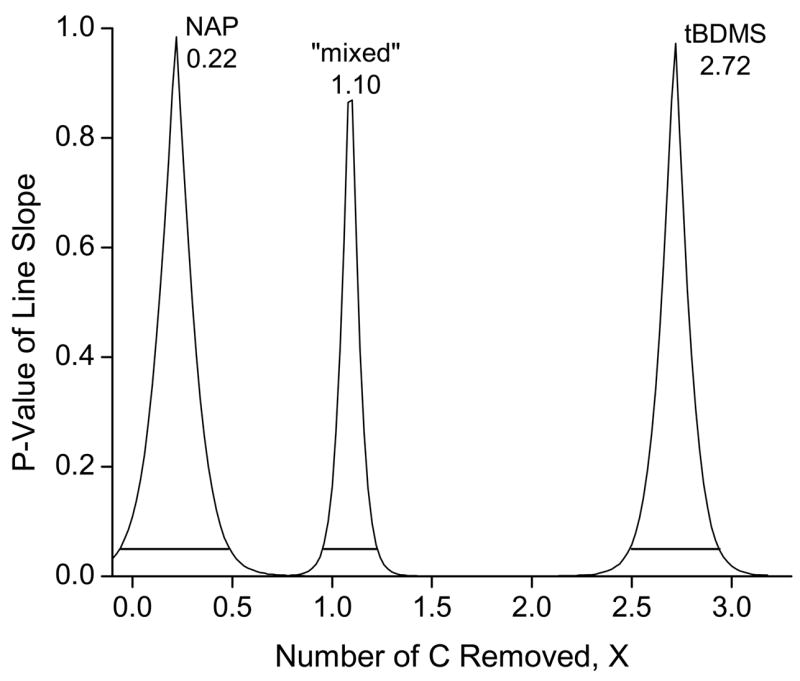
Plot of significance of the slope of the line of the GC-C-IRMS measured glutamate 13C enrichment calibration curves being different from unity as a function of removal of C. The x-axis plots the amount of C removed from the derivatized glutamate molecule (X) by silicon for each derivative measured in Figure 5. The total number of C in each derivative is given in Table 1. The y-axis plots the P-value that the slope of the measured versus expected 13C enrichment line is different from unity. P-values >0.05 are considered not significant. Three peaks are shown: one for each derivative type in Figure 5. Each peak top indicates the closest agreement of the measured enrichments to the expected enrichments. The X value at that point (shown in the figure at each peak top) indicates the number of C retained by silicon in the molecule. The three derivative curves are labeled on the figure. The line segment at the base of each peak indicates that region of the peak that lies above P <0.05.
The peak tops for the “mixed” and TBDMS derivatives in Figure 7 are 1.10 and 2.72, respectively. The 95% confidence interval for the “mixed” includes the integer values of X = 1, but confidence limit has to be extended beyond 95% to include X = 3 for the TDBMS derivative. If we expect a stoichiometric ratio of silicon to carbon, we would expect values of X = 1 and 3 for the “mixed” derivative with one silicon and the TBDMS derivative three silicons, respectively.
The amino acid glutamate was tested in addition to leucine because it contains a second carboxyl-group and produces a different set of derivatives containing silicon from leucine. While other variants could also have been used (e.g. lysine with a second amino group), we were limited in terms of the availability of appropriate 13C-labeled standards for testing. The use of glutamate and leucine together is sufficient to define if the effect we have observed is a function of the location of the silicon in the molecule, i.e. if the silicon is bonded to nitrogen or to oxygen in the amino acid makes a difference. The “mixed” derivative provides the case where the silicon is only attached to nitrogen. Both leucine and glutamate 13C curves showed removal of one carbon from the molecule when one silicon was attached to an amino group. When the silicon was also attached to the carboxyl-group of leucine, the number of carbon removed by the silicon rose to two. The number of carbon removed for the TBDMS-glutamate silicon was somewhere between 2.5–3, with a peak X = 2.7. Therefore, the silicon retention of C appears unaffected by the type of atom to which the TBDMS is attached.
The GC-C-IRMS system we used here is a commercial system available in a similar configuration from several instrument vendors. All use similar technology and all are continuous-flow systems based upon micro-combustion system for organic elemental analysis. The field of organic elemental analysis is a mature discipline originally based upon static combustion of material in sealed tubes. In the last few decades, the static approach has been replaced with commercial continuous-flow instruments.12,13 In all cases, a high temperature (900+ °C) combustion chamber is used in conjunction with a metal oxide, typically cupric oxide, and/or addition of catalyst metals, such as platinum or silver. The oxygen supplied from the cupric oxide is usually sufficient to produce complete oxidation of C in the sample to CO2. The older literature provides a variety of methods for ensuring accurate measurement of organic elemental composition including nitrogen and sulfur. Other methods are used for compounds where halogens are present.12,13
The literature for organic elemental analysis of organosilanes is spottier. For example, in an Analytical Chemistry review a paragraph is given as to how to measure silicon as SiO2, but no indication of problems is cited.13 In his 1951 book on the chemistry of silicon, Rochow14 suggests that static combustion of organosilanes will produce silicon carbide compounds, rather than SiO2.14 Angelotti and Hanson warn in a 1974 report that incomplete oxidation of silicon can readily occur in continuous-flow organic elemental analysis systems because of the high stability of silicon carbide even under the high temperatures and oxidative conditions that are used.15
What these results do not define is whether the C retained by the silicon is already bonded to the silicon or can come from any C in the molecule. We cannot tell from our results whether the carbon in the 13C-labeled positions participate and are retained by the silicon. We can only define that the slope of the line when plotting the measured 13C enrichment against the expected enrichment is increased by the approximate removal of one C per silicon. However, silicon-carbon bonds are more stable and less prone to oxidation when the attachment to the silicon is from a methyl group, rather than a larger aliphatic groups.15–17 The silylated derivatives for GC all use methyl groups. Although we have no direct evidence, we suspect based upon the literature that the C retained by the silicon in our experiments is one of the two TBDMS methyl group carbons.
The conversion of carbon from the TBDMS into silicon carbide would produce a unit formula of SiC, i.e. one carbon per silicon. Given the tetravalent nature of both carbon and silicon, silicon carbide can form an extended solid as a cubic18 or rhombic19 crystal system having an overall empirical formula of SiC (1:1). Because the oxidized TBDMS amino acids are injected into the system in very small amounts (~2–5 nmol), it is not likely that silicon at the site of oxidation is present in sufficient density to form an extended molecule of SiC units. Instead, the formation of dispersed ionic solid having the same formula unit (SiC) as the extended solid is more probable.
CONCLUSIONS
TBDMS derivatives are expected to oxidize to SiO2, CO2, and H2O within the GC-C-IRMS oxidation reactor, but our results demonstrate that the silicon of the TBDMS retains carbon, probably in a silicon carbide form. Silicon carbide is a refractory material that once formed will not release carbon at the temperature of the combustion oven. This retention of C skews sample 13C enrichments.
Silicon-based derivatives, such as trimethylsilyl or TBDMS, are important agents to prepare a range of metabolites for measurement by GC because these derivatives are (i) easy to form, (ii) produce a volatile species for most metabolites of interest, and (iii) do not readily degrade the molecule being derivatized.9,10,20,21 However, our data show that because the silicon in these derivatives retains carbon during their oxidation, a correction factor must be applied to measure of 13C enrichment by GC-C-IRMS when silyl derivatives are used. The correction factor could come from arbitrary application of one C per silicon in the derivative, but results shown here indicate variability in response in making these measurements. Alternatively a standard curve of known isotopic enrichment could be run simultaneously with the samples, and the slope of the measured 13C enrichment versus expected 13C enrichment could be used to correct the sample 13C measurements. Better yet, silyl derivatives should be avoided when using GC-C-IRMS to measure carbon-13.
Acknowledgments
This work was supported in part by National Institutes of Health grants AG-15821, DK-38429 and RR-00109.
References
- 1.Klein PD. Fed Proc. 1982;41:2698–701. [PubMed] [Google Scholar]
- 2.Bier DM, Matthews DE. Fed Proc. 1982;41:2679–85. [PubMed] [Google Scholar]
- 3.Matthews DE, Bier DM. Annu Rev Nutr. 1983;3:309–39. doi: 10.1146/annurev.nu.03.070183.001521. [DOI] [PubMed] [Google Scholar]
- 4.Brand WA. J Mass Spectrom. 1996;31:225–35. doi: 10.1002/(SICI)1096-9888(199603)31:3<225::AID-JMS319>3.0.CO;2-L. [DOI] [PubMed] [Google Scholar]
- 5.Matthews DE, Hayes JM. Anal Chem. 1978;50:1465–73. [Google Scholar]
- 6.Brenna JT, Corso TN, Tobias HJ, Caimi RJ. Mass Spectrom Rev. 1997;16:227–58. doi: 10.1002/(SICI)1098-2787(1997)16:5<227::AID-MAS1>3.0.CO;2-J. [DOI] [PubMed] [Google Scholar]
- 7.Brenna JT. Rapid Commun Mass Spectrom. 2001;15:1252–62. doi: 10.1002/rcm.325. [DOI] [PubMed] [Google Scholar]
- 8.Knapp DR. Handbook of Analytical Derivatization Reactions. John Wiley; New York: 1979. [Google Scholar]
- 9.Mawhinney TP, Robinett RSR, Atalay A, Madson MA. J Chromatogr. 1986;358:231–42. doi: 10.1016/s0021-9673(01)90333-4. [DOI] [PubMed] [Google Scholar]
- 10.Chaves Das Neves HJ, Vasconcelos AMP. J Chromatogr. 1987;392:249–58. doi: 10.1016/s0021-9673(01)94270-0. [DOI] [PubMed] [Google Scholar]
- 11.Zar JH. Biostatistical Analysis. Prentice-Hall; Englewood Cliffs, N.J: 1974. [Google Scholar]
- 12.Kirsten WJ. Organic Elemental Analysis: Ultramicro, Micro, and Trace Methods. Academic Press; New York: 1983. [Google Scholar]
- 13.Ma TS. Anal Chem. 1990;62:78R–84R. doi: 10.1021/ac00211a029. [DOI] [PubMed] [Google Scholar]
- 14.Rochow EG. An Introduction to the Chemistry of the Silicones. 2. John Wiley & Sons; New York: 1951. [Google Scholar]
- 15.Smith RC, Angelotti NC, Hanson CL. Chapter 7. In: Smith AL, editor. Analysis of Silicones. John Wiley & Sons; New York: 1974. pp. 113–168. [Google Scholar]
- 16.Rochow EG. An Introduction to the Chemistry of the Silicones. 2. John Wiley & Sons; New York: 1951. [Google Scholar]
- 17.Voronkov MG, Baryshok VP, Klyuchnikov VA, Danilova TF, Pepekin VI, Korchagina AN, Khudobin YI. J Organomet Chem. 1988;345:27–38. [Google Scholar]
- 18.Reinicke R. Z Krist. 1932;82:394–418. [Google Scholar]
- 19.Rittby CML. J Chem Phys. 1992;96:6768–73. [Google Scholar]
- 20.Schwenk WF, Berg PJ, Beaufrère B, Miles JM, Haymond MW. Anal Biochem. 1984;141:101–09. doi: 10.1016/0003-2697(84)90431-7. [DOI] [PubMed] [Google Scholar]
- 21.Loy GL, Quick AN, Jr, Teng CC, Hay WW, Jr, Fennessey PV. Anal Biochem. 1990;185:1–9. doi: 10.1016/0003-2697(90)90246-6. [DOI] [PubMed] [Google Scholar]