Abstract
Changes of body weight and composition are the result of complex interactions among metabolic fluxes contributing to macronutrient balances. To better understand these interactions, a mathematical model was constructed that used the measured dietary macronutrient intake during semi-starvation and re-feeding as model inputs and computed whole-body energy expenditure, de novo lipogenesis, gluconeogenesis, as well as turnover and oxidation of carbohydrate, fat and protein. Published in vivo human data provided the basis for the model components which were integrated by fitting a few unknown parameters to the classic Minnesota human starvation experiment. The model simulated the measured body weight and fat mass changes during semi-starvation and re-feeding and predicted the unmeasured metabolic fluxes underlying the body composition changes. The resting metabolic rate matched the experimental measurements and required a model of adaptive thermogenesis. Re-feeding caused an elevation of de novo lipogenesis which, along with increased fat intake, resulted in a rapid repletion and overshoot of body fat. By continuing the computer simulation with the pre-starvation diet and physical activity, the original body weight and composition was eventually restored, but body fat mass was predicted to take more than one additional year to return to within 5% of its original value. The model was validated by simulating a recently published short-term caloric restriction experiment without changing the model parameters. The predicted changes of body weight, fat mass, resting metabolic rate, and nitrogen balance matched the experimental measurements thereby providing support for the validity of the model.
INTRODUCTION
Regulation of body weight and composition is an issue of immense scientific, economic, and social importance. Obesity, anorexia nervosa, cachexia, and starvation are all life-threatening conditions of altered body composition fundamentally caused by a period of imbalance between energy intake and expenditure. But what determines the partitioning of energy between fat and lean tissue? How do dietary macronutrients contribute to energy partitioning? How does the interaction between in vivo metabolic fluxes finally integrate to provide regulation of body composition?
My goal was to develop a computational framework to study body composition regulation. Based on published in vivo human data, I created mathematical models of the individual metabolic processes contributing to daily macronutrient balance. Most model parameters were derived from the literature and the model components were integrated by fitting a few unknown parameter values to match body composition data from a classic long-term feeding study known as the Minnesota human starvation experiment (36). The resulting computer simulation of the Minnesota experiment predicted the underlying adaptations of daily whole-body energy expenditure and metabolic fluxes that were not measured.
A particularly important observation from the Minnesota human starvation experiment was that re-feeding caused a rapid replenishment and overshoot of body fat mass – clearly an undesirable result with implications for obesity relapse as well as the treatment of malnutrition. Therefore, another goal of this study was to explain the physiological basis of the fat mass overshoot and predict whether or not it was a transient phenomenon.
Finally, to test the validity of the model, I simulated a recently published short-term caloric restriction study by Friedlander et al. who measured changes of body weight, fat mass, resting metabolic rate, and nitrogen balance after energy intake was decreased by 40% while protein intake was maintained (30). No model parameters were altered for this simulation other than the initial baseline values.
METHODS
The Appendix provides a detailed description of the mathematical model along with the assumptions and supporting data from the literature. Since body composition changes occur over long time scales, the model does not attempt to simulate fluctuations of metabolism that occur within the course of a single day. Rather, the model was based on the concept of daily nutrient balance (27, 31) schematically depicted in Figure 1. Daily fluxes were calculated by assuming that two thirds of the day corresponded to the fed state and the remaining third corresponded to an overnight-fasted state.
Figure 1.
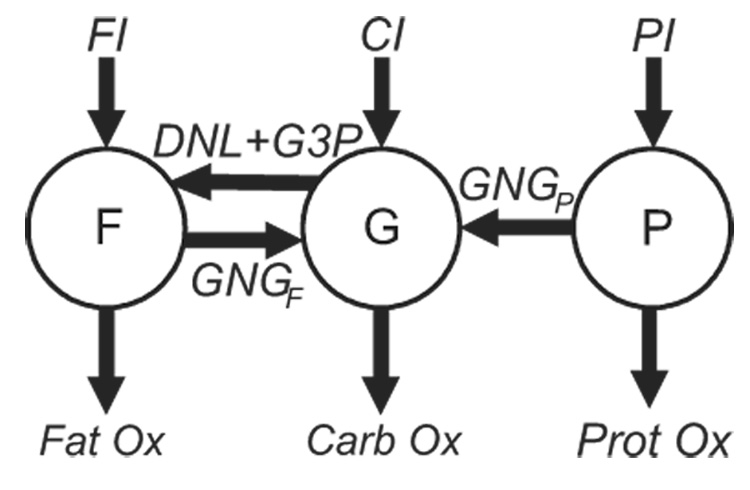
Schematic of the nutrient balance model. Changes of the body fat (F), glycogen (G), and protein (P) were determined by the balance of fat, carbohydrate, and protein intake (FI, CI, and PI, respectively), gluconeogenesis from fat (GNGF) and protein (GNGP), de novo lipogenesis (DNL), glycerol 3-P synthesis (G3P), and the oxidation of fat (Fat Ox), carbohydrate (Carb Ox), and protein (Prot Ox), respectively.
The model inputs were the measured daily metabolizable energy intake of fat (FI), carbohydrate (CI), and protein (PI). The masses of body fat (F), glycogen (G), and protein (P) are depicted as circles in Figure 1. The daily metabolic fluxes are represented by arrows in Figure 1 where DNL is the rate of de novo lipogenesis, G3P is the glycerol 3-P production rate, GNGF is the gluconeogenic rate from glycerol carbon, and GNGP is the gluconeogenic rate from amino acid carbon. CarbOx, FatOx, and ProtOx indicate the daily oxidation rates of carbohydrate, fat, and protein, respectively, which sum to the total daily energy expenditure (TEE, not shown).
Figure 1 is not intended to represent biochemical pathways and does not imply that macronutrients from the diet must first be converted to the storage pools F, G, or P before being oxidized or flow into gluconeogenic or lipogenic pathways. Rather, figure 1 indicates that changes of the body macronutrient pools result from net imbalances of the fluxes entering and exiting the pools. For example, an increase of P requires that PI be greater than the sum of GNGP and ProtOx.
The model of total energy expenditure (TEE) included the resting metabolic rate (RMR), thermic effect of feeding (TEF), and the energy expenditure of physical activity (PAE). RMR was determined by a weighted average of the organ basal metabolic rates (22) as well as the energy costs for gluconeogenesis, lipogenesis, and turnover of protein, triacylglycerol, and glycogen (9, 20). TEF was determined by macronutrient composition and content of the diet (FNB) and PAE depended on the amount of daily physical activity and was proportional to the body weight (61).
A reduction of energy intake below that required to maintain body weight causes a reduction of energy expenditure via a process called adaptive thermogenesis (19). Adaptive thermogenesis is believed to affect both RMR and PAE components of total energy expenditure (40) and I used the measured adaptation of RMR from the Minnesota experiment to investigate the relative changes of PAE versus RMR and the contribution of adaptive thermogenesis.
The content of body protein, glycogen, and fat influenced the daily average rates of proteolysis, glycogenolysis, and lipolysis, respectively. These rates, along with the macronutrient intakes, were used to determine the relative macronutrient oxidation rates according to equations presented in the Appendix. An important aspect of the macronutrient oxidation model was that, unlike carbohydrate and protein, fat intake did not directly stimulate its own oxidation (26, 55).
Gluconeogenesis was driven by dietary changes as well as endogenous substrate delivery. GNGF varied directly with the dietary fat intake and the endogenous lipolysis rate (7), while GNGP depended on the intake of carbohydrate and protein, as well as the proteolysis rate. DNL was a function of the dietary carbohydrate intake and the glycogen content such that DNL became amplified in the case of saturated glycogen and high carbohydrate intake (2).
The body weight was the sum of the body fat mass, F, and the lean mass, L. Lean mass was composed of bone, extracellular water, and the lean tissue (non-adipose) cell mass including intracellular water, glycogen, and protein. Based on typical values reported for the intracellular composition (3), and assuming that water is associated with intracellular protein and glycogen in constant ratios, the lean tissue cell mass was computed from the body protein and glycogen masses.
Most model parameters were determined from published human data, and the few remaining parameters were chosen to minimize the mean squared difference between the simulation outputs and the data from the Minnesota experiment. In that study, macronutrient intakes were controlled and body weight and composition changes were measured in 32 healthy young men over a period of about one year (36). The subjects participated in a 24-week semi-starvation period and lost 24% of their body weight. Semi-starvation was followed by a 12-week controlled re-feeding period. 12 subjects went on to participate in a further 8-week ad libitum feeding phase. The model was applied to data taken from the 12 subjects that participated in the entire 20-week re-feeding protocol. To investigate how long it would take to return to the original body composition, I continued the simulation for an additional 19 months with the dietary intake values given by those measured during the pre-starvation period of the Minnesota experiment.
To simulate the caloric restriction study of Friedlander et al., I chose the initial values for the body weight, fat mass, resting metabolic rate, and the balanced diet to match the average subject during the baseline phase of the experiment (30). Then, the caloric restriction was imposed using the diet composition described by Friedlander et al. where the energy restriction came primarily from decreased fat and carbohydrate intake, whereas protein intake was held approximately constant (30).
RESULTS
Simulation of the Minnesota Human Starvation Experiment
Body Weight and Fat Mass
Figure 2 shows the model simulation along with the experimental measurements of body weight and fat mass during the Minnesota experiment. The model simulations matched the experimental data reasonably well during all feeding periods. The initial baseline feeding period (B) resulted in a stable body weight and fat mass. The start of semi-starvation (SS) induced a rapid decrease of body weight and fat mass which slowed and eventually reached 76% and 34% of their initial values, respectively. During re-feeding, body weight and fat mass increased, both recovering to about 80% of their initial mass by the end of the 12 week controlled re-feeding period (CR). Ad libitum re-feeding (ALR) resulted in further increases of body weight and fat to finally achieve 104% and 145% of their initial values, respectively. Thus, the simulation reproduced the overshoot of body fat mass. Continuing the simulation with the original balanced baseline diet and physical activity level eventually restored the original body weight and fat mass, but it took more than a year for the fat mass to decrease to within 5% of its original value (Figure 3).
Figure 2.
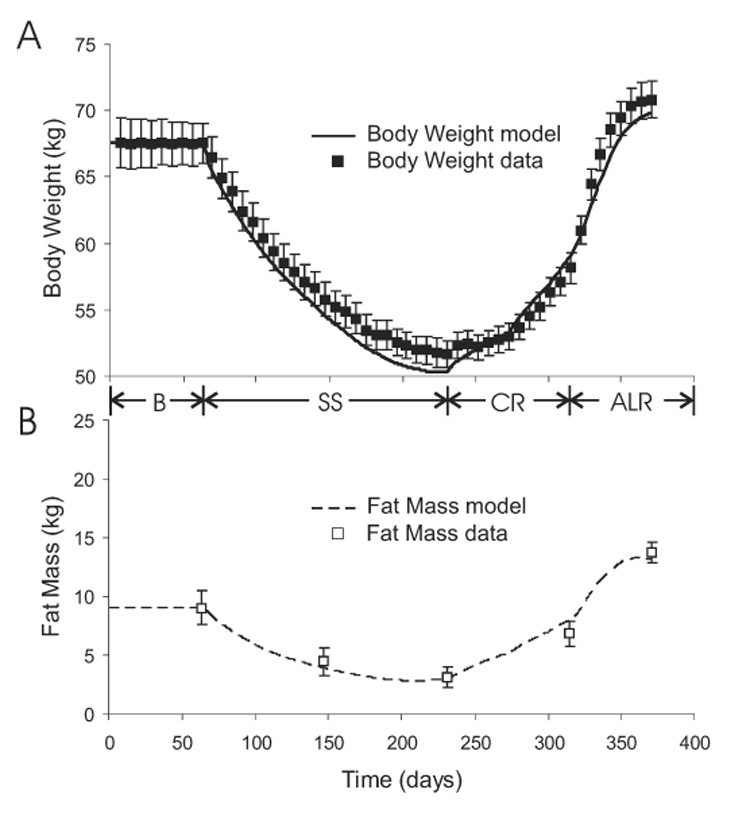
Model simulation (curves) and experimental measurements (boxes) of body weight (panel A) and fat mass (panel B) during baseline (B), semi-starvation (SS), controlled re-feeding (CR), and ad libitum re-feeding (ALR) phases of the Minnesota human starvation experiment.
Figure 3.
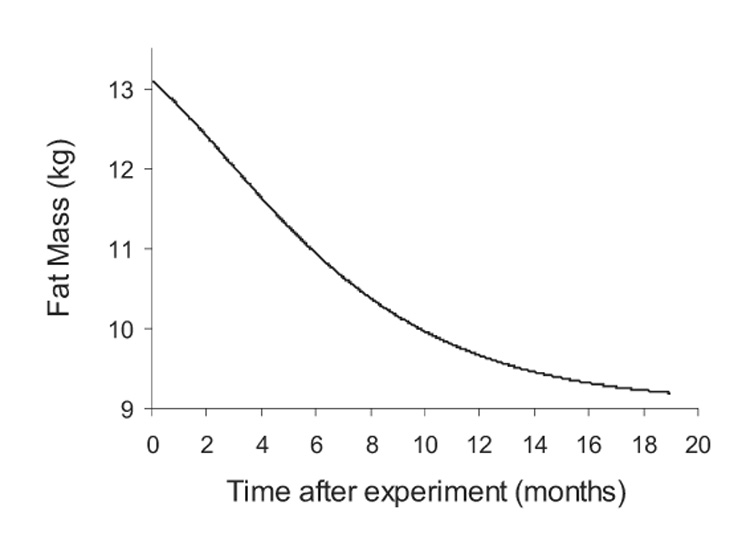
Model simulation of the time required to recover the original 9 kg of body fat mass after the termination of the Minnesota experiment.
Energy Expenditure
Figure 4A shows the simulated total energy expenditure (TEE) in response to the metabolizable energy intake (MEI) during the Minnesota experiment. The initial baseline feeding period was a state of energy balance where TEE was equal to MEI and body weight was maintained. At the onset of semi-starvation, TEE dropped rapidly, primarily because PAE decreased by 17% and RMR decreased by 15% after the first week of semi-starvation (Figure 4B). Despite the drop of TEE at the beginning of semi-starvation, TEE remained greater than MEI and the resulting state of negative energy balance persisted until near the end of the semi-starvation period where TEE eventually decreased to match MEI.
Figure 4.
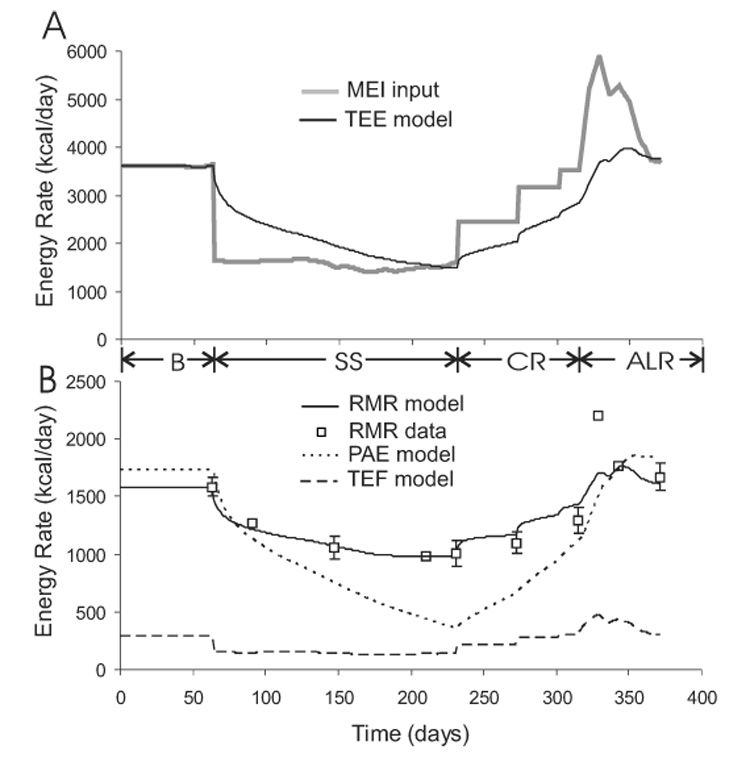
A) Model simulation of total energy expenditure, TEE, in response to imposed changes of metabolizable energy intake, MEI, during the Minnesota experiment. B) Simulated components of total energy expenditure including resting metabolic rate, RMR, physical activity expenditure, PAE, and the thermic effect of feeding, TEF. The experimental RMR measurements (□) are also shown. A few RMR data points do not have error bars since the uncertainties for these values were unreported.
Figure 4B illustrates the components of TEE and shows that the simulated RMR closely matched the measured fall of RMR during semi-starvation. However, despite the significant fall of RMR, the majority of the decrease of TEE was due to decreased PAE.
The re-feeding periods induced a state of positive energy balance that allowed body weight and fat mass to be regained. The step-wise increases of MEI were met with parallel increases of TEE. The simulated RMR matched the measured values reasonably well except at the onset of ad libitum feeding when the measured RMR reached almost 2200 kcal/d. However, the precision of this measurement was unclear since neither the uncertainty nor the individual subject data were reported.
Figure 5 depicts the measured RMR versus the lean body mass along with the model simulation. The curve traced by RMR versus lean body mass followed the loop shown in figure 5 with the sequence of events indicated by the arrows on the curve. Initially, both RMR and lean body mass were constant. Semi-starvation caused a rapid decrease of RMR due to adaptive thermogenesis as indicated by the initial drop of the RMR versus lean body mass curve. As the negative energy balance persisted, lean body mass decreased along with a concomitant decrease of RMR. The state of positive energy balance during re-feeding resulted in repletion of the lean body mass and a parallel increase of RMR. In accordance with the data, the simulated RMR was greater during re-feeding versus semi-starvation when compared at the same lean body mass. Specifically, the RMR after 12 weeks of semi-starvation was significantly lower than the RMR after 12 weeks of re-feeding despite the fact that both measurements occurred when lean body mass was 51.3 ± 1.5 kg (P < 0.0001).
Figure 5.
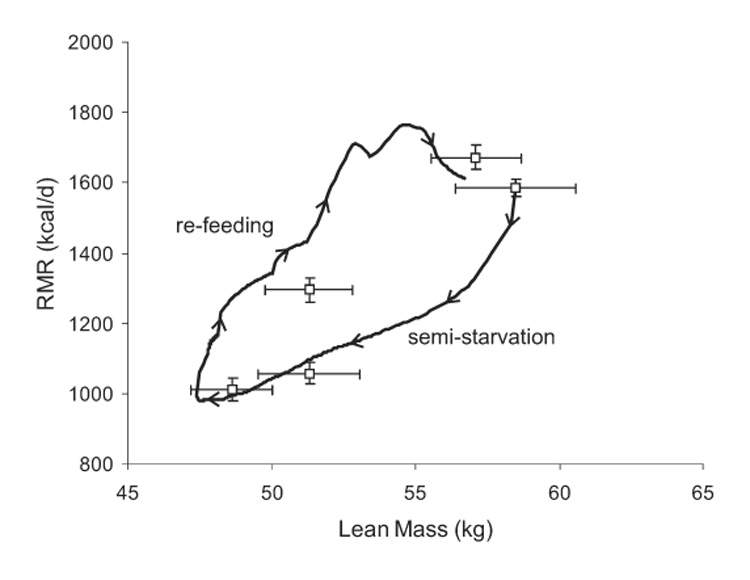
Model simulation (curve) and measurements (□) of RMR versus lean body mass where the sequence of events is indicated by the arrows on the curve traced during the simulation. The measured RMR when the lean mass was 51.3 ± 1.5 kg was significantly lower during semi-starvation than during re-feeding (P < 0.0001).
Macronutrient Intake and Oxidation
The macronutrient intake rates during the Minnesota experiment are depicted in Figure 6A. The baseline diet, averaging CIb = 1826 kcal/d, FIb = 1343 kcal/d and PIb = 461 kcal/d, was provided for the initial weight-maintenance period. Figure 6B shows the simulated oxidation rates of carbohydrate, fat, and protein which were approximately constant during the baseline period with 52% of the total energy expenditure derived from carbohydrate oxidation, 38% from fat oxidation, and 10% from protein oxidation.
Figure 6.
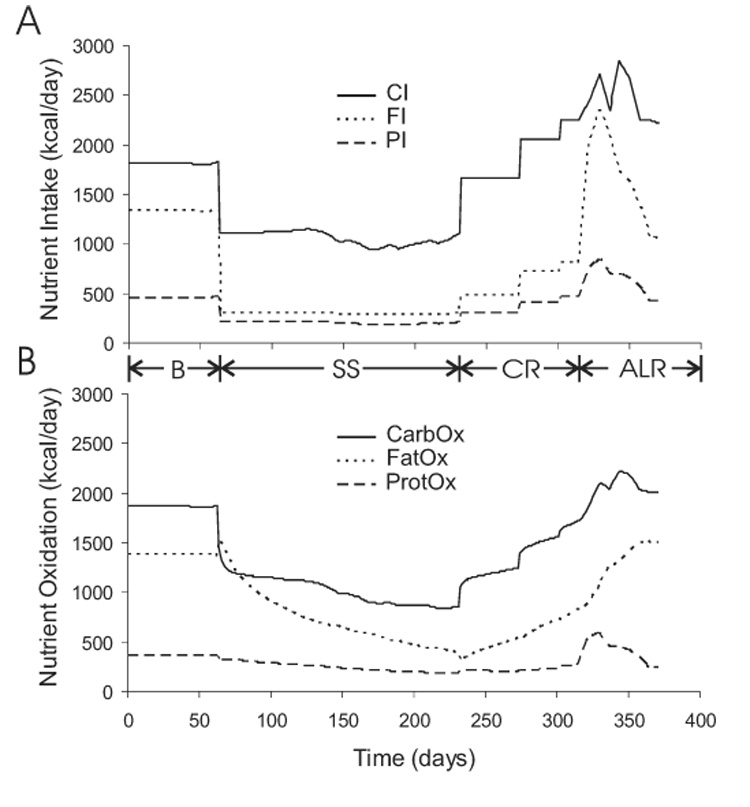
Imposed changes of macronutrient intake (panel A) and the simulated adaptation of macronutrient oxidation (panel B) during the Minnesota experiment.
The semi-starvation diet averaged CI = 1100 kcal/d, FI = 290 kcal/d, and PI = 195 kcal/d, for 24 weeks (36). After the first week of semi-starvation, the simulated carbohydrate oxidation rate dropped by 35% and accounted for about 42% of the total energy expenditure. Small weekly variations of the experimental semi-starvation diet were introduced, primarily via changes of carbohydrate intake, to obtain the desired rate of weight loss (36). The carbohydrate oxidation rate followed carbohydrate intake during the remainder of the semi-starvation period. The simulated protein oxidation rate decreased by 12% after the first week of semi-starvation and remained suppressed.
The simulated fat oxidation rate increased by 12% during the initial days of semi-starvation. This increase was due to enhanced lipolysis associated with the reduced carbohydrate intake. After the first week of semi-starvation, fat oxidation was 46% of the of the total energy expenditure. This led to a negative fat balance of more than 1000 kcal/d that slowly became less negative as the semi-starvation progressed and body fat was catabolized. At the end of the semi-starvation period, all three macronutrient oxidation rates were roughly equal to their respective dietary intakes.
At the start of the controlled re-feeding phase, carbohydrate oxidation increased by 30% and accounted for 64% of the total energy expenditure. Protein oxidation increased by 13% and accounted for 12% of the total energy expenditure, while fat oxidation sluggishly increased and accounted for 22% of the total energy expenditure. All macronutrient oxidation rates were less than their respective intake rates during the controlled re-feeding period.
The final 8 weeks of ad libitum feeding allowed the subjects to consume very large quantities of food and they disproportionately increased their fat intake. Rapid adaptations of carbohydrate and protein oxidation accompanied their increased dietary intake. Fat oxidation continued its sluggish, almost linear increase during the entire re-feeding phase resulting in substantial differences between fat intake and oxidation, reaching almost 1200 kcal/d during ad libitum feeding. Thus, the difference between ad libitum fat intake and oxidation was the primary cause of the post-starvation body fat overshoot.
Gluconeogenesis
Figure 7 shows that the gluconeogenic rates from glycerol (GNGF) and amino acids (GNGP) were initially constant at their baseline values, but the onset of semi-starvation caused GNGF to decrease by 30%. This was caused by the reduced fat intake and the corresponding 78% decrease of exogenous glycerol while endogenous glycerol gluconeogenesis increasing by 23% due to increased adipose lipolysis (not shown). Despite the reduced protein intake at the onset of semi-starvation, GNGP remained approximately constant in the initial days of semi-starvation due to the decrease of carbohydrate intake. GNGF and GNGP both decreased slowly over the course of semi-starvation as body fat and protein were catabolized, respectively. Re-feeding caused suppression of GNGP as carbohydrate intake increased. The inhibition of lipolysis upon re-feeding, and concomitant reduction of endogenous glycerol entering the gluconeogenic pathway was counterbalanced by the increase of exogenous glycerol from dietary fat. Therefore, GNGF was only slightly reduced upon re-feeding, and gradually increased as body fat, and thereby lipolysis, recovered.
Figure 7.
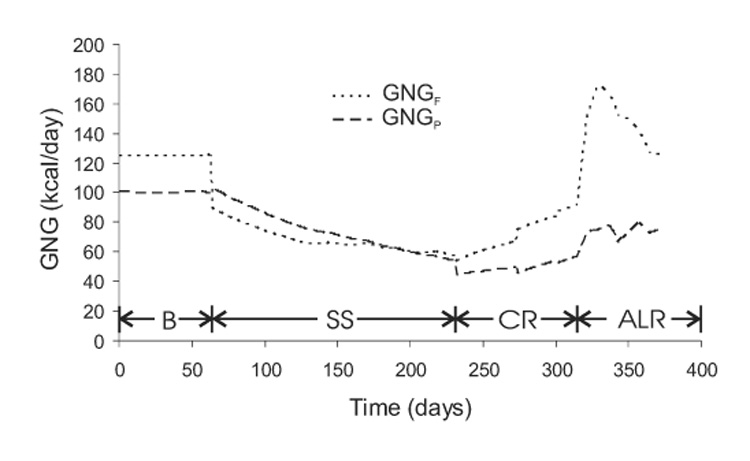
Simulated gluconeogenic rates from carbon derived from protein (GNGP) and glycerol (GNGF) during the Minnesota experiment.
Glycogen and DNL
Figure 8 shows a rapid initial drop of glycogen by about 100 g after the first week of semi-starvation, as expected. However, as the semi-starvation progressed, the glycogen content surprisingly increased and eventually exceeded baseline levels by about 40%. This was caused by the progressive reduction of physical activity since glycogen remained low in simulations where the physical activity level was maintained throughout the semi-starvation phase (not shown). The rate of glycogen increase during prolonged semi-starvation was equivalent to an average positive carbohydrate balance of about 10 kcal/d. Given that the carbohydrate intake during the semi-starvation period averaged 1100 kcal/d, this implies that carbohydrate was remarkably well-balanced to within 1% error. Re-feeding initially induced further increases of glycogen content, but there was a trend towards normalization of glycogen as carbohydrate oxidation was stimulated.
Figure 8.
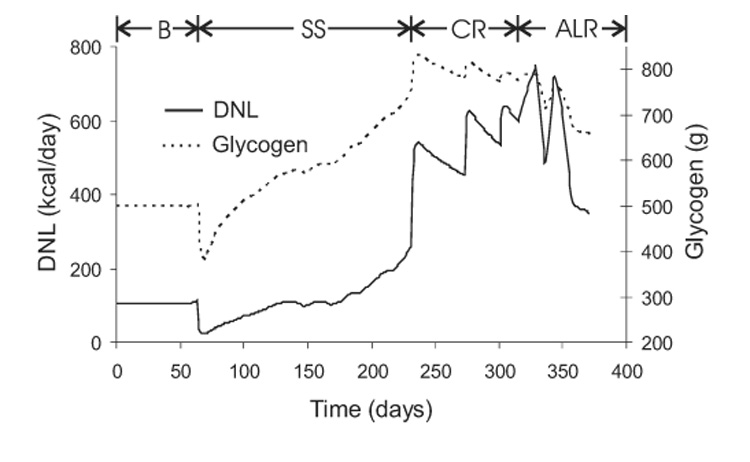
Simulated variations of de novo lipogenesis (DNL) and whole-body glycogen content during the Minnesota experiment.
Figure 8 also shows that DNL mirrored the glycogen time-course during the baseline and semi-starvation periods. The basal DNL rate was about 100 kcal/d and decreased to 24 kcal/d after the first week of semi-starvation. Controlled re-feeding caused the DNL rate to increase to around 600 kcal/d, and eventually exceeded 700 kcal/d during ad libitum feeding. Such high DNL rates were caused by the elevated glycogen content along with the high carbohydrate intake during re-feeding. The elevated DNL was primarily responsible for the recovery of fat mass during controlled re-feeding since DNL was greater than the slight positive balance of fat intake over oxidation. However, during ad libitum feeding the situation was reversed, with DNL playing a secondary role to the drastically elevated fat intake.
Daily Respiratory Gas Exchange
Figure 9 shows the simulated daily respiratory exchange of oxygen and carbon dioxide based on the stoichiometry for carbohydrate, fat, and protein oxidation along with corrections introduced by gluconeogenic and lipogenic fluxes (21, 23). As expected from the above descriptions of energy expenditure and macronutrient oxidation, semi-starvation caused a decrease of both oxygen consumption (VO2) and carbon dioxide production (VCO2) with a more rapid decrease of VCO2. Thus, the resulting decrease of both the respiratory quotient (RQ) and the non-protein respiratory quotient (NPRQ) reflected the increased reliance on fat oxidation. As semi-starvation progressed, RQ and NPRQ gradually increased while both VO2 and VCO2 continued to decrease. This indicated that the contribution from fat oxidation was decreasing as body fat was catabolized and energy expenditure continued to decrease. Re-feeding caused VO2 and VCO2 to increase, with VCO2 increasing more rapidly as DNL was stimulated and the respiratory quotients transiently exceeded 1.
Figure 9.
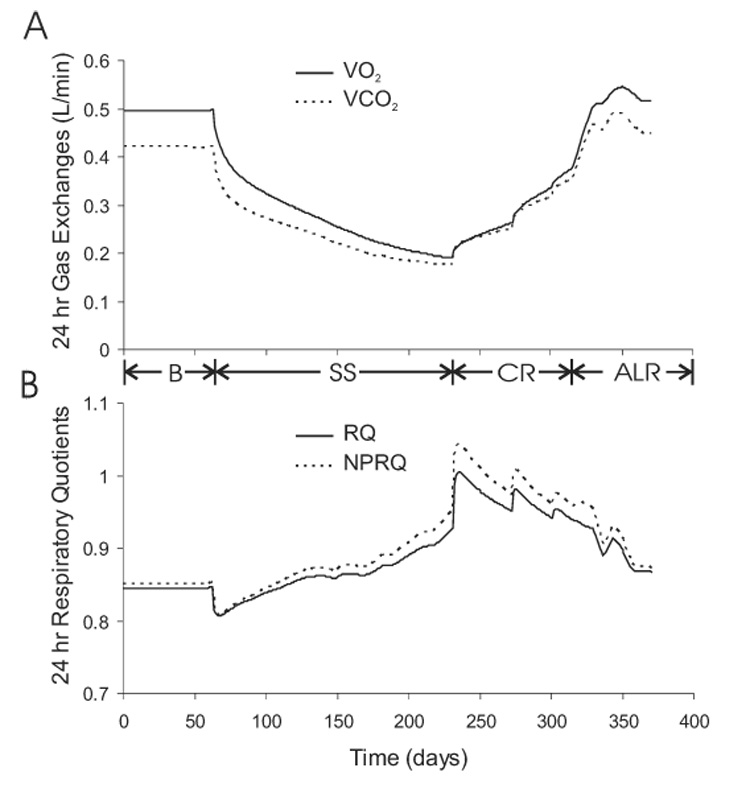
Simulated daily oxygen consumption (VO2) and carbon dioxide production (CO2) (panel A), along with the daily respiratory quotient (RQ) and non-protein respiratory quotient (NPRQ) (panel B) during the Minnesota experiment.
Triacylglycerol, Protein, and Glycogen Turnover
Figure 10 shows the simulated daily turnover rates of triacylglycerol (TG), protein, and glycogen. Figure 10A shows that the daily average lipolysis and TG synthesis rates were initially balanced at 140 g/d. At the onset of semi-starvation, lipolysis was stimulated by the reduction of carbohydrate intake and rose to 170 g/d while TG synthesis dropped to 40 g/d primarily because of the decreased fat intake. The resulting state of negative fat balance caused the body fat mass to decline and a concomitant progressive decrease of the lipolysis rate. Upon re-feeding, TG synthesis increased and the lipolysis rate was transiently depressed by the increased carbohydrate intake. However, the lipolysis rate gradually increased as fat mass was regained over the course of re-feeding.
Figure 10.
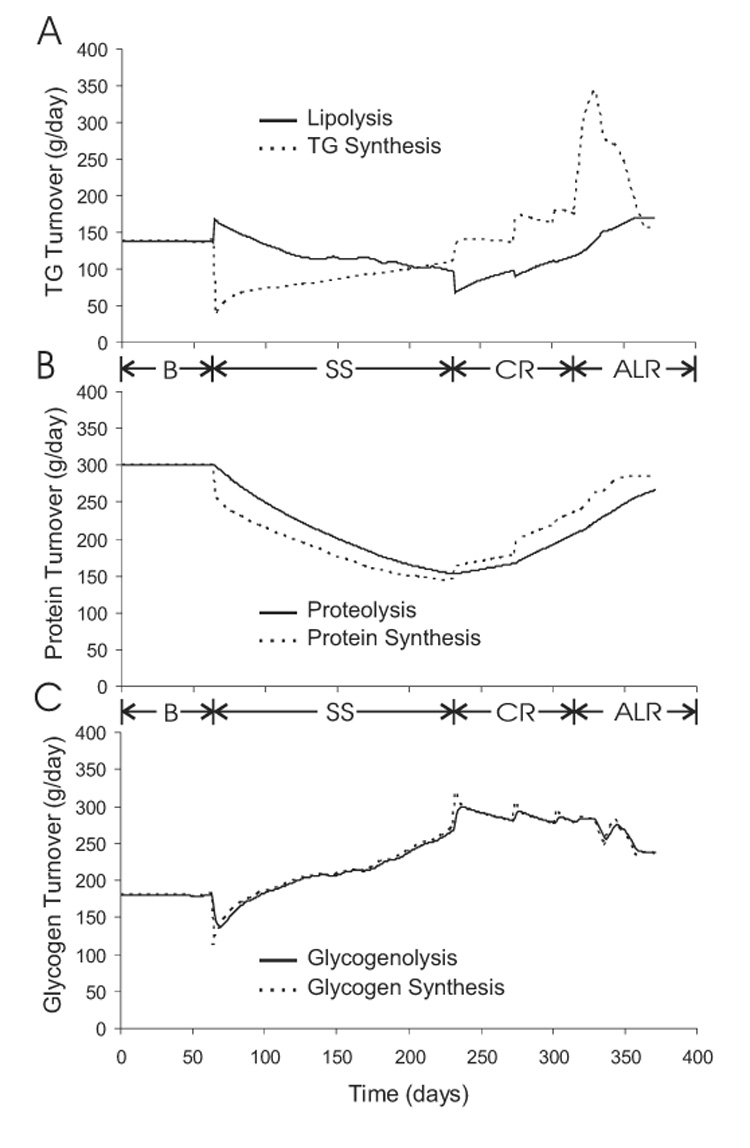
Simulated turnover rates of triacylglycerol (TG) (panel A), protein (panel B), and glycogen (panel C) during the Minnesota experiment.
Protein degradation and synthesis were initially balanced at 300 g/d as shown in figure 10B. Semi-starvation caused daily protein synthesis to decrease immediately by 40 g/d followed by a gradual fall of the proteolysis rate caused by the decline of body protein. The difference between the proteolysis and protein synthesis rates during semi-starvation was roughly constant indicating that there was an approximately constant rate of protein catabolism. Re-feeding caused protein synthesis to increase and the resulting positive protein balance led to a gradual increase of the daily proteolysis rate.
Figure 10C shows the simulated daily glycogen turnover and illustrates that, except during transient changes of energy intake, glycogen synthesis and glycogenolysis rates were closely matched over the entire course of the study.
Nutrient Balances
Figure 11 depicts the dynamic changes of the energy balance and individual macronutrient balances. Figure 11A shows that the fat balance closely tracked the energy balance indicating that most of the energy deficit and surplus was accounted for by body fat changes. Figure 11B shows that long-term carbohydrate balance was more tightly controlled than protein balance since protein imbalances were sustained whereas transient carbohydrate imbalances were quickly suppressed.
Figure 11.
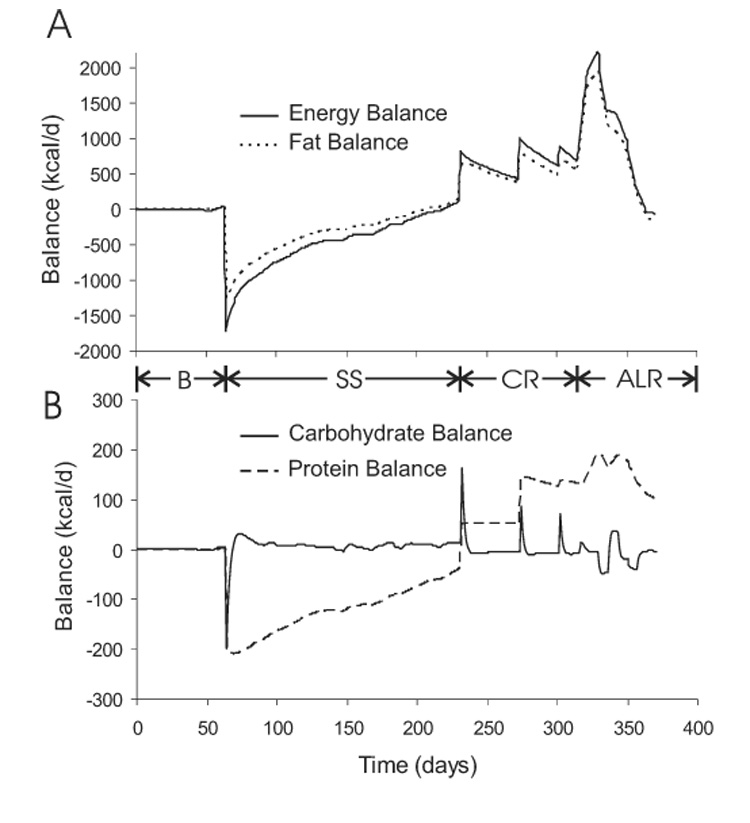
Simulated variations of energy and fat balance (panel A) as well as carbohydrate and protein balance (panel B) during the Minnesota experiment.
Simulation of Short-term Caloric Restriction
Body Weight and Fat Mass
Figure 12 shows the simulated changes of body weight and fat mass during three weeks of caloric restriction by 40% of baseline energy requirements. Despite using model parameters derived from the Minnesota experiment, the model predictions matched the experimental measurements of Friedlander et al. (30), thereby providing support for the validity of the model. The body weight and fat mass had an almost linear decline during the three weeks of caloric restriction and the subjects lost 4 kg of body weight with slightly less than half coming from loss of body fat.
Figure 12.
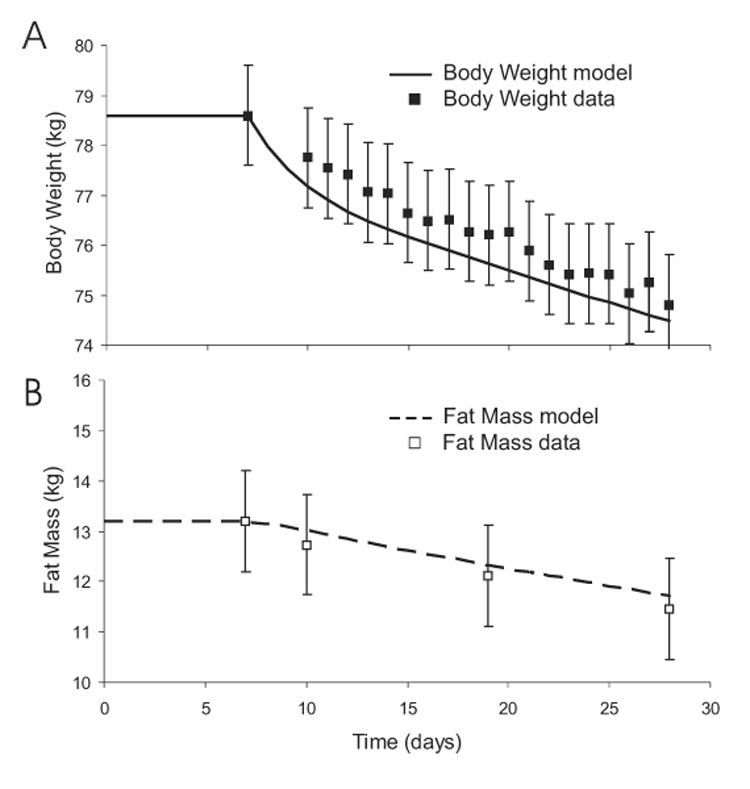
Predicted changes of body weight (panel A) and fat mass (panel B) during a three week caloric restriction experiment. Other than the initial balanced values, no model parameters were changed to simulate the data (boxes) from this experiment.
Resting Metabolic Rate and Nitrogen Balance
Figure 13 shows the predicted changes of RMR and nitrogen balance during the three week caloric restriction along with the experimental data. Again, the model results match the experimental measurements and may help explain the observed negative nitrogen balance despite maintaining protein intake at baseline values. The model suggested that increased amino acid gluconeogenesis and oxidation resulted from the decreased carbohydrate intake and a concomitant fall of glycogen (not shown). Thus, while nitrogen intake was maintained, amino acid oxidation and gluconeogenesis increased leading to negative nitrogen balance.
Figure 13.
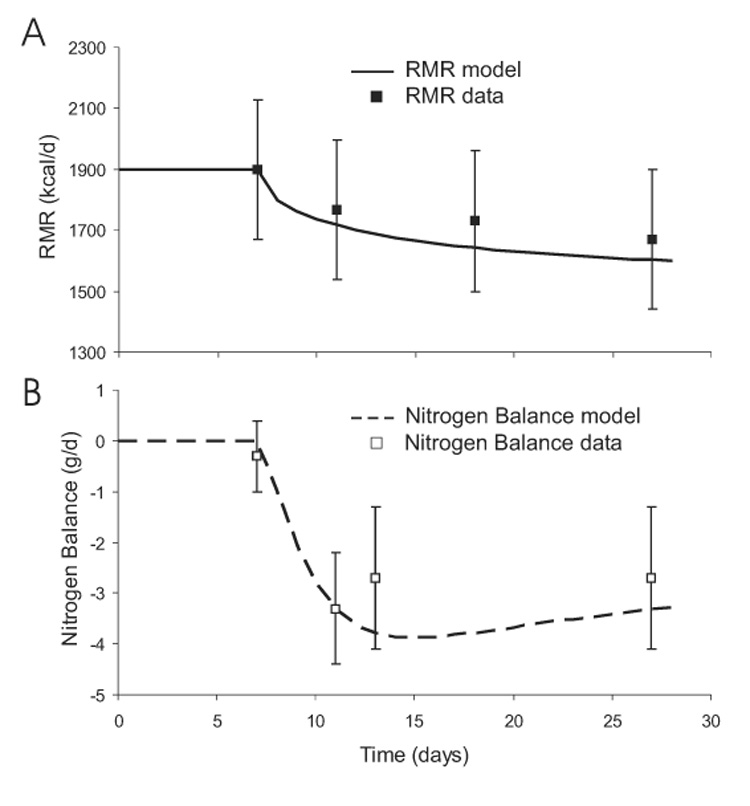
Predicted changes of RMR (panel A) and nitrogen balance (panel B) during a three week caloric restriction experiment.
DISCUSSION
The Minnesota human starvation experiment is renowned for its comprehensive set of careful measurements over an extended duration of precisely controlled feeding. Such a study is unlikely to be repeated due to both its magnitude and the hardships endured by its subjects (36). At that time, it was not possible to measure all of the important metabolic fluxes participating in macronutrient balance. To address this issue, the present study introduced a computational model that integrates in vivo human data from a variety of published studies to predict the unmeasured daily rates of carbohydrate, fat, and protein turnover and oxidation, the total energy expenditure and its components, as well as the rates of gluconeogenesis and de novo lipogenesis.
Several investigators have used mathematical modeling to study the regulation of body weight (6, 37) and composition (4, 5, 11, 13, 14, 28, 38, 50, 64, 68). Most previous models of body weight and composition regulation assumed that the macronutrient composition of the diet had no effect on the partitioning of energy between lean and fat tissue – an assumption that runs counter to the nutrient balance concept (27, 31). Rather, most models defined a parameter or a simple function of initial body composition that determined the fraction of energy imbalance partitioned towards deposition or mobilization of body protein versus fat (11, 13, 14, 50). The physiological basis for this partitioning is unclear and begs the question of how body composition is regulated. A more recent model incorporated carbohydrate and fat balances, but ignored protein (28). A few previous models have also been applied to the data from the Minnesota experiment (4, 5, 37, 50), but the present study is the first to validate a human model by comparing model predictions with body composition and metabolic data from an independent human feeding study.
Previous mathematical models have represented RMR as a linear function of lean body mass (4, 5, 13, 14, 50, 64, 68), occasionally with coefficients significantly greater than those determined from cross-sectional analysis (16, 46). Such models fail to capture the loop traced by the RMR versus lean body mass curve throughout semi-starvation followed by re-feeding. In a pair of elegant studies re-analyzing the Minnesota experiment, Dulloo et al. argued for the existence of an adaptive thermogenic mechanism to explain the measured RMR data (17, 18). In agreement with these authors, the mathematical model presented here suggested that adaptive thermogenesis at the onset of semi-starvation caused a rapid drop of RMR which then decreased slowly as lean tissue was catabolized and protein turnover decreased. During re-feeding, the level of adaptive thermogenesis and the energy costs of DNL and protein turnover were increased, resulting in a higher RMR at the same lean mass during re-feeding versus semi-starvation.
The physiological mechanisms underlying adaptive thermogenesis are unknown. Several investigators have suggested that underfeeding causes metabolically active organs such as the liver, intestines, or kidneys to rapidly decrease their mass (47, 50). Alternatively, the concentrations of circulating catecholamines and thyroid hormones have been observed to rapidly decrease with underfeeding (53, 65) and may reflect a reduction of sympathetic outflow and concomitant decrease of RMR. The present model was empirical and did not distinguish between these mechanisms.
While changes of RMR contributed significantly to energy balance, the decrease of PAE during semi-starvation was responsible for the majority of the slow decline of total energy expenditure. The physiological mechanisms underlying the changes of PAE are unclear. Since PAE for most common activities is proportional to body weight, the loss of body weight itself contributed to some decrease of PAE, but this was insufficient to account for the required decrease.
Adaptation of PAE has been hypothesized to involve altered energy efficiency of muscular work (40, 54). However, no change of physical activity energy efficiency was observed during treadmill tests at various stages of the Minnesota experiment (36, 58). Nevertheless, it is possible that changes of muscular work efficiency during typical daily activities may not have been reflected by the more physically demanding treadmill tests. Keys et al. noted that the subjects became apathetic and avoided voluntary physical activity towards the end of the semi-starvation phase, but no systematic monitoring of physical activity was performed (36). Questionnaires completed by the subjects showed a progressive decrease of their physical “activity drive” over the course of semi-starvation which slowly improved with re-feeding (36). Therefore, it is possible that PAE changes with semi-starvation were the result of decreased voluntary as well as altered spontaneous physical activity expenditures such as fidgeting, posture control, and muscle tone (41).
The remarkable regulation of long-term carbohydrate balance was due to the limited whole-body glycogen storage capacity. Therefore, relatively little energy could be accumulated or lost in the form of glycogen in comparison to protein or fat. However, large short-term changes of glycogen were permitted and led to potent modulation of both carbohydrate oxidation (24) and DNL (2). Thus, glycogen feedback ensured that carbohydrate imbalances were only transient. In comparison, the relatively less significant short-term change of the body protein pool had little effect on protein oxidation so that protein imbalances were more sustained and led to long-term changes of the lean body mass. Unlike carbohydrate and protein, fat intake did not directly stimulate its own oxidation and the relative change of the body fat pool only weakly affected fat oxidation (26, 55). Thus, large fat imbalances were observed during semi-starvation and re-feeding and these imbalances were sustained resulting in significant changes of body fat mass.
The model predicted that the fat mass overshoot was not permanent provided that the original pre-starvation diet and physical activity level were returned. However, recovery of the original body composition was predicted to take more than a year. The predicted mechanism of the fat mass overshoot was an enhanced rate of de novo lipogenesis in the early re-feeding period, followed by a dramatic increase of fat intake during ad libitum feeding. In contrast, Dulloo et al. postulated that the improved energy economy resulting from adaptive thermogenesis was somehow specifically channeled to accelerate fat mass gain during re-feeding based on a “fat-stores memory” (17, 18). The present study demonstrates that such a novel mechanism was not necessary to explain the data.
The present version of the computational model does not explicitly include the effects of hormones, but several hormonally mediated effects are implicitly included. For example, insulin’s effect is implicit in the function of dietary carbohydrate to inhibit lipolysis, as well as stimulate carbohydrate oxidation, glycogen synthesis, and DNL. Future work will explicitly account for the effects of important hormones and will extend the model to study overfeeding and body composition regulation in altered metabolic states like obesity, anorexia nervosa, and cachexia.
ACKNOWLEDGEMENTS
I thank CC Chow, H Bain, A Sherman, PA Tattaranni, and SS Alpert for helpful discussions. KDH has no personal or financial conflicts of interest.
FUNDING INFORMATION: This research was supported by the Intramural Research Program of the NIH, NIDDK.
GLOSSARY OF MODEL VARIABLES
- BCM
Body cell mass in g
- BW
Body weight in g
- CarbOx
Rate of carbohydrate oxidation in kcal/d
- CI
Carbohydrate intake rate in kcal/d
- DF
Rate of endogenous lipolysis in g/d
- DG
Rate of glycogenolysis in g/d
- DNL
Rate of de novo lipogenesis in kcal/d
- DP
Rate of proteolysis in g/d
- ECW
Extracellular water mass in g
- F
Body fat mass in g
- FatOx
Rate of fat oxidation in kcal/d
- fC
Carbohydrate oxidation fraction
- fF
Fat oxidation fraction
- FI
Fat intake rate in kcal/d
- fP
Protein oxidation fraction
- G
Glycogen mass in g
- G3P
Rate of glycerol 3-phosphate synthesis in kcal/d
- GNGF
Rate of gluconeogenesis from glycerol in kcal/d
- GNGP
Rate of gluconeogenesis from protein in kcal/d
- L
Lean body mass in g
- MEI
Metabolizable energy intake in kcal/d
- NPRQ
Non-protein respiratory quotient
- P
Protein mass in g
- PAE
Physical activity energy expenditure in kcal/d
- PI
Protein intake rate in kcal/d
- ProtOx
Rate of protein oxidation in kcal/d
- RMR
Resting metabolic rate in kcal/d
- RQ
Respiratory quotient
- SynthF
Rate of fat synthesis in g/d
- SynthG
Rate of glycogen synthesis in g/d
- SynthP
Rate of protein synthesis in g/d
- T
Adaptive thermogenesis
- TEE
Total energy expenditure in kcal/d
- TEF
Thermic effect of feeding in kcal/d
- TG
Triacylglyceride
- VCO2
Rate of carbon dioxide production in L/d
- VO2
Rate of oxygen consumption in L/d
APPENDIX
DETAILED DESCRIPTION OF THE MATHEMATICAL MODEL
The individual components of the mathematical model were based on a variety of published, in vivo human data as described below. Each model component was relatively simple and only the most important physiological effectors have been incorporated. Since continued development of the model is part of an ongoing research program, additional relevant physiological data will be incorporated in the existing computational framework to improve the realism and predictive capabilities of the model.
The nutrient balance model depicted in Figure 1 is an expression of the conservation of energy such that changes of the body’s energy stores were given by the sum of fluxes entering the pools minus the fluxes exiting the pools. Thus, the mathematical representation of the nutrient balance model was given by the following differential equations:
| [1] |
where ρC = 4.2 kcal/g, ρF = 9.4 kcal/g, and ρP = 4.7 kcal/g were the energy densities of carbohydrate, fat, and protein, respectively (43). The oxidation rates CarbOx, FatOx, and ProtOx, summed to the total energy expenditure, TEE. Since body composition changes take place on the time scale of weeks, months, and years, the model was targeted to represent daily changes of energy metabolism and not fluctuations of metabolism that occur within a day. The nutrient balance equations were integrated using the 4th order Runge-Kutta algorithm with a timestep size of 0.1 days (52).
Body Composition
The body weight, BW, was the sum of the lean body mass, L, and the fat mass, F. L was computed using the following equation:
| [2] |
where the lean mass is composed of bone mass, BM, extracellular water, ECW, and the body cell mass, BCM. BCM is composed of intracellular water, ICW, glycogen, G, and protein, P, as well as a small contribution from nucleic acids and other intracellular solids, ICS. The protein fraction of the lean tissue cell mass was P/CM = 0.2 and that the intracellular water fraction was ICW/CM = 0.7 (3). ICW was directly related to P and G such that each gram of protein and glycogen was associated with hP and hG grams of water, respectively. IĈW was a constant amount of intracellular water computed to attain the appropriate initial intracellular composition assuming that G = 500g, hG = 2.7, and hP = 2 (45).
I assumed that BM was 4% of the initial body weight as estimated by Keys et al. (36). ECW varied slightly throughout the Minnesota experiment, increasing significantly at the end of the semi-starvation phase (corresponding to clinical edema) and returning to baseline by the end of the re-feeding period (36). I used the measured changes of ECW as a model input.
Whole-body Total Energy Expenditure
Total energy expenditure, TEE, was modeled by the following equation:
| [3] |
where TEF was the thermic effect of feeding, PAE was the energy expended for physical activity, and RMR was the remainder of the whole-body energy expenditure defined as the resting metabolic rate. Explicit equations for each component of energy expenditure follow.
Thermic Effect of Feeding
Feeding induces a rise of metabolic rate associated with the digestion, absorption, and short-term storage of macronutrients and was modeled by the following equation:
| [4] |
where αF = 0.025, αP = 0.25, and αC = 0.075 defined the short-term thermic effect of fat, protein, and carbohydrate feeding (29).
Adaptive Thermogenesis
Energy imbalance causes an adaptation of metabolic rate that opposes weight change (19, 40). Whether or not the adaptation of energy expenditure is greater than expected based on body composition changes alone has been a matter of some debate (19, 40, 65, 66). The so-called adaptive thermogenesis is believed to affect both resting and non-resting energy expenditure (40) and has maximum amplitude during the dynamic phase of weight change (40, 65). Adaptive thermogenesis may also persist during weight maintenance at an altered body weight, but the persistent effect has been debated (66). The non-RMR component of adaptive thermogenesis may reflect either altered efficiency or amount of muscular work (40, 41, 54).
The onset of adaptive thermogenesis is rapid and may correspond to altered levels of circulating thyroid hormones or catecholamines (53, 65). I defined a dimensionless adaptive thermogenesis parameter, T, which was generated by a first order process in proportion to the departure from the baseline metabolizable energy intake MEIb = CIb + FIb + PIb:
| [5] |
where ΔMEI was the change from the baseline metabolizable energy intake, τ = 7 days was the estimated time constant for the onset of adaptive thermogenesis, and λ was a parameter to be determined from the best fit to the Minnesota experiment data. The adaptive thermogenesis parameter, T, acted on both the RMR and PAE components of energy expenditure as defined below. This simple model assumed that adaptive thermogenesis reacted to perturbations of MEI and persisted as long as MEI was different from baseline. Importantly, the model allowed for the possibility that λ = 0 meaning that no adaptive thermogenic mechanism was required to fit the data from the Minnesota experiment. The amount that the best fit value for λ differs from zero provides an indication of the extent of adaptive thermogenesis that occurred during the Minnesota experiment.
Physical Activity Expenditure
The energy expended for typical physical activities, such as walking or running, is proportional to the body weight of the individual (61). Thus, the following equation was used for the physical activity expenditure:
| [6] |
where δ was the physical activity coefficient (in kcal/kg/d) that defined the daily physical activity level, and BW = L + F was the body weight. The proportion of adaptive thermogenesis, T, that was allocated to the modification of physical activity energy expenditure was determined by the parameter σ that was computed from the measured RMR data from the Minnesota experiment. The adaptation of PAE with T did not distinguish between altered efficiency versus amount of muscular work.
The activity coefficient, δ, in the Minnesota experiment was chosen to linearly decrease at the onset of semi-starvation from its basal value, δb, to reach a minimum value, δs, by the end of the semi-starvation period corresponding to the observed decrease of voluntary physical activity and the “activity drive” (36, 58). I used the measured RMR values during the baseline period and at the end of the semi-starvation period to estimate the activity coefficients as follows:
| [7] |
where the index i indicates that the expression was used to compute the physical activity coefficient for measurements taken at either during the baseline period (i=b) or the end of the semi-starvation period (i=s). While the metabolizable energy intake and expenditure were closely balanced during the baseline feeding period, this is only an approximation at the end of the semi-starvation period where body weight was changing slowly. During the 20-week re-feeding phase, I assumed that δ linearly returned to its basal value at the end of the re-feeding period.
Resting Metabolic Rate
RMR includes the energy required to maintain irreversible metabolic fluxes such as de novo lipogenesis and gluconeogenesis, as well as the turnover costs for protein, fat, and glycogen. The following equation included these components:
| [8] |
where εd = 0.8 was the efficiency of de novo lipogenesis (25), εg = 0.8 was the efficiency of gluconeogenesis (9), and the constant Ec was a parameter chosen to ensure that the model achieved energy balance during the balanced baseline diet (see the section on Nutrient Balance Parameter Constraints below).
The specific metabolic rate of adipose tissue was γF = 4.5 kcal/kg/d. The brain metabolic rate was γB = 240 kcal/kg/d and its mass was MB = 1.4 kg which does not change with weight gain or loss (22). The basal specific metabolic rate of the lean tissue cell mass, , was determined by the average organ masses and their specific metabolic rates according to the following equation:
| [9] |
where γi and Mi are the average specific metabolic rate and mass of the organ indexed by i, respectively. The organs included skeletal muscle (γSM = 13 kcal/kg/d, MSM = 28 kg), liver (γL = 200 kcal/kg/d, ML = 1.8 kg), kidney (γK = 440 kcal/kg/d, MK = 0.31 kg), heart (γH = 440 kcal/kg/d, MH = 0.33 kg), and residual lean tissue mass (γR = 12 kcal/kg/d, MR = 23.2 kg) as provided by Elia (22). Adaptive thermogenesis affected the baseline specific metabolic rate for lean tissue cell mass according to the following equation:
| [10] |
The last six terms of equation 8 accounted for the energy cost for turnover of protein, fat, and glycogen. Consider the energy cost for protein turnover with a synthesis rate SynthP and a degradation rate DP (in g/day). I assumed that it cost ηPSynthP to synthesize P and that the energy required for degradation was εPDP. Since dP/dt = SynthP − DP, the energy cost for protein turnover was given by (ηP+εP)DP + ηPdP/dt. Similar arguments led to the other terms of equation 8 representing the energy costs for fat and glycogen turnover where the energy cost for degradation was negligible. The values for the parameters were: ηF = 0.18 kcal/g, ηG = 0.21 kcal/g, εP = 0.17 kcal/g, and ηP = 0.86 kcal/g. These values were determined from the adenosine triphosphate (ATP) costs for the respective biochemical pathways (9, 20) (i.e., 8 ATP per TG synthesized, 2 ATP per glycosyl unit of glycogen synthesized, 4 ATP per peptide bond synthesized plus 1 ATP for amino acid transport, and 1 ATP per peptide bond hydrolyzed). I assumed that 19 kcal of macronutrient oxidation was required to synthesize 1 mol ATP (22).
Daily Average Lipolysis
The daily average lipolysis rate, DF, was modeled as:
| [11] |
where was the baseline daily average TG turnover rate given by 2/3 of the fed lipolysis rate plus 1/3 of the overnight fasted lipolysis rate (34). The first (F/Fb)2/3 factor accounted for the dependence of the basal lipolysis rate on the total fat mass and the 2/3 power reflected the hypothesis that basal lipolysis scales with adipocyte surface area (63).
The term in the square brackets accounted for the modulation of lipolysis by the carbohydrate content of the diet. For example, complete starvation (CI = 0) stimulated average daily lipolysis by a factor of AL = 3.1 as computed by dividing the glycerol rate of appearance (Ra) following a 60 hour fast (12) by the daily average glycerol Ra (69). Halving the carbohydrate content of the diet increased the average lipolysis rate by factor of 1.4 as estimated by the increased area under the circulating FFA curve following an isocaloric meal consisting of 33% versus 66% carbohydrate (69). Given the above value for AL, the effect of halving the carbohydrate content was modeled by choosing BL = 0.9. The following choice for kL ensured that the lipolysis rate was normalized for the baseline diet:
| [12] |
While obesity increases basal lipolysis, the stimulatory effect of decreased carbohydrate intake is impaired (70). This effect was modeled by dividing the exponential by the maximum of 1 and (F/Fb)2/3 such that the curve of lipolysis versus CI becomes flattened as fat mass increases.
Daily Average Proteolysis
The daily average protein degradation rate, DP, was given by:
| [13] |
where was the baseline daily protein turnover rate (62) and I assumed that the protein degradation rate was proportional to the normalized protein content of the body.
Daily Average Glycogenolysis
The daily average glycogen degradation rate, DG, was given by the following equation:
| [14] |
where the baseline glycogen turnover rate, , was determined by assuming that 70% was from hepatic glycogenolysis and 30% from skeletal muscle with the hepatic contribution computed as 2/3 of the fed plus 1/3 of the overnight fasted hepatic glycogenolysis rate (44).
Daily Average Fat, Protein, and Glycogen Synthesis Rates
Mass conservation required that the daily average synthesis rates of fat, protein, and glycogen (SynthF, SynthP, and SynthG, respectively) were given by:
| [15] |
Glycerol 3-P Production
Because adipose tissue lacks glycerol kinase, the glycerol 3-P backbone of adipose TG is derived primarily from glucose. Thus, the TG synthesis rate, SynthF, determined the rate of glycerol 3-P production, G3P, according to:
| [16] |
where MG = 92 g/mol and MTG = 860 g/mol are the molecular weights of glycerol and TG, respectively.
Glycerol Gluconeogenesis
Lipolysis of both endogenous and exogenous TG results in the release of glycerol that can be converted to glucose via gluconeogenesis (7). Recently, Trimmer et al. demonstrated that glycerol disappearance could be fully accounted for by glucose production (60). Therefore, I assumed that all exogenous and endogenous glycerol entered the GNG pathway according to:
| [17] |
Since glycerol cannot be used by adipose tissue for TG synthesis due to lack of glycerol kinase, all glycerol released by lipolysis is eventually oxidized (apart from a negligibly small amount incorporated in altered pool sizes of non-adipose TG). By assuming that all glycerol enters the GNG pathway, any model error was limited to an overestimate of the energy expenditure associated with glycerol’s initial conversion to glucose prior to oxidation. This error must be very small since the total energy cost for glycerol GNG in the balanced state was only 25 kcal/d.
Net Gluconeogenesis from amino acids
The GNGP rate in the model referred to the net rate of gluconeogenesis from amino acid-derived carbon. While all amino acids except leucine and lysine can be used as gluconeogenic substrates, the primary gluconeogenic amino acids are alanine and glutamine. Much of alanine gluconeogenesis does not contribute to the net amino acid gluconeogenic rate since the carbon skeleton of alanine is largely derived from carbohydrate precursors via skeletal muscle glycolysis (51). Nurjhan et al. used a multiple isotopic tracer methodology to determine that the net glutamine and alanine gluconeogenic rate derived from amino acid carbon was at least 66 kcal/d in normal humans (48). Because the tracer techniques are known to underestimate gluconeogenesis by as much as 40% due to carbon exchange in the Krebs cycle (35), I estimated that the net basal gluconeogenic rate from amino acids, GN̂GP, was 100 kcal/d.
Several factors may regulate GNGP, but for simplicity I have assumed that GNGP was proportional to the normalized proteolysis rate and was influenced by the diet as follows:
| [18] |
where the coefficients ΓC = 0.5 and ΓP = 0.3 were determined by solving equation 18 using two sets of data. The first measured a 56% increase of gluconeogenesis when protein intake was increased by a factor of 2.5 fold and carbohydrate intake was decreased by 20% (42). The second study measured a 42% decrease of alanine gluconeogenesis when both carbohydrate and protein were increased by 2.1 fold (15).
De Novo Lipogenesis
DNL occurs in both the liver and adipose tissue. Under free-living conditions, adipose DNL has recently been measured to contribute about 20% of new TG with a measured TG turnover rate of about 50 g/d (57). Thus, adipose DNL is about 94 kcal/d. Measurements of daily hepatic DNL in circulating very low-density lipoproteins (VLDL) have found that about 7% of VLDL TG occurs via DNL when consuming a basal diet of 30% fat, 50% carbohydrate, and 15% protein (33). Given that the daily VLDL TG secretion rate is about 33 g/d (56), this corresponds to a hepatic DNL rate of about 22 kcal/d. For an isocaloric diet of 10% fat, 75% carbohydrate, and 15% protein, hepatic DNL increases to 113 kcal/d (33).
When carbohydrate intake is excessively large and glycogen is saturated, DNL can be greatly amplified (2). Therefore, I modeled DNL as a Hill function of the normalized glycogen content with a maximum DNL rate given by the carbohydrate intake rate:
| [19] |
I chose KDNL =2 and d = 4 such that the computed DNL rate corresponded with measured in vivo DNL rates for experimentally determined carbohydrate intakes and estimated glycogen levels (1, 2, 33, 57).
Macronutrient Oxidation Rates
The whole-body energy expenditure was equal to the sum of the carbohydrate, fat, and protein oxidation rates. I assumed that the minimum carbohydrate oxidation rate was equal to the sum of the gluconeogenic rates. Thus, the remaining energy expenditure was apportioned between carbohydrate, fat, and protein oxidation according to the fractions fC, fF, and fP, respectively. Therefore, the substrate oxidation rates were given by:
| [20] |
The substrate oxidation fraction for each macronutrient depends on a number of factors. First, increased lipolysis leads to concomitant increased fatty acid oxidation (12). Second, carbohydrate oxidation depends on the carbohydrate intake as well as the glycogen content (Fery, Laurent). Third, protein and carbohydrate intake directly stimulate protein and carbohydrate oxidation, respectively, but fat intake does not directly stimulate fat oxidation (26, 55). Fourth, I assumed that lean tissue supplies amino acids for oxidation in proportion to the proetolysis rate. Finally, while inactivity causes muscle wasting (8), increased physical activity may promote nitrogen retention (10, 59, 67) and the physical activity expenditure is primarily accounted for by increased oxidation of fat and carbohydrate (67). I modeled these effects by decreasing the fraction of energy expenditure derived from protein oxidation as physical activity increases.
Based on these physiological considerations, the substrate oxidation fractions were computed according to the following expressions:
| [21] |
where the w’s and S’s were dimensionless model parameters, ΔCI and ΔPI were changes from the basal carbohydrate intake, CIb, and protein intake, PIb, respectively. The small parameter, Gmin = 1 g, was chosen such that carbohydrate oxidation was restrained when glycogen was depleted. To normalize for the baseline physical activity, the constant kA was chosen such that kA = ln(SA). Z was a normalization factor equal to the sum of the numerators.
Respiratory Gas Exchange
Oxidation of carbohydrate, fat, and protein was associated with consumption of oxygen (O2) and production of carbon dioxide (CO2) according to the stoichiometry of the net biochemical reactions (23):
| [22] |
Gluconeogenesis, lipogenesis and glycerol 3-P production also contribute to gas exchange according to the following net reactions (21, 23):
| [23] |
Oxidation of carbohydrate, fat, and protein can either occur directly, or subsequent to intermediate exchange via lipogenesis or gluconeogenesis. In either case, the final ratio of CO2 produced to O2 consumed (i.e., the respiratory quotient) is independent of any intermediate exchanges in accordance with the principles of indirect calorimetry (23).
The simulated O2 consumption (VO2) and CO2 production (VCO2) (in L/day) were computed according to:
| [24] |
The respiratory quotient, RQ, was computed by dividing VCO2 by VO2 (23). To compute the non-protein respiratory quotient, NPRQ, the total nitrogen excretion was calculated:
| [25] |
where the factor 6.25 was the number of grams of protein per gram of nitrogen.
Nutrient Balance Parameter Constraints
The initial feeding period of the Minnesota experiment provided a controlled diet for several weeks to maintain the baseline body weight. I assumed that this basal diet achieved a state of nutrient and energy balance such that TEE = MEIb, where the subscript b refers to the balanced state. Therefore, at energy and nutrient balance:
| [26] |
which can be solved for the constant Ec.
Nutrient balance implies that the left hand sides of equations 1 are zero. Thus, rearrangement of the nutrient balance equations gave:
| [27] |
By substituting equation 20 and equation 21 at nutrient balance, I obtained:
| [28] |
These equations were rearranged in matrix form as:
| [29] |
Elementary algebra led to the following parameter constraints required to achieve nutrient balance:
| [30] |
Carbohydrate Perturbation Constraint
The parameters wC and SC determined how the model adapted to changes of carbohydrate intake. I specified that an additional dietary carbohydrate intake, ΔCI, above baseline, CIb, resulted in an initial positive carbohydrate imbalance of κCΔCI, where 0 < κC < 1 specified the proportion of ΔCI directed towards glycogen storage. Thus, the glycogen increment was ΔG = κC ΔCI/ρC. The goal was to solve for the parameter SC such that the correct amount of carbohydrate was oxidized and deposited as glycogen during short-term carbohydrate overfeeding. Based on the carbohydrate overfeeding study of Horton et al., I chose κC = 0.5 when ΔCI = 1500 kcal/d (32).
The change of total energy expenditure was given by:
| [31] |
For a carbohydrate perturbation, the perturbed energy expenditure components were:
| [32] |
| [33] |
| [34] |
where
| [34] |
was the average value of the thermogenesis parameter, T, over one day and ΔDNL was computed at the midpoint of the glycogen increment according to:
| [35] |
The change of the gluconeogenic rate, ΔGNG, was given by:
| [36] |
The carbohydrate balance equation gave:
| [37] |
where
| [38] |
and
| [39] |
Therefore,
| [40] |
where Θ was defined as:
| [41] |
Using equation 21, I solved equation 40 for SC which gave the carbohydrate feeding constraint:
| [42] |
where
| [43] |
Protein Perturbation Constraint
The parameters wP and SP determined how the model adapted short-term substrate oxidation rates to changes of protein intake. In a meticulous study of whole-body protein balance, Oddoye and Margen measured nitrogen balance in subjects consuming isocaloric diets with moderate or high protein content (49). These studies found that almost all of the additional dietary nitrogen on the high protein diet was rapidly excreted such that κP = 0.07 when ΔPI = 640 kcal/d, ΔCI = −310 kcal/d, and ΔFI = −330 kcal/d.
To compute the value for SP to match the data of Oddoye and Margen, I began with the protein balance equation:
| [44] |
where the changes of gluconeogenic rates were given by:
| [45] |
The change of total energy expenditure was given by:
| [46] |
where
| [47] |
and
| [48] |
Since the perturbed diet was isocaloric and there were no changes of physical activity,
| [49] |
Furthermore, I assumed that glycogen would remain relatively unchanged with the isocaloric diet perturbation since ΔCI was small and its effect was counterbalanced by changes of GNG due to the large increase of protein intake. Therefore, I assumed that:
| [50] |
Using equation 21, I solved equation 44 for SP which gave the following constraint:
| [51] |
where Φ was defined as:
| [52] |
and
| [53] |
Model Parameter Values
The model parameter values listed above were obtained from the cited published literature and are listed in Table 1. The parameters, SA, wP, wC, λ, and σ were determined using a downhill simplex algorithm (52) to minimize the sum of squares of weighted residuals between the simulation outputs and the data from the Minnesota human starvation experiment (36). I used the following measurement error estimates to define the weights for the parameter optimization algorithm: ΔBW = 0.2 kg, ΔFM = 1 kg, and ΔRMR = 50 kcal/d. The best fit parameter values are listed in Table 2, and the constrained parameters are listed in Table 3.
Table 1.
Model parameters determined from published data.
| Parameter | Value | Description |
|---|---|---|
| ρF | 9.4 kcal/g | Energy density of F |
| ρP | 4.7 kcal/g | Energy density of P |
| ρG | 4.2 kcal/g | Energy density of G |
| BM | 2.7 kg | Bone mass |
| hP | 2 g H2O/g | P hydration coefficient |
| hG | 2.7 g H2O/g | G hydration coefficient |
| ηF | 0.18 kcal/g | F synthesis cost |
| ηP | 0.86 kcal/g | P synthesis cost |
| εP | 0.17 kcal/g | P degradation cost |
| ηG | 0.21 kcal/g | G synthesis cost |
| εd | 0.8 | DNL efficiency |
| εg | 0.8 | GNG efficiency |
| αF | 0.025 | TEF factor for FI |
| αC | 0.075 | TEF factor for CI |
| αP | 0.25 | TEF factor for PI |
| γF | 4.5 kcal/kg/d | Specific RMR for Adipose |
| 24 kcal/kg/d | Basal specific RMR for BCM | |
| AL | 3.1 | Maximum Lipolysis change |
| BL | 0.9 | Minimum Lipolysis change |
| GN̂GP | 100 kcal/d | Basal GNGP |
| ΓC | 0.5 | Effect of CI on GNGP |
| ΓP | 0.3 | Effect of PI on GNGP |
| KDNL | 2 | Glycogen constant for DNL |
| d | 4 | Hill coefficient for DNL |
Table 2.
Parameter values fit to the body composition data from the Minnesota experiment.
| Parameter | Value | Description |
|---|---|---|
| λ | 0.8 | Adaptive Thermogenesis constant |
| σ | 0.6 | Thermogenesis effect on PAE vs. RMR |
| wP | 0.24 | Weighting of oxidation for basal PI |
| wC | 3.2 | Weighting of oxidation for basal CI |
| SA | 4.6 | Sensitivity to PAE changes |
Table 3.
Parameter values determined from energy balance, nutrient balance, protein and carbohydrate perturbation constraints.
| Parameter | Value | Description |
|---|---|---|
| δb | 26 kcal/kg/d | Basal Physical Activity |
| δs | 9 kcal/kg/d | Minimum Physical Activity |
| Ec | −270 kcal/d | Constant Energy Expenditure |
| SPI | 7 | Sensitivity of oxidation to PI changes |
| SCI | 0.7 | Sensitivity of oxidation to CI changes |
| wG | 1.7 | Weighting of oxidation for Glycogenolysis |
| wF | 4.1 | Weighting of oxidation for Lipolysis |
REFERENCES
- 1.Aarsland A, Chinkes D, Wolfe RR. Hepatic and whole-body fat synthesis in humans during carbohydrate overfeeding. Am J Clin Nutr. 1997;65:1774–1782. doi: 10.1093/ajcn/65.6.1774. [DOI] [PubMed] [Google Scholar]
- 2.Acheson KJ, Schutz Y, Bessard T, Anantharaman K, Flatt JP, Jequier E. Glycogen storage capacity and de novo lipogenesis during massive carbohydrate overfeeding in man. Am J Clin Nutr. 1988;48:240–247. doi: 10.1093/ajcn/48.2.240. [DOI] [PubMed] [Google Scholar]
- 3.Alberts B, Bray D, Lewis J, Raff M, Roberts K, Watson JD. Molecular Biology of the Cell. 3rd ed. New York: Garland; 1994. [Google Scholar]
- 4.Alpert SS. A two-reservoir energy model of the human body. Am J Clin Nutr. 1979;32:1710–1718. doi: 10.1093/ajcn/32.8.1710. [DOI] [PubMed] [Google Scholar]
- 5.Alpert SS. A limit on the energy transfer rate from the human fat store in hypophagia. J Theor Biol. 2005;233:1–13. doi: 10.1016/j.jtbi.2004.08.029. [DOI] [PubMed] [Google Scholar]
- 6.Antonetti VW. The equations governing weight change in human beings. Am J Clin Nutr. 1973;26:64–71. doi: 10.1093/ajcn/26.1.64. [DOI] [PubMed] [Google Scholar]
- 7.Baba H, Zhang XJ, Wolfe RR. Glycerol gluconeogenesis in fasting humans. Nutrition. 1995;11:149–153. [PubMed] [Google Scholar]
- 8.Blanc S, Normand S, Ritz P, Pachiaudi C, Vico L, Gharib C, Gauquelin-Koch G. Energy and water metabolism, body composition, and hormonal changes induced by 42 days of enforced inactivity and simulated weightlessness. J Clin Endocrinol Metab. 1998;83:4289–4297. doi: 10.1210/jcem.83.12.5340. [DOI] [PubMed] [Google Scholar]
- 9.Blaxter KL. Energy Metabolism in animals and Man. Cambridge: Cambridge University Press; 1989. [Google Scholar]
- 10.Butterfield GE, Calloway DH. Physical activity improves protein utilization in young men. Br J Nutr. 1984;51:171–184. doi: 10.1079/bjn19840021. [DOI] [PubMed] [Google Scholar]
- 11.Caloin M. Modeling of lipid and protein depletion during total starvation. Am J Physiol Endocrinol Metab. 2004;287:E790–E798. doi: 10.1152/ajpendo.00414.2003. [DOI] [PubMed] [Google Scholar]
- 12.Carlson MG, Snead WL, Campbell PJ. Fuel and energy metabolism in fasting humans. Am J Clin Nutr. 1994;60:29–36. doi: 10.1093/ajcn/60.1.29. [DOI] [PubMed] [Google Scholar]
- 13.Christiansen E, Garby L. Prediction of body weight changes caused by changes in energy balance. Eur J Clin Invest. 2002;32:826–830. doi: 10.1046/j.1365-2362.2002.01036.x. [DOI] [PubMed] [Google Scholar]
- 14.Christiansen E, Garby L, Sorensen TIA. Quantitative analysis of the energy requirements for development of obesity. J Theor Biol. 2005;234:99–106. doi: 10.1016/j.jtbi.2004.11.012. [DOI] [PubMed] [Google Scholar]
- 15.Clore JN, Helm ST, Blackard WG. Loss of hepatic autoregulation after carbohydrate overfeeding in normal man. J Clin Invest. 1995;96:1967–1972. doi: 10.1172/JCI118243. [DOI] [PMC free article] [PubMed] [Google Scholar]
- 16.Cunningham JJ. Body composition as a determinant of energy expenditur: a synthetic review and a proposed general prediction equation. Am J Clin Nutr. 1991;54:963–969. doi: 10.1093/ajcn/54.6.963. [DOI] [PubMed] [Google Scholar]
- 17.Dulloo AG, Jacquet J, Girardier L. Autoregulation of body composition during weight recovery in human: the Minnesota Experiment revisited. Int J Obes Relat Metab Disord. 1996;20:393–405. [PubMed] [Google Scholar]
- 18.Dulloo AG, Jacquet J, Girardier L. Poststarvation hyperphagia and body fat overshooting in humans: a role for feedback signals from lean and fat tissues. Am J Clin Nutr. 1997;65:717–723. doi: 10.1093/ajcn/65.3.717. [DOI] [PubMed] [Google Scholar]
- 19.Dulloo AG, Seydoux J, Jacquet J. Adaptive thermogenesis and uncoupling proteins: a reappraisal of their roles in fat metabolism and energy balance. Physiol Behav. 2004;83:587–602. doi: 10.1016/j.physbeh.2004.07.028. [DOI] [PubMed] [Google Scholar]
- 20.Elia M, Zed C, Neale G, Livesey G. The energy cost of triglyceride-fatty acid recycling in nonobese subjects after an overnight fast and four days of starvation. Metabolism. 1987;36:251–255. doi: 10.1016/0026-0495(87)90184-3. [DOI] [PubMed] [Google Scholar]
- 21.Elia M, Livesey G. Theory and validity of indirect calorimetry during net lipid synthesis. Am J Clin Nutr. 1988;47:591–607. doi: 10.1093/ajcn/47.4.591. [DOI] [PubMed] [Google Scholar]
- 22.Elia M. Organ and tissue contribution to metabolic rate. In: Kinney JM, Tucker HN, editors. Energy metabolism: tissue determinants and cellular corollaries. New York: Raven Press; 1992. [Google Scholar]
- 23.Ferrannini E. The theoretical basis of indirect calorimetry: a review. Metabolism. 1988;37:287–301. doi: 10.1016/0026-0495(88)90110-2. [DOI] [PubMed] [Google Scholar]
- 24.Fery F, Plat L, Balasse EO. Level of glycogen stores and amount of ingested glucose regulate net carbohydrate storage by different mechanisms. Metabolism. 2003;52:94–101. doi: 10.1053/meta.2003.50015. [DOI] [PubMed] [Google Scholar]
- 25.Flatt JP. Conversion of carbohydrate to fat in adipose tissue: an energy-yielding and, therefore, self-limiting process. J Lipid Res. 1970;11:131–143. [PubMed] [Google Scholar]
- 26.Flatt JP, Ravussin E, Acheson KJ, Jequier E. Effects of dietary fat on postprandial substrate oxidation and on carbohydrate and fat balances. J Clin Invest. 1985;76:1019–1024. doi: 10.1172/JCI112054. [DOI] [PMC free article] [PubMed] [Google Scholar]
- 27.Flatt JP. Importance of nutrient balance in body weight regulation. Diabetes Metab Rev. 1988;4:571–581. doi: 10.1002/dmr.5610040603. [DOI] [PubMed] [Google Scholar]
- 28.Flatt JP. Carbohydrate-fat interactions and obesity examined by a two-compartment computer model. Obes Res. 2004;12:2013–2022. doi: 10.1038/oby.2004.252. [DOI] [PubMed] [Google Scholar]
- 29.Food and Nutrition Board, Institute of Medicine. Dietary reference intakes for energy, carbohydrate, fiber, fat, fatty acids, cholesterol, protein, and amino acids (macronutrients): A report of the panel on macronutrients, subcommittees on upper reference levels of nutrients and interpretation and uses of dietary reference intakes, and the standing committee on the scientific evaluation of dietary reference intakes ( http://www.nap.edu/books/0309085373/html/)
- 30.Friedlander AL, Braun B, Pollack M, MacDonald JR, Fulco CS, Muza SR, Rock PB, Henderson GC, Horning MA, Brooks GA, Hoffman AR, Cymerman A. Three weeks of caloric restriction alters protein metabolism in normal-weight, young men. Am J Physiol Endocrinol Metab. 2005;289:E446–E455. doi: 10.1152/ajpendo.00001.2005. [DOI] [PubMed] [Google Scholar]
- 31.Hill JO, Peters JC, Reed GW, Schlundt DG, Sharp T, Greene HL. Nutrient balance in humans: effects of diet composition. Am J Clin Nutr. 1991;54:10–17. doi: 10.1093/ajcn/54.1.10. [DOI] [PubMed] [Google Scholar]
- 32.Horton TJ, Drougas H, Brachey A, Reed GW, Peters JC, Hill JO. Fat and carbohydrate overfeeding in humans: different effects on energy storage. Am J Clin Nutr. 1995;62:19–29. doi: 10.1093/ajcn/62.1.19. [DOI] [PubMed] [Google Scholar]
- 33.Hudgins LC, Hellerstein MK, Seidman CE, Neese RA, Tremaroli JD, Hirsch J. Relationship between carbohydrate-induced hypertriglyceridemia and fatty acid synthesis in lean and obese subjects. J Lipid Res. 2000;41:595–604. [PubMed] [Google Scholar]
- 34.Jensen MD. Regional glycerol and free fatty acid metabolism before and after meal ingestion. Am J Physiol. 1999;276:E863–E869. doi: 10.1152/ajpendo.1999.276.5.E863. [DOI] [PubMed] [Google Scholar]
- 35.Katz J. Determination of gluconeogenesis in vivo with 14C-labeled substrates. Am J Physiol. 1985;248:R391–R399. doi: 10.1152/ajpregu.1985.248.4.R391. [DOI] [PubMed] [Google Scholar]
- 36.Keys A. The biology of human starvation. Minneapolis: University of Minnesota Press; 1950. [Google Scholar]
- 37.Kozusko FP. Body weight setpoint, metabolic adaption and human starvation. Bull Math Biol. 2001;63:393–403. doi: 10.1006/bulm.2001.0229. [DOI] [PubMed] [Google Scholar]
- 38.Kozusko FP. The effects of body composition on setpoint based weight loss. Math Comp Model. 2002;35:973–982. [Google Scholar]
- 39.Laurent D, Hundal RS, Dresner A, Price TB, Vogel SM, Petersen KF, Shulman GI. Mechanism of muscle glycogen autoregulation in humans. Am J Physiol Endocrinol Metab. 2000;278:E663–E668. doi: 10.1152/ajpendo.2000.278.4.E663. [DOI] [PubMed] [Google Scholar]
- 40.Leibel RL, Rosenbaum M, Hirsch J. Changes in energy expenditure resulting from altered body weight. N Engl J Med. 1995;332:621–628. doi: 10.1056/NEJM199503093321001. [DOI] [PubMed] [Google Scholar]
- 41.Levine JA, Eberhardt NL, Jensen MD. Role of nonexercise activity thermogenesis in resistance to fat gain in humans. Science. 1999;283:212–214. doi: 10.1126/science.283.5399.212. [DOI] [PubMed] [Google Scholar]
- 42.Linn T, Santosa B, Gronemeyer D, Aygen S, Scholz N, Busch M, Bretzel RG. Effect of long-term dietary protein intake on glucose metabolism in humans. Diabetologia. 2000;43:1257–1265. doi: 10.1007/s001250051521. [DOI] [PubMed] [Google Scholar]
- 43.Livesey G, Elia M. Estimation of energy expenditure, net carbohydrate utilization, and net fat oxidation and synthesis by indirect calorimetry: evaluation of errors with special reference to the detailed composition of fuels. Am J Clin Nutr. 1988;47:608–628. doi: 10.1093/ajcn/47.4.608. [DOI] [PubMed] [Google Scholar]
- 44.Magnusson I, Rothman DL, Jucker B, Cline GW, Shulman RG, Shulman GI. Liver glycogen turnover in fed and fasted humans. Am J Physiol. 1994;266:E796–E803. doi: 10.1152/ajpendo.1994.266.5.E796. [DOI] [PubMed] [Google Scholar]
- 45.McBride JJ, Guest MM, Scott EL. The storage of the major liver components; emphasizing the relationship of glycogen to water in the liver and the hydration of glycogen. J. Biol. Chem. 1941;139:943–952. [Google Scholar]
- 46.Nelson KM, Weinsier RL, Long CL, Schutz Y. Prediction of resting energy expenditure from fat-free mass and fat mass. Am J Clin Nutr. 1992;56:848–856. doi: 10.1093/ajcn/56.5.848. [DOI] [PubMed] [Google Scholar]
- 47.Novotny JA, Rumpler WV. Modeling of energy expenditure and resting metabolic rate during weight loss in humans. Adv Exp Med Biol. 1998;445:293–302. doi: 10.1007/978-1-4899-1959-5_19. [DOI] [PubMed] [Google Scholar]
- 48.Nurjhan N, Bucci A, Perriello G, Stumvoll M, Dailey G, Bier DM, Toft I, Jenssen TG, Gerich JE. Glutamine: a major gluconeogenic precursor and vehicle for interorgan carbon transport in man. J Clin Invest. 1995;95:272–277. doi: 10.1172/JCI117651. [DOI] [PMC free article] [PubMed] [Google Scholar]
- 49.Oddoye EA, Margen S. Nitrogen balance studies in humans: long-term effect of high nitrogen intake on nitrogen accretion. J Nutr. 1979;109(3):363–377. doi: 10.1093/jn/109.3.363. [DOI] [PubMed] [Google Scholar]
- 50.Payne PR, Dugdale AE. A model for the prediction of energy balance and body weight. Ann Hum Biol. 1977;4:525–535. doi: 10.1080/03014467700002521. [DOI] [PubMed] [Google Scholar]
- 51.Perriello G, Jorde R, Nurjhan N, Stumvoll M, Dailey G, Jenssen T, Bier DM, Gerich JE. Estimation of glucose-alanine-lactate-glutamine cycles in postabsorptive humans: role of skeletal muscle. Am J Physiol. 1995;269:E443–E450. doi: 10.1152/ajpendo.1995.269.3.E443. [DOI] [PubMed] [Google Scholar]
- 52.Press WH, Teukolsky SA, Vetterling WT, Flannery BP. Numerical recipes in C: the art of scientific computing. New York: Cambridge University Press; 1988. [Google Scholar]
- 53.Rosenbaum M, Hirsch J, Murphy E, Leibel RL. Effects of changes in body weight on carbohydrate metabolism, catecholamine excretion, and thyroid function. Am J Clin Nutr. 2000;71:1421–1432. doi: 10.1093/ajcn/71.6.1421. [DOI] [PubMed] [Google Scholar]
- 54.Rosenbaum M, Vandenborne K, Goldsmith R, Simoneau JA, Heymsfield S, Joanisse DR, Hirsch J, Murphy E, Matthews D, Segal KR, Leibel RL. Effects of experimental weight perturbation on skeletal muscle work efficiency in human subjects. Am J Physiol. 2003;285:R183–R192. doi: 10.1152/ajpregu.00474.2002. [DOI] [PubMed] [Google Scholar]
- 55.Schutz Y, Flatt JP, Jequier E. Failure of dietary fat intake to promote fat oxidation: a factor favoring the development of obesity. Am J Clin Nutr. 1989;50:307–314. doi: 10.1093/ajcn/50.2.307. [DOI] [PubMed] [Google Scholar]
- 56.Sidossis LS, Magkos F, Mittendorfer B, Wolfe RR. Stable isotope tracer dilution for quantifying very low-density lipoprotein-triacylglycerol kinetics in man. Clin Nutr. 23;2004:457–466. doi: 10.1016/j.clnu.2003.11.006. [DOI] [PubMed] [Google Scholar]
- 57.Strawford A, Antelo F, Christiansen M, Hellerstein MK. Adipose tissue triglyceride turnover, de novo lipogenesis, and cell proliferation in humans measured with 2H2O. Am J Physiol. 2004;286:E577–E588. doi: 10.1152/ajpendo.00093.2003. [DOI] [PubMed] [Google Scholar]
- 58.Taylor HL, Keys A. Adaptation to caloric restriction. Science. 1950;112:215–218. doi: 10.1126/science.112.2904.215. [DOI] [PubMed] [Google Scholar]
- 59.Todd KS, Butterfield GE, Calloway DH. Nitrogen balance in men with adequate and deficient energy intake at three levels of work. J Nutr. 1984;114:2107–2118. doi: 10.1093/jn/114.11.2107. [DOI] [PubMed] [Google Scholar]
- 60.Trimmer JK, Casazza GA, Horning MA, Brooks GA. Autoregulation of glucose production in men with a glycerol load during rest and exercise. Am J Physiol Endocrinol Metab. 2001;280:E657–E668. doi: 10.1152/ajpendo.2001.280.4.E657. [DOI] [PubMed] [Google Scholar]
- 61.van der Walt WH, Wyndham CH. An equation for prediction of energy expenditure of walking and running. J Appl Physiol. 1973;34:559–563. doi: 10.1152/jappl.1973.34.5.559. [DOI] [PubMed] [Google Scholar]
- 62.Wagenmakers AJ. Tracers to investigate protein and amino acid metabolism in human subjects. Proc Nutr Soc. 1999;58:987–1000. doi: 10.1017/s0029665199001305. [DOI] [PubMed] [Google Scholar]
- 63.Wang Y, Sullivan S, Trujillo M, Lee MJ, Schneider SH, Brolin RE, Kang YH, Werber Y, Greenberg AS, Fried SK. Perilipin expression in human adipose tissues: effects of severe obesity, gender, and depot. Obes Res. 2003;11:930–936. doi: 10.1038/oby.2003.128. [DOI] [PubMed] [Google Scholar]
- 64.Weinsier RL, Bracco D, Schutz Y. Predicted effects of small decreases in energy expenditure on weight gain in adult women. Int J Obes Relat Metab Disord. 1993;17:693–700. [PubMed] [Google Scholar]
- 65.Weinsier RL, Nagy TR, Hunter GR, Darnell BE, Hensrud DD, Weiss HL. Do adaptive changes in metabolic rate favor weight regain in weight-reduced individuals? An examination of the set-point theory. Am J Clin Nutr. 2000;72:1088–1094. doi: 10.1093/ajcn/72.5.1088. [DOI] [PubMed] [Google Scholar]
- 66.Weinsier R, Hunter G, Schutz Y. Metabolic response to weight loss. Am J Clin Nutr. 2001;73:655–658. doi: 10.1093/ajcn/73.3.655. [DOI] [PubMed] [Google Scholar]
- 67.Welle S. Human Protein Metabolism. New York: Springer-Verlag; 1999. [Google Scholar]
- 68.Westerterp KR, Donkers JHHLM, Fredrix EWHM, Boekhoudt P. Energy intake, physical activity and body weight: a simulation model. Br J Nutr. 1995;73:337–347. doi: 10.1079/bjn19950037. [DOI] [PubMed] [Google Scholar]
- 69.Wolever TM, Bentum-Williams A, Jenkins DJ. Physiological modulation of plasma free fatty acid concentrations by diet. Metabolic implications in nondiabetic subjects. Diabetes Care. 1995;18:962–970. doi: 10.2337/diacare.18.7.962. [DOI] [PubMed] [Google Scholar]
- 70.Wolfe RR, Peters EJ, Klein S, Holland OB, Rosenblatt J, Gary H., Jr Effect of short-term fasting on lipolytic responsiveness in normal and obese human subjects. Am J Physiol. 1987;252:E189–E196. doi: 10.1152/ajpendo.1987.252.2.E189. [DOI] [PubMed] [Google Scholar]


