

Abstract
The increased susceptibility effects and high signal-to-noise ratio at 7T enable imaging of the brain using the phase of the magnetic resonance signal. This study describes and evaluates a robust method for calculating phase images from gradient-recalled echo (GRE) scans. The GRE scans were acquired at 7T using an eight-channel receive coil at spatial resolutions up to 0.195×0.260×2.00mm. The entire 7T protocol took less than 10 minutes. Data was acquired from forty-seven subjects including clinical patients with multiple sclerosis (MS) or brain tumors. The phase images were post-processed using a fully automated phase unwrapping algorithm that combined the data from the different channels. The technique was used to create the first phase images of MS patients at any field strength and the first phase images of brain tumor patients above 1.5T. The clinical images showed novel contrast in MS plaques and depicted microhemorrhages and abnormal vasculature in brain tumors with unsurpassed resolution and contrast.
Keywords: MRI, 7T, phase, susceptibility, contrast, multiple sclerosis, brain tumor
INTRODUCTION
The evaluation of changes due to aging or disease pathology would benefit from alternative mechanisms for generating tissue contrast in images of the brain. Although the majority of the applications of MR imaging have focused on the magnitude of the complex-valued signal, it is known that there is information about local variations of the B0 field in the phase component. Evidence that this may be of interest for aging comes from autopsy studies reporting the accumulation of iron in anatomic structures such as the substantia nigra, red nucleus and basal ganglia (Hallgren et al., 1958; Morris et al., 1992). Previous studies that have used phase sensitive imaging have considered the visualization of cortical matter (Ogg et al., 1999; Abduljalil et al., 2003; Haacke et al., 2005; Rauscher et al., 2005;Haacke et al., 2007; Duyn et al., 2007) and the generation of weighted magnitude images with increased venous contrast (Haacke et al., 2004). At 1.5T these approaches have also been used to observe areas of abnormal pathology due to calvernous malformations, brain tumors and hemorrhages (Yamada et al., 1996; Rauscher et al., 2005; Deistung et al., 2006). Limitations of the methodology at this conventional field strength are the signal-to-noise ratio (SNR) and resulting spatial resolution that can be achieved.
The transition to higher field MR scanners gives accentuated susceptibility effects (Schenck, 1996) and higher SNR in the magnitude images with a corresponding decrease of noise in the phase images (Haacke et al., 1999). Despite these benefits, the higher field poses a challenge for phase imaging in that air tissue interfaces such as the sinuses, nasal cavity, external auditory canals or the effects of surgical resection create such large background fields that the phase of the signal across the image plane may exceed 2π. This causes high and low intensity stripes or ‘phase wraps’ in the phase image that confound visualization of the local anatomy. While some wrapping may be reduced by using more sophisticated shimming routines, there is a need to develop robust methods for eliminating the phase wraps in 7T images using a strategy that can be routinely applied to data acquired from patients who may have had surgery or other procedures.
With 1.5T scanners the phase wraps can be reduced by keeping the phase evolution time short, but at 7T this is not possible because the required evolution time would be shorter than the excitation pulse. Another solution that is commonly used to create field maps for shimming at 1.5T and 3T is to acquire data at two different phase evolution times and calculate the phase difference (Schneider et al., 1991; Webb et al., 1991;Wen et al., 1995; Wilson et al., 2002). While this works well for images with low spatial resolution, it causes an increase in the noise in the image and hence requires a compromise in acquisition time or spatial resolution that would undermine the benefits of scanning at 7T. Other approaches such as applying a strong high-pass filter to the raw phase data have been shown to work well for imaging anatomic structures with high spatial frequency such as vasculature and cortical gray/white matter (Abduljalil et al., 2003; Haacke et al., 2004; Haacke et al., 2007), but also remove much of the phase contrast in larger structures such as the caudate.
The solution that seemed most appropriate for 7T images and the one that we chose to implement for our study was the application of a mathematical algorithm to unwrap the phase and removal of slowly varying signal intensities to highlight high resolution structures of interest. Although phase unwrapping has recently been applied to data from normal volunteers at 7T to assess cortical gray/white matter (Duyn et al., 2007), it has never been applied to the more challenging task of evaluating 7T images from patients who have significant regions of pathology. In the following, we described the development and application of a fully automated robust technique we developed for creating phase images from high-resolution 7T GRE scans that were acquired with a multichannel radiofrequency coil. In order to make the method widely applicable we refrained from using advanced techniques such as parallel imaging, flow compensation, and high-order or real-time shimming and focused on post-processing data acquired with a pulse sequence that provided high resolution magnitude images of brain anatomy. The reconstruction and phase unwrapping algorithms were first applied to normal volunteers in order to quantify differences in magnitude and phase contrast between specific anatomic structures, and then their robustness was evaluated in patients diagnosed with multiple sclerosis (MS) or primary brain tumor.
MATERIALS AND METHODS
Data Acquisition
Forty-seven subjects were scanned with a high-resolution 2D GRE in a 7T whole body MR scanner (GE Healthcare, Milwaukee, WI). The radiofrequency coils used were a volume head transmit coil with active detuning and an eight-channel receive phased array coil (Nova Medical, Wilmington, MA). Foam pads were placed around the subject’s head to restrict motion. All subjects gave informed consent for the study in accordance with institutional review board guidelines at our medical center. Twelve subjects were normal volunteers (aged between 25 and 60 years, mean age 36.9 years, 7 male and 5 female), ten were MS patients (aged between 29 and 55 years, mean age 43.6 years, 3 male and 7 female) and twenty-five were patients with brain tumors (aged between 29 and 69, mean age 48.6 years, 15 male and 10 female). Eight of the patients with brain tumors had been diagnosed with oligodendroglioma, six with astrocytoma, two with oligoastrocytoma, seven with glioblastoma multiforme (GBM), one with ependymoma and one with a tumor of unknown origin. The patients with brain tumors also received a standard gadolinium-enhanced clinical scan at 3T for anatomic reference immediately following the 7T scan. The 7T scan was always completed prior to the 3T scan to ensure that there was no confusion between the effects of gadolinium and the effects of intrinsic tissue contrast. The 3T whole body scanner was also from GE Healthcare and was equipped with a body transit coil and an 8-channel receive array (In Vivo, Miami, FL). Two of the normal volunteers and one of the brain tumor patients were scanned with a 2D GRE at 3T to compare phase contrast across field strengths and four of the volunteers received a repeat scan at 7T to quantify magnitude and phase noise (see below).
The 7T scan protocol consisted of a 3-plane scout image followed by a high resolution GRE scan. The GRE scan was obliqued to the scout plane containing the anterior and posterior commissures. The parameters for the GRE scan were selected for high contrast between gray and white matter in the magnitude images (Xu et al., 2006) and low Specific Absorption Rate (SAR). All brain tumor patients and nine of the volunteers were scanned with this sequence at 0.352×0.352mm voxel size with a 512×512 matrix over an 18cm field-of-view (FOV), ten 2mm slices spaced 4mm apart, an echo time (TE) of 11.4ms, a repetition time (TR) of 250ms, a 20° flip angle and 3 repetitions (number of excitations, NEX) in a 6.4 minute scan. For MS patients and three of the volunteers the voxel size was decreased to 0.195×0.260mm (a 1024×768 matrix over a 20cm FOV) and the TE was increased to 15ms in a 9.6 minute scan. For the scans obtained at 3T the voxel size was increased to 0.703×0.703mm (a 256×256 matrix over an 18cm FOV) to increase SNR and the TE was decreased to 7.3ms in order to match the contrast between the magnitude gray and white matter at 7T (Xu et al., 2006).
Multichannel Image Reconstruction
Step 1: Magnitude Image Processing
The first step was to combine the magnitude of each channel in the complex image volume (Fig. 1a) using a standard root-sum-of-squares algorithm (Fig. 1b). Variations in intensity in the combined image caused by the reception profile of the phased array coils were removed by dividing by an edgefilled, low-pass filtered image (Fig 1c) using the methodology developed in our laboratory (Wald et al., 1995). A mask that defined the spatial extent of the brain parenchyma was created by thresholding the image to 5% of maximum signal and using morphological closing with a 10mm disk to remove holes (Fig. 1d).
Figure 1.
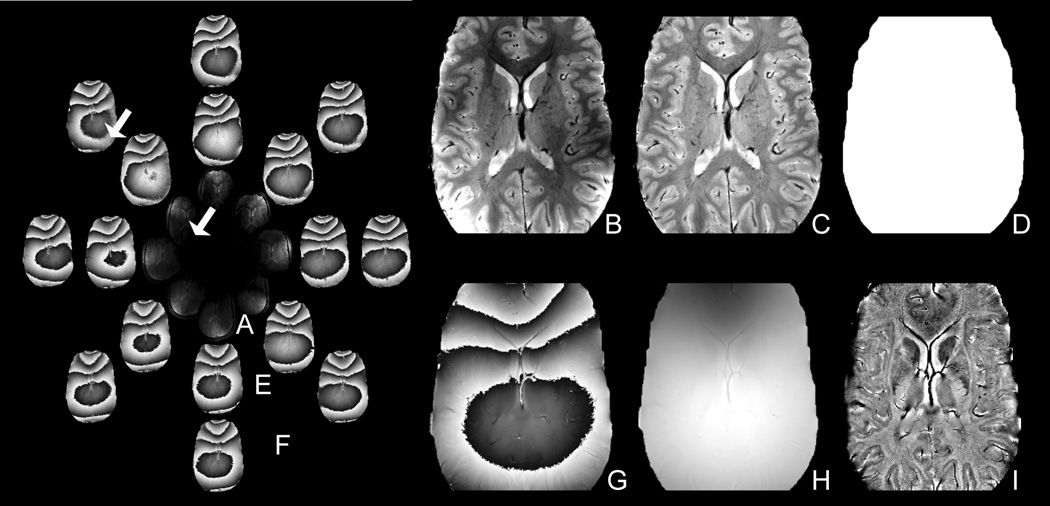
Method for reconstructing the magnitude and phase images from the complex multichannel data. The magnitude of the eight complex channels (A) was combined using a root-sum-of-squares algorithm (B), corrected for the coil sensitivity profiles (C) and masked (D). The phase of the eight complex channels (E) were shifted to remove the global phase shift between channels (F) and combined using a weighted average (Eqn. 1) to minimize noise (G). The multichannel phse images were unwrapped (H) and filtered (I). Notice the single channel phase is noisy in regions of low coil sensitivity (arrow).
Step 2: Multichannel Phase Combination
The second step was to reconstruct multichannel phase images by combining the raw, phase sensitive images from each channel of data. The global phase shift between channels was first removed by shifting the phase of each channel in the complex image volume (Fig. 1e) to set the mean phase of the center pixels to zero (Fig. 1f). A weighted average (Eqn. 1) was then used to combine the channels and minimize phase noise from regions of low coil sensitivity (indicated by the arrow in Fig. 1). In this weighted average, confidence in each channel’s phase (θ channel) was weighted by the channel’s magnitude (Mchannel) to suppress noise:
| (Equation 1) |
Step 3: Phase Unwrapping
The third step was to unwrap the multichannel phase image using the PRELUDE algorithm (Jenkinson, 2003) to generate a full range phase image (Fig. 1h). PRELUDE is an automatic phase unwrapping algorithm that segments the image into regions of low phase variation and merges regions by adding 2π offsets as necessary to minimize phase differences over the boundary. In our procedure the regions outside the brain were excluded from the unwrapping algorithm by using the magnitude mask image.
Step 4: Background Field Removal
The fourth step was to subtract an edge-filled, low-pass filtered phase image from the unwrapped global phase image to remove the large background field and highlight local anatomy. Filtering was accomplished by Fourier transforming the image into k-space and multiplying with a 10×10 Gaussian filter. As described below, this filter size was selected to remove the background field while maintaining contrast in large spatial features such as the caudate.
The phase image reconstruction technique was implemented on a Sun workstation. The technique was applied identically to both 7T and 3T datasets. Parameter selection and technique performance are discussed below.
Quantification of Noise and Image Contrast
Noise in the magnitude and phase images was calculated using the root-mean-square (RMS) of the difference in calculated pixel values between two successive identical acquisitions (as described in Hayes et al., 1991). SNR for a region-of-interest (ROI) was calculated as the mean magnitude value divided by the magnitude noise. Magnitude (or phase) contrast-to-noise ratio (CNR) between two ROIs was calculated as the difference in mean magnitude (or phase) values between the ROIs divided by the larger magnitude (or phase) noise. Evaluation of the difference in CNR between magnitude and phase images was evaluated using a paired t-test with a P value less than 0.01 being considered as significant.
RESULTS
Performance of Phase Reconstruction Algorithm
Step 1: Magnitude Image Processing
The magnitude image processing produced high quality magnitude images in all subjects and provided a mask of the brain parenchyma without contamination from other structures. The intensity correction (Wald et al., 1995) removed the bright peripheral shading caused by proximity to the phased array coils. As previously reported by Duyn et al., 2006, magnitude images accentuated vessels and gray matter structures in all subjects. The ten 7T scans of MS patients showed focal hyperintense lesions in four subjects and diffuse hyperintense regions in three subjects. The twenty-five 7T brain tumor subject scans showed resection cavities in twenty patients, residual tumor in three patients, recurrent tumor in eight patients, and distributed hemorrhages in fourteen of the twenty-one patients that had undergone radiation treatment and one of the four patients who had not undergone radiation treatment.
Step 2: Multichannel Phase Combination
As shown in Fig. 2a, the weighted average (Eqn. 1) effectively suppressed noise in the multichannel phase combination. Each point in Fig. 2a indicates the phase noise and magnitude SNR for one of the circular 10mm ROIs that was distributed over the single- and multi-channel phase image volumes. As predicted from theory (Haacke et al., 1999), phase noise in the ‘single channel’ image scaled inversely with magnitude SNR. The ‘multichannel: weighted average’ image had low noise (1.6 ± 0.5 Hz) and sat on the high-SNR portion of the inverse curve, demonstrating effective multichannel phase combination. The unweighted ‘multichannel: average’ would have only decreased the noise to 3.5 ± 2.8 Hz.
Figure 2.
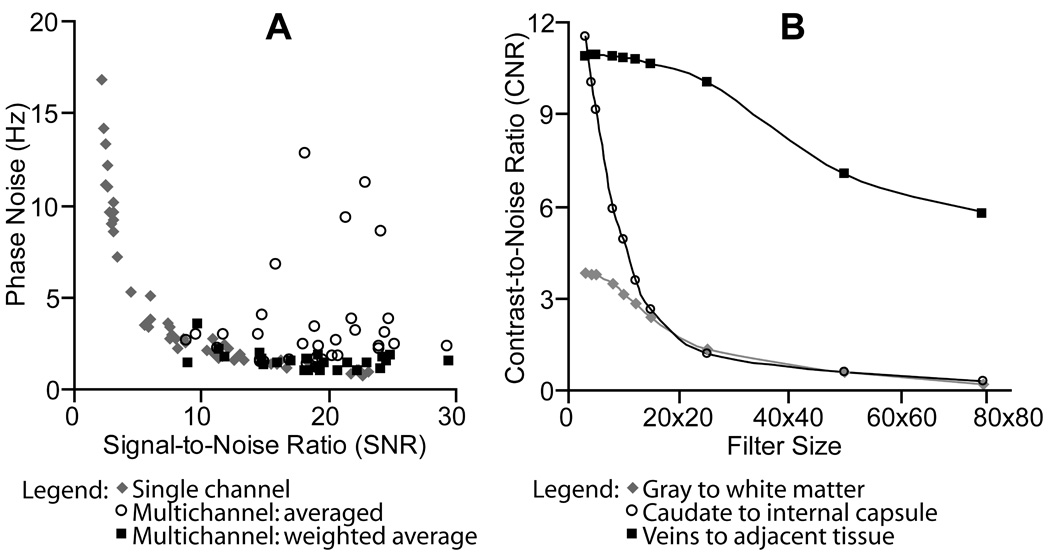
(A) Evaluation of Method Step 2: Weighting confidence in each channel’s phase by the channel’s SNR (Eqn. 1) effectively suppressed noise in the multichannel phase image. (B) Filter Selection for Method Step 5: Large filters removed phase contrast in large features such as the caudate.
Step 3: Phase Unwrapping
The total frequency range (phase range normalized by echo time) in the unfiltered image volume over all 7T scans was 715±261Hz (2.22±0.81ppm). This created an average of nine phase wraps across the image volume. The phase unwrapping was robust in all slices of all subjects except for the most inferior slices in scans of three patients with brain tumors (< 1% of slices).
Step 4: Background Field Removal
As shown in Fig. 2b, increasing filter size decreased phase CNR. The effect was most dramatic for large, spatially homogenous structures such as the caudate, which decreased CNR by 47% between a 10×10 and 15×15 filter. Smaller structures such as veins were retained with the larger filter sizes. For example, CNR in the periventricular veins dropped only 2% between a 10×10 and 15×15 filter.
As shown in Fig. 3, the advantage in using larger filters would have been to alleviate the need for phase unwrapping. Phase wraps present in the unfiltered and 5X5 or 10×10 filtered ‘wrapped phase images’ (lower row) were removed once the filter size reached 15×15. In the ‘unwrapped phase images’ (upper row) phase wraps were not present in any of the images. We found the computational expense of phase unwrapping to be justified by the phase contrast gained by using small filters (Fig. 2b). A 10×10 filter was chosen as the minimum filter size that removed the background field such that phase anatomy in an entire axial slice could be viewed at a single window level.
Figure 3.
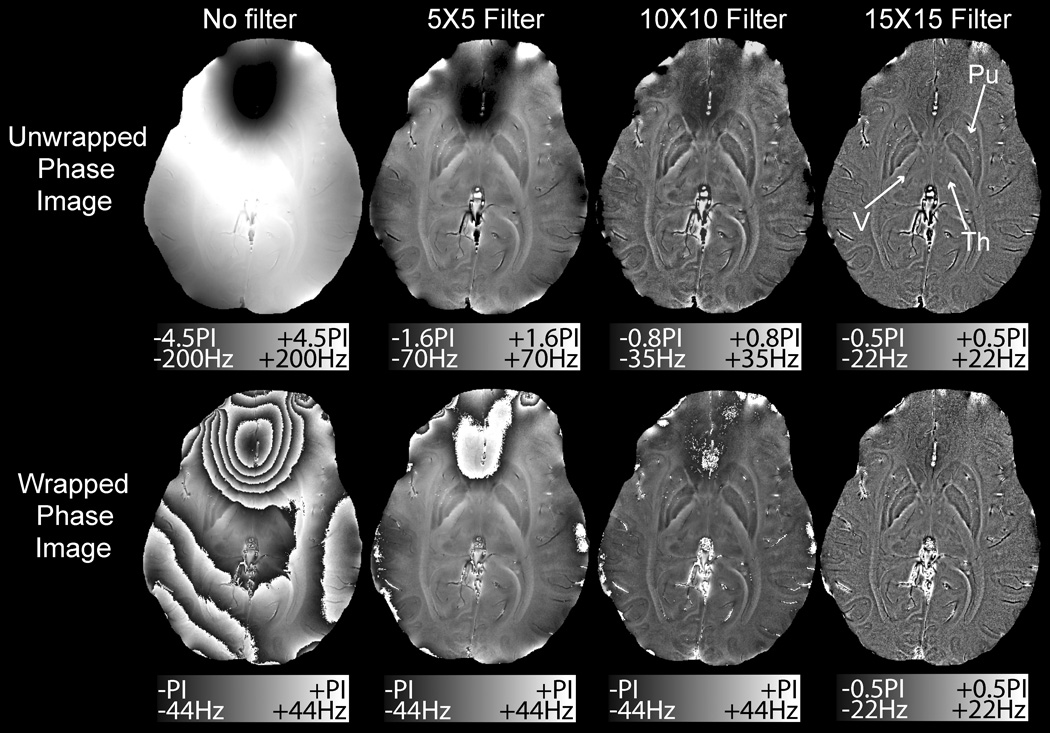
Effect of filter size on the unwrapped (top) and wrapped (bottom) phase images. A 15×15 filter removed the wraps over the frontal sinuses and highlighted veins (V), but removed much of the contrast in the thalamus (Th) and putamen (Pu)
Cortical Phase Images of Normal Volunteers at 7T
Fig. 4 shows representative phase images alongside the magnitude images reconstructed from the same complex image volume. The phase shifts, phase CNR and magnitude CNR for key anatomical structures are presented in Table 1.
Figure 4.
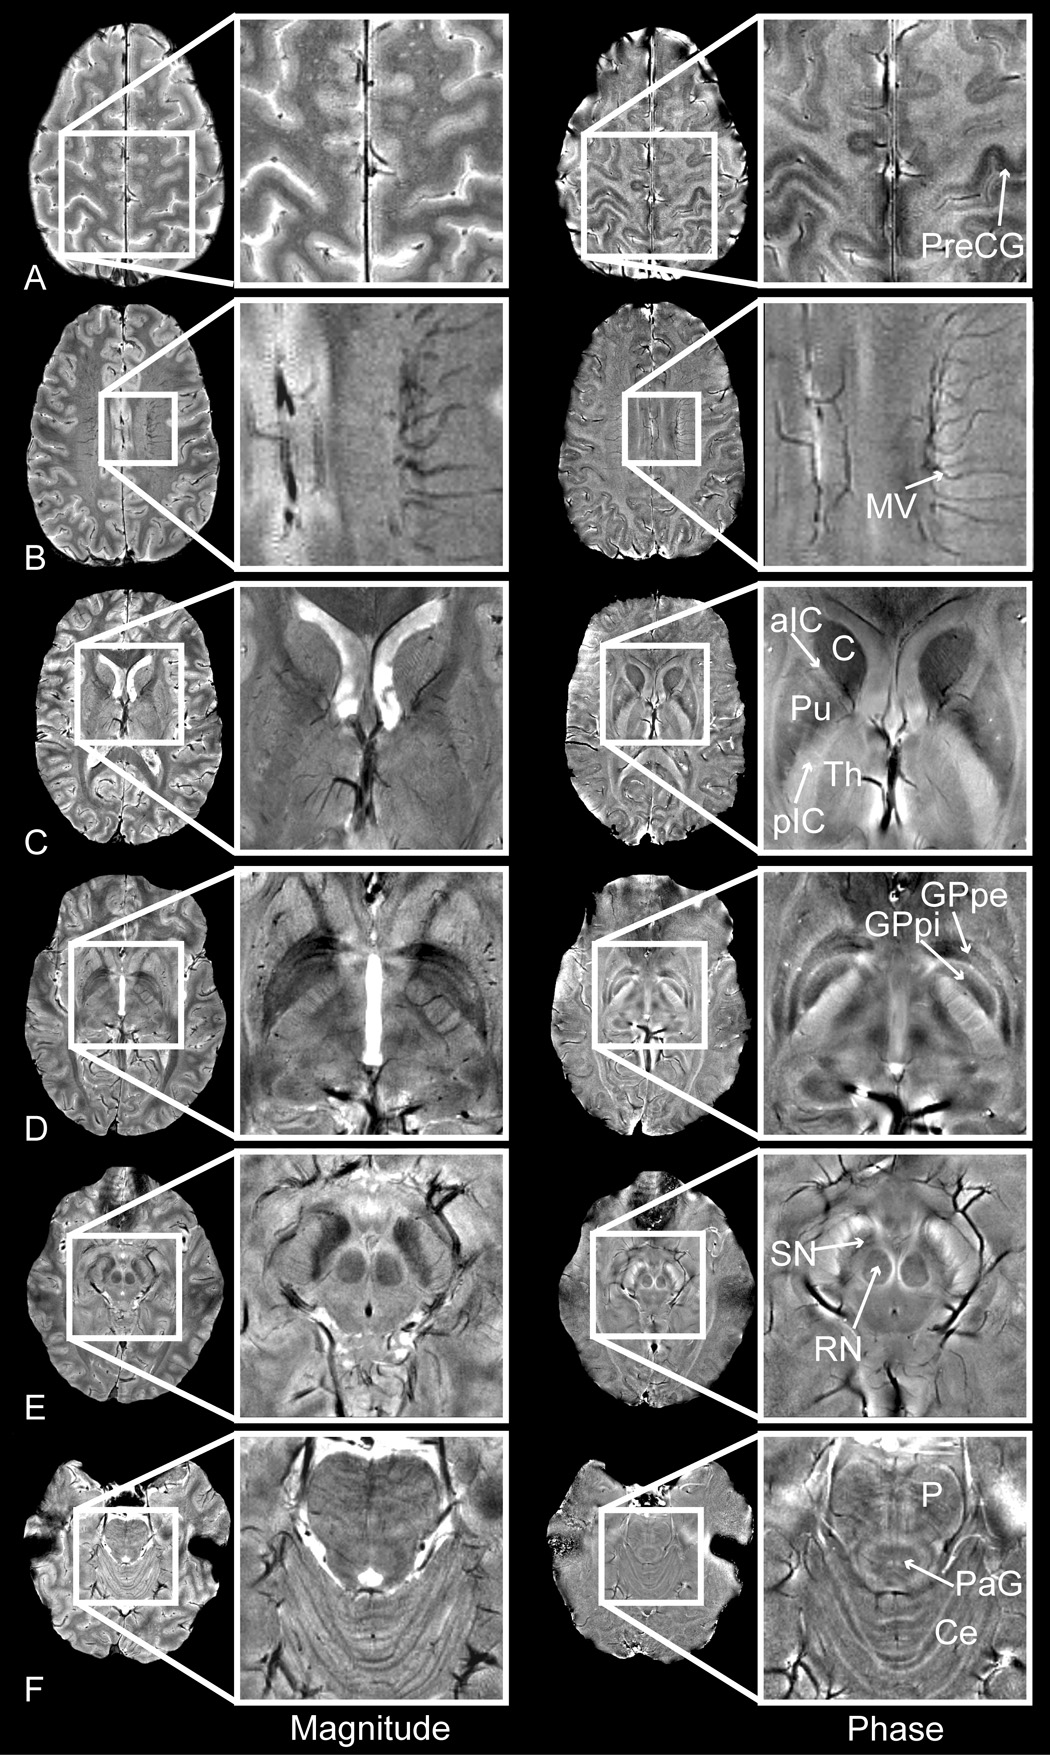
Magnitude (left) and phase (right) images of the pre-central gyrus (PreCG), medullary veins (MV), caudate (C), putamen (Pu), anterior and posterior limbs of the internal capsule (aIC/pIC), thalamus (Th), globus pallidus pars interna / pars externa (GPpi/GPpe), red nucleus (RN), substantia nigra (SN), pons (P), peri-aqueductal gray matter (PaG) and cerebellum (Ce).
Table 1.
Measured phase shift, magnitude CNR and phase CNR between anatomical structures of interest (mean ± standard deviation).
| Anatomy | Phase Shift (Hz) | Magnitude CNR | Phase CNR |
|---|---|---|---|
| Substantia nigra to crus cerebri | 14.32±1.84 | 5.42±1.78 | 11.87±1.80 * |
| Caudate to anterior internal capsule | 4.87±0.57 | 1.71±0.64 | 4.78±0.45 * |
| Thalamus to posterior internal capsule | 2.17±0.36 | 0.95±0.45 | 3.12±0.47 * |
| Gray to white matter (motor cortex) | 4.59±0.41 | 0.79±0.31 | 5.61±1.96 * |
| Gray to white matter (non-motor cortex) | 1.79±0.58 | 3.30±1.35 | 2.56±0.46 |
| Ventricles to white matter | 0.42±0.36 | 15.23±1.31 * | 0.68±0.52 |
| Veins to adjacent tissue | 20.50±8.34 | 1.61±1.18 | 8.8±3.30 * |
Significantly improved magnitude or phase CNR (P<0.01).
Deep Gray Matter
We observed large and phase shifts between the caudate and anterior limb of the internal capsule (4.870±.57 Hz) and between the substantia nigra and crus cerebri (14.321±.84 Hz). These large shifts created high CNR in the phase images (4.78±0.45 and 11.87±1.80, respectively) that was statistically significantly improved over CNR in the magnitude images. The thalamus, which was virtually indistinguishable from the posterior limb of the internal capsule in the magnitude images (CNR < 1), showed statistically significantly higher CNR of 3.120±.47 in the phase image.
Gray/White Matter
The 4.59±0.41 Hz phase shift that we observed between gray and white matter in the motor cortex agreed with the 4.7±0.9 Hz value previously reported by Duyn et al., 2007. In this region we measured a statistically significant sevenfold increase in CNR in the phase relative to the magnitude images. In regions outside the motor cortex the phase shift between gray and white matter was only 1.79±0.58 Hz and CNR was not significantly improved in the phase images. Our whole-brain phase shift for gray to what matter of 0.0075±0.0030ppm (2.23±0.92 Hz normalized to field strength) agreed well with the 0.0069ppm phase shift between gray and white matter (0.160 to 0.048 radians at a TE of 40ms and a field strength of 1.5T) reported by Haacke et al., 2007. Our phase images also highlighted the claustrum (e.g. arrowhead in Fig. 8, patient 1), a small gray matter island between the white matter of the external and extreme capsules and phase images at the level of the pons showed contrast in the peri-aqueductal gray matter and white matter tracts crossing amidst the pontine gray matter nuclei (e.g. Fig. 4f).
Figure 8.
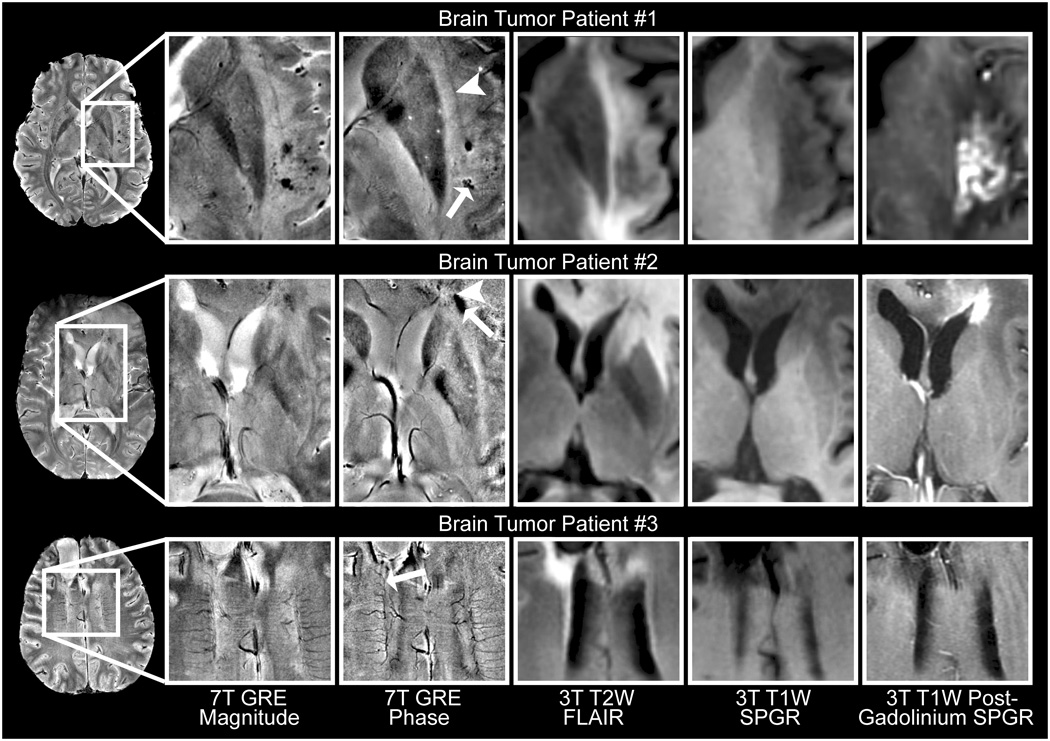
Sample phase images of brain tumors at 7T with corresponding 3T anatomical images. Phase images highlighted hemorrhage (arrow) adjacent to the claustrum (arrowhead) in a GBM patient treated with gamma knife surgery in the region enhancing on the 3T post-gadolinium image (patient 1), residual blood products in regions of compromised (arrowhead, gadolinium-enhancing) and repaired (arrow, non-enhancing) blood brain barrier in a GBM patient (patient 2), and abnormal vasculature (arrow) in a patient with a surgically resected anaplastic oligodendroglioma (patient 3).
Venous Vasculature
Veins showed narrower widths on our phase than magnitude images (e.g. medullary veins in Fig. 4b). Measurements of 120 vessels demonstrated significantly narrower vessel width (P < 0.001 with a Wilcoxon signed rank test) in phase than magnitude images and similar continuous vessel length (P>0.3 with a Wilcoxon signed rank test). To our knowledge this narrowing of vessels in phase relative to magnitude images has not previously been reported. As observed at lower fields (Haacke et al., 2004; Rauscher et al., 2004), veins showed high contrast on phase images. The calculated phase shift between veins and adjacent tissue was as high as 40 Hz, although the mean phase shift was only 22 Hz.
Phase Images at 3T
Phase images acquired at 3T showed similar contrast to images acquired at 7T. For example, the phase shift between the crus cerebri and the substantia nigra in Fig. 5 was 0.22 radians at 3T and 0.84 radians at 7T. Once normalized for field strength and TE by conversion to parts per million (ppm), the shift was 0.037ppm at 3T and 0.039ppm at 7T. Noise in the phase images increased dramatically from 7T to 3T. The CNR of the 3T phase images could be improved by changing the scan parameters, but that would require a compromise in the CNR of the magnitude images. The optimal TE for phase contrast at 3T is probably longer than the 7.3ms TE selected to match the magnitude contrast between gray and white matter at 7T. With the parameters used, phase contrast at 3T was sufficient to distinguish large structures such as the caudate from the internal capsule (CNR 2.7), but it was insufficient to distinguish gray from white matter (CNR 0.8).
Figure 5.
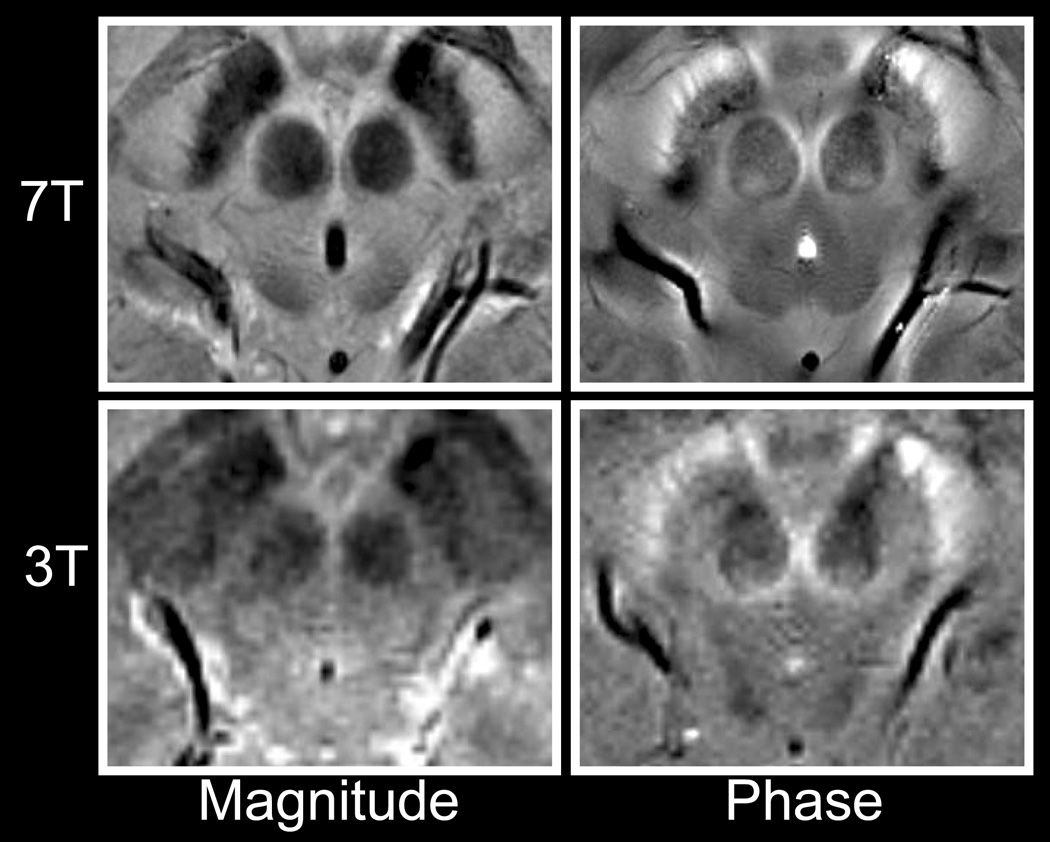
Comparison of magnitude (left) and phase (right) images at 7T (top) and 3T (bottom).
Phase Images of Patients with Multiple Sclerosis at 7T
The phase imaging technique was applied to scans of MS patients acquired at a higher in-plane spatial resolution (0.195×0.260mm) and longer TE (15ms) to evaluate performance of the technique at lower magnitude SNR and correspondingly higher phase noise. High quality phase images were observed in these patients and represent the first images of MS at 7T and the first phase images of MS that have been presented at any field strength.
MS plaques, which typically appeared hyperintense in the magnitude images, showed novel and heterogeneous hypointense contrast in the phase images. For example, one patient (Fig. 7, patient 1) showed twenty-two abnormal regions of magnitude hyperintensity, two regions of phase hypointensity, and eighteen regions with both magnitude hyperintensity and phase hypointensity. Seven of the ten MS patients showed phase hypointensities in the region of the periventricular deep medullary veins. Five plaques in this region showed phase hypointensity only around the periphery of the magnitude hyperintensity (e.g. Fig. 7, patients 1 and 3). Three of these patients presented focal phase hypointensities within the large diffuse magnitude hyperintensities (e.g. Fig. 7, patient 2).
Figure 7.
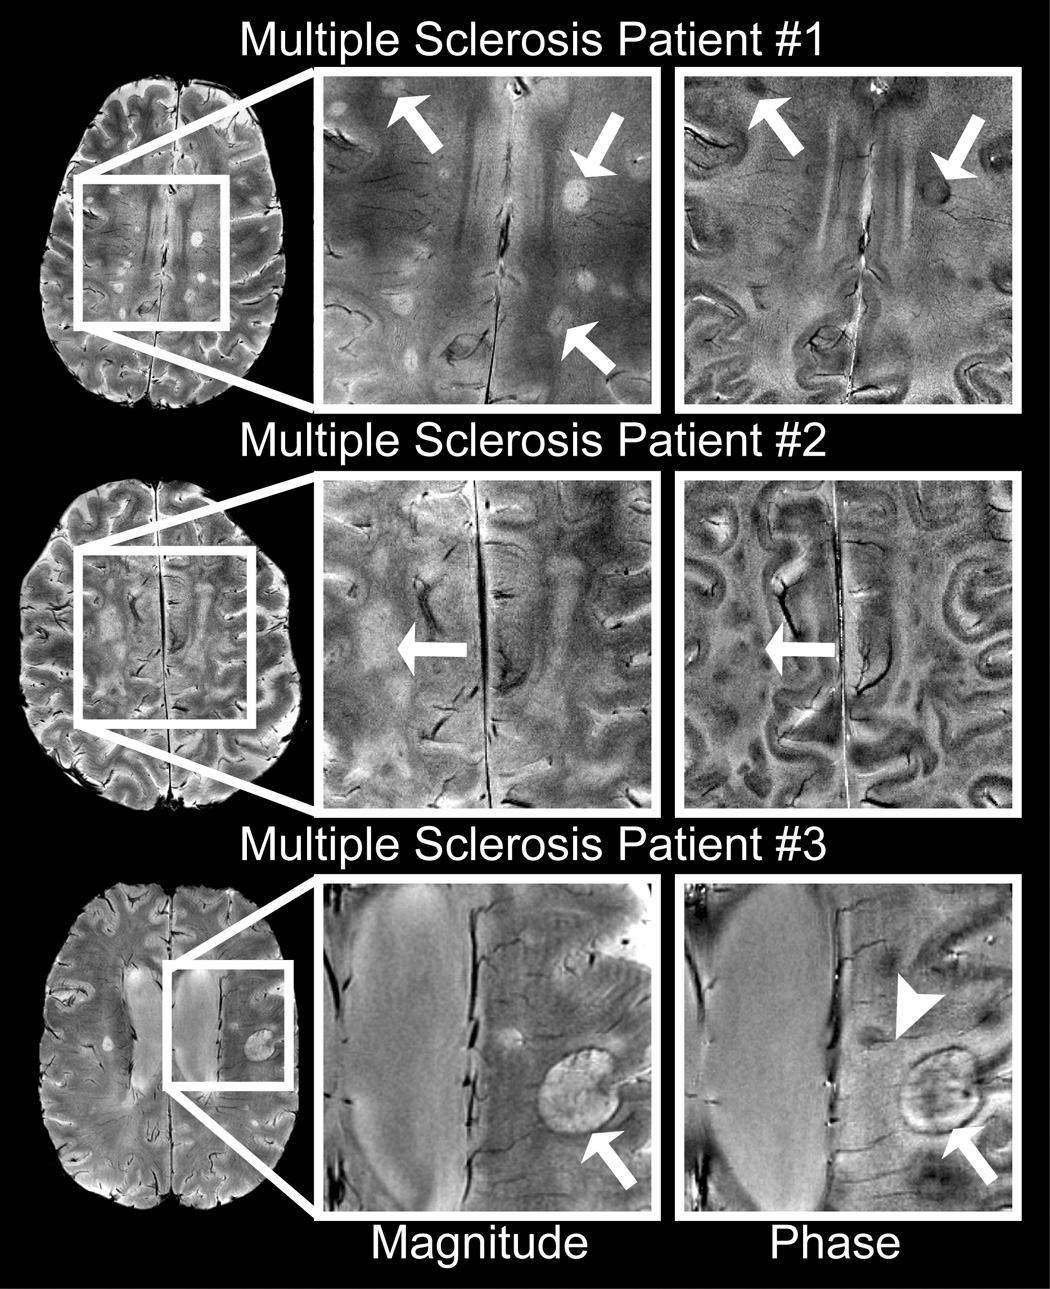
Sample phase images of MS plaques at 7T. Phase images showed heterogeneous contrast (arrows) in focal multiple sclerosis plaques (patient 1), large diffuse plaques (patient 2) and ringed plaques (patient 3). Phase images also highlighted veins (arrowhead) penetrating periventricular plaques.
Phase Images of Patients with Brain Tumors at 7T
Because of their surgical resections and extensive hemorrhages, brain tumor patients were expected to have highly inhomogeneous B0 fields that could cause large phase variation and spatially variable magnitude SNR. Twenty of the twenty-five patients had undergone surgical resection. This was expected to be a challenging test of the robustness of the phase imaging technique. We did not apply any specialized data acquisition techniques such as high order shimming that would improve the inhomogeneous B0 field. Even in this challenging patient population, the method created high quality phase images. To our knowledge these are the first phase images of brain tumor patients at 7T.
The phase images highlighted regions of hemorrhage and delineated abnormal vasculature, in a similar manner to phase images at lower fields (Rauscher et al., 2005). Fifteen of the twenty-five patients with brain tumors had small, focal regions of hypointensity in the magnitude images that appeared as narrower regions of hypointensity with surrounding with surrounding hyperintense halos in the phase images (e.g. arrowhead in Fig. 6 and arrow in Fig. 8, patient 1). This phase profile was consistent with the expected susceptibility effect of ferritin and transferrin (products of hemorrhage) or clotted hematoma (Sehgal et al., 2006). In a patient who had received gamma knife radiation treatment these hemorrhages were observed in the region of radiation treatment (Fig. 8, patient 1). Comparison of the 7T phase images to the 3T post-Gadolinium images was used to investigate the relationship between phase and the blood-brain barrier. Ten observations of focal phase contrast within the Gad-enhancing regions (e.g. Fig. 8, patient 1) and three observations of focal phase contrast outside the Gad-enhancing regions (e.g. Fig. 8, patient 2) were observed. Assuming that phase indicates residual blood products from previous hemorrhages, the observation of phase contrast outside the Gad-enhancing region may indicate repair of the blood brain barrier. Phase images of brain tumors also provided excellent delineation and narrow vessel width in adjacent and/or abnormal vasculature.
Figure 6.
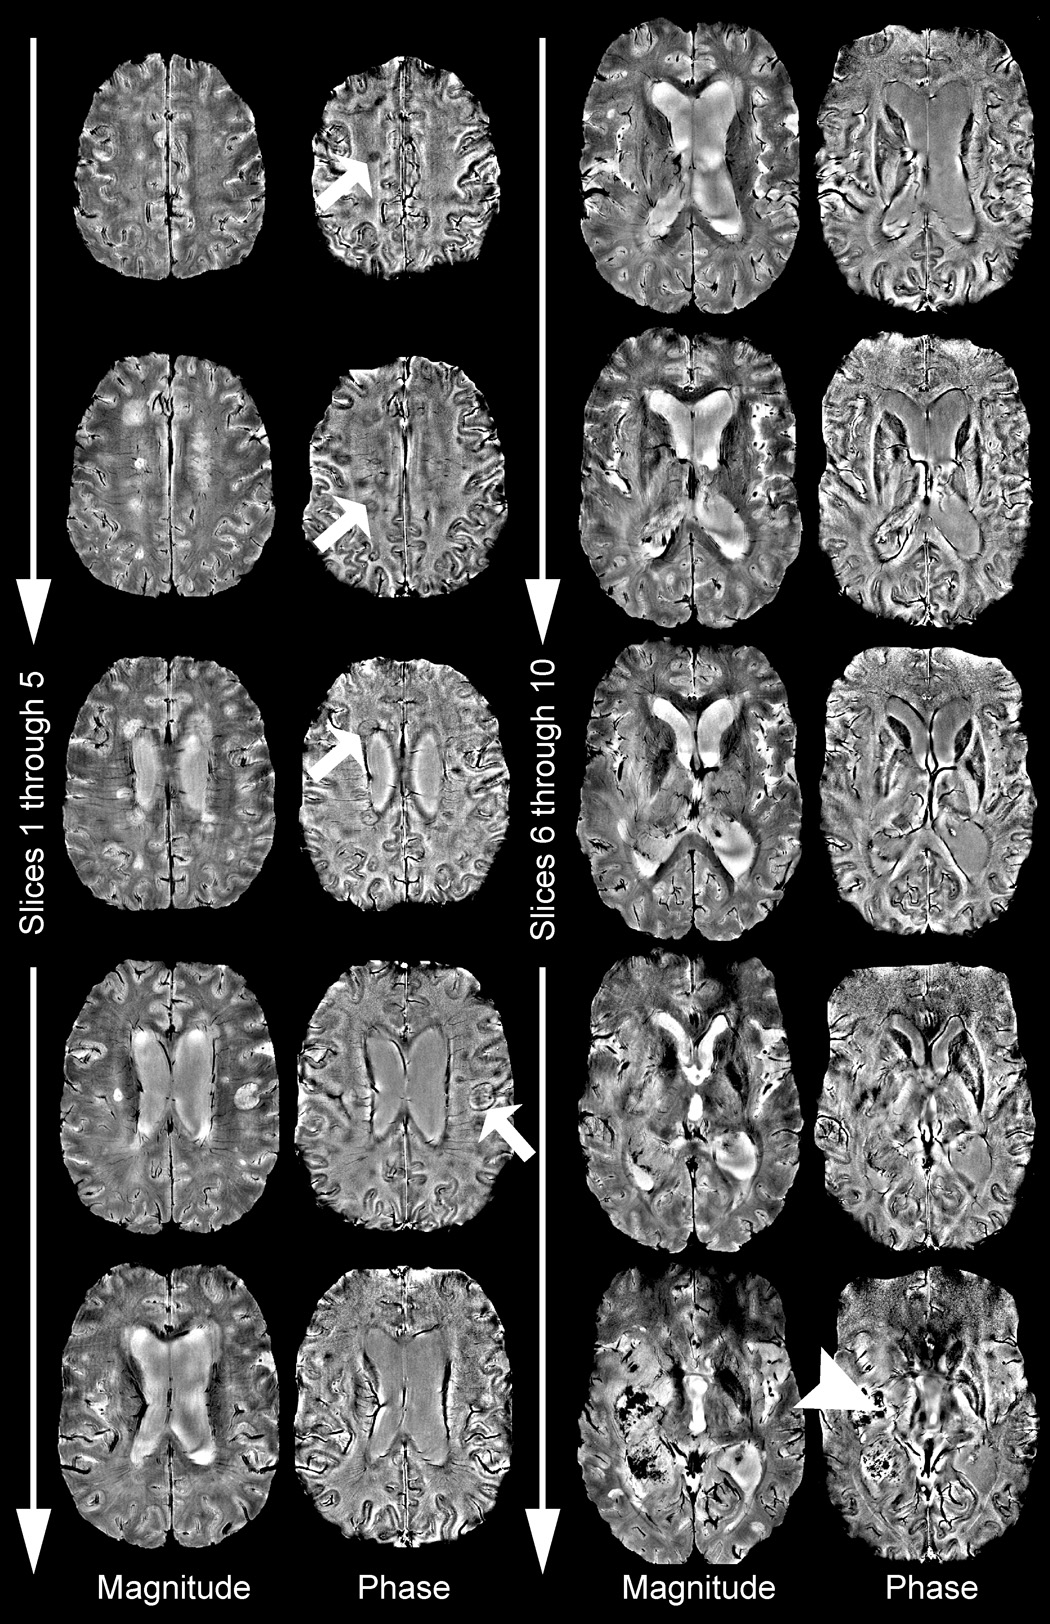
Complete phase image volume of a patient with MS lesions in the superior slices (arrows) and a large tumor showing extensive blood products in the inferior slices (arrowhead).
DISCUSSION
The phase image processing technique described here reliably produced high-quality phase images, even when applied to challenging image volumes such as those acquired without high order shimming from brain tumor patients with surgical resection cavities and extensive hemorrhages. The reproducibility of the phase contrast and robust performance of the phase processing algorithm across a variety of acquisitions including 1024×768/512×512/256×256 matrices, 15/11.4/7.3ms TE, 7T/3T field strengths and healthy and diseased subjects showed the technique was robust to changes in acquisition parameters.
The 7T phase images provided novel contrast to magnitude images of the same complex image volume. Phase imaging therefore gave non-redundant information without requiring an additional scan. The phase images highlighted deep gray matter, venous microvasculature, cortical gray/white matter, hemorrhage, brain tumor vascular abnormalities and MS plaques. The phase of a GRE image accumulates over the echo time as a result of variations in the local magnetic environment. This means that phase is sensitive to chemical shift and the microsusceptibility effects of local tissues. The phase shifts observed in this study support previous research which showed that paramagnetic compounds such as such as deoxygenated blood (Schenck, 1996), blood clots (Gomori et al., 1987; Sehgal et al., 2006) and iron laden tissues of the basal ganglia (Hallgren et al., 1958; Drayer et al., 1986; Morris et al., 1992; Loeffler et al., 1995) increase the internal magnetic field. Boundaries between structures with different magnetic susceptibilities shift the field in a predictable pattern (Schenck, 1996). If phase images were used to produce accurate susceptibility maps of the brain it would contribute enormously to the studies of iron deposition in aging and neurodegenerative disorders such as Alzheimer’s disease, Parkinson’s disease, Huntington’s disease and multiple sclerosis (Schenck et al., 2004; Haacke et al., 2005; Bartzokis et al., 2007).The ability to detect subtle changes in iron accumulation could be used to evaluate disease progression or treatment efficacy for emerging treatments such as iron chelation and antioxidants (Ke et al., 2003; Doraiswamy et al., 2004; Zecca et al., 2007).
The insensitivity of phase contrast and phase image reconstruction to acquisition parameters and experimental setup facilitates quantitative phase image analysis across MRI systems, coils and acquisition parameters. For example, our measurement of the phase shift between gray and white matter at 7T was within 3% of the value reported in Duyn et al., 2007 at 7T and within 8% of the value reported in Haacke et al., 2007 at 1.5T. Similarly, the phase shift we measured between the substantia nigra and the crus cerebri at 7T was within 6% of the value that we measured at 3T. Although these measured and reported values were scanned at different spatial resolutions at different field strengths with different timing parameters, they produced the same phase contrast. The effect of field strength and TE was removed by converting phase units to a ppm scale because susceptibility effects and chemical shift scale linearly with field strength (Schenck, 1999) and phase accumulates at a constant rate over TE. Phase image contrast is also expected to be robust to B1 inhomogeneities, receive coil sensitivity profiles, relaxation parameters of local tissues, proton density and other acquisition parameters because, while these parameters all impact SNR, they do not affect the local susceptibility effects. Robustness to B1 inhomogeneities is particularly important at 7T, because the B1 field strength varies by as much as 40% over the brain at 7T (Vaughan et al., 2001). While these scan parameters are not expected to affect contrast in phase images, they will affect the noise because noise scales inversely with magnitude SNR (Haacke et al., 1999). The primary benefit in using a 7T scanner and phased array coil described in this study was to minimize noise.
Phase Images of Normal Volunteers
The method presented here created high phase contrast high resolution images of the basal ganglia that enabled accurate delineation of anatomical substructures and quantification of the frequency shift in these structures. The caudate and substantia nigra both have high iron content (Hallgren et al., 1958; Drayer et al., 1986; Morris et al., 1992; Loeffler et al., 1995) and showed high phase contrast in these images, supporting the contention that higher contrast in the phase is due to increased iron (Ogg et al., 1999). It has also been suggested that the field inhomogeneity results from increased microvascularity (Christoforidis et al., 2004). While numerous studies have shown high contrast in the deep gray matter (as reported by Ogg et al., 1999; Haacke et al., 2005; Rauscher et al., 2005; Haacke et al., 2007;Duyn et al., 2007), the robustness of the technique presented in this study and reproducibility of the resulting phase contrast may provide improved tools for characterizing the deep gray matter.
Phase contrast between gray and white matter becomes especially important at 7T because magnitude images do not benefit from high field strength due to increasing T1 (Bourekas et al., 1999). The phase contrast could be used to weight and increase contrast in the magnitude image (Ogg et al., 1999; Haacke et al., 2004) or to improve segmentation of gray and white matter obtain more reliable tissue discrimination than with the magnitude image alone. Although our measured seven-fold gain in CNR in phase images of the motor cortex relative to magnitude images was within range of the nine-fold gain predicted by Duyn et al., 2007, our measured phase CNR of 5.61±1.96 was much lower than the CNR of 20 predicted in that publication and for a smaller slice thickness of 1mm. Our phase CNR may be below theoretically optimal values because we chose conservative scan parameters and avoided difficult techniques such as high order shimming to simplify the methodology and ensure robust performance in challenging patient populations. Because our B0 field was more inhomogeneous the impacts of spatial distortions limited our TE to 15ms. It should also be noted that, unlike in this study, the CNR in Duyn et al, 2007 was not measured directly but rather was a theoretical prediction.
The 4.59±0.41 Hz phase shift we measured between gray and white matter in the motor cortex and the 2.23±0.92 Hz shift we measured in the whole brain agreed with previously reported values (Duyn et al., 2007; Haacke et al., 2007). The source of the phase shift, however, is poorly understood. While iron’s spatial distribution is likely to contribute to phase contrast (Abduljalil et al., 2003; Haacke et al., 2005), previous studies have shown only weak correlations between iron and phase in cortical matter (Ogg et al., 1999). Quantitative measurements have shown no significant difference in iron content between frontal gray and white matter (Morris et al., 1992), but phase images do show contrast in this region. Other possible sources of phase contrast include the density and/or orientation of veins (Cavaglia et al., 2001; Li et al., 2006), iron’s orientation relative to the main magnetic field and chemical shift, though chemical shift differences due to myelin content would be expected to shift phase in the opposite direction to the observed phase shift (Duyn et al., 2007).
Our study showed that the phase images of the venous vasculature had significantly improved CNR over magnitude images (Table 1) and significantly narrower apparent vessel widths. This high venous contrast is achieved without administration of contrast agents because the paramagnetic susceptibility of deoxygenated hemoglobin provides intrinsic phase contrast in veins. Arterial vessels were not as accentuated as veins, presumably because arterial blood is close to 100% saturated with oxygen and is therefore better susceptibility-matched to the surrounding tissues (Schenck, 1996). The venous phase images could be used either on their own or to weight the magnitude images and increase contrast in the vasculature as demonstrated by Haacke et al., 2004.
The phase profile of the venous vasculature mirrored the B0 field shift predicted for a cylinder of deoxygenated blood (Fig. 5 in Schenck, 1996). The venous vasculature had significantly narrower apparent widths on phase than magnitude images because the susceptibility of deoxygenated blood shifts the field in opposite directions within and adjacent to the vessel. As a result, phase image intensities were bright adjacent to the vessel and dark inside it. In magnitude images the vessels appeared wider than their actual width due to signal dropout within and adjacent to the vessel. Vessel widths are therefore expected to be more accurate on phase than magnitude images. The field profile also suggested that the frequent observation of double-vessels in the magnitude images that were not seen in the phase images were due to intravoxel dephasing at the periphery of the vessels (e.g. Fig. 4e/Fig. 5a). This vessel narrowing has not previously been reported because it is only seen when the voxel size is smaller than the vessel width. The high SNR gained by acquiring data at 7T enabled using small enough voxel sizes that the vessel narrowing became apparent. Potential challenges for venous phase imaging include the effects of vessel orientation relative to the main magnetic field and flow.
Phase Images of Patients with Multiple Sclerosis
The ability to delineate the number and integrity of narrow vessels has many important clinical applications. It has been suggested that abnormalities of the periventricular deep medullary veins could be important in diagnosing MS onset and progression (Kesselring, 1997). The observations of small phase-shifted plaques in the region of the deep medullary veins in seven MS patients and of plaques with penetrating vessels (e.g. arrowhead in Fig. 7, patient 3) supported the contention that the disease progresses along the vasculature.
The finding that a subset of multiple sclerosis plaques showed contrast in the phase images demonstrated that additional information was obtained by imaging the phase of the complex data set. While in magnitude images the increase in T2 in plaques could easily mask the intravoxel dephasing resulting from increased iron content, phase images definitively showed the presence of susceptibility-shifted compounds. Five plaques showed phase contrast only at the peripheral margin of the plaque (e.g. Fig. 7, patients 1 and 3), a region identified as the zone of active inflammation with an influx of iron-rich macrophages in post-gadolinium images of acute plaques and as containing globular structures of non-heme iron in histological studies of older plaques (Connor et al., 2001; Haacke et al., 2005). Comparing the phase shift with gadolinium enhancement could potentially be used to differentiate past (chronic) from present (acute) inflammation and the quantity of deposited blood products in chronic plaques could indicate the level of past activity.
Phase Images of Patients with Brain Tumors
The high contrast and narrow vessel widths of phase images enabled accurate delineation of vasculature in patients with brain tumors (e.g. arrow in Fig. 8, patient 3). Increased and abnormal vasculature in brain tumor patients is associated with a higher degree of malignancy (Christoforidis et al., 2004; Folkman, 2006) and phase imaging may therefore contribute to defining prognosis and monitoring response to anti-angiogenic therapies.
Phase images were also shown to highlight hemorrhages, which have been associated with high-grade tumors (Bagley et al., 1997) and have been previously observed in phase images at 1.5T (Rauscher et al., 2005). Hemorrhages consistently appeared smaller on the phase than magnitude images (e.g. arrowhead in Fig. 6 and arrow in Fig. 8, patient 1). As described above for veins, the hemorrhage appeared larger than its actual size on magnitude images because there was signal dropout both adjacent to and within the hemorrhage. On phase images the contrast changed abruptly at the hemorrhage border because of the susceptibility effects from the paramagnetic blood or blood products. Phase images are therefore expected give a more accurate depiction of hemorrhage size and location. It has been reported that the high paramagnetic susceptibility of clotted hematoma initially drops as the red blood cells are destroyed (Gomori et al., 1987) and later returns when ferritin and hemosiderin are formed (Sehgal et al., 2006). Establishing the source and time course of these variations in phase is an ongoing focus of our investigations.
While most patients showed gadolinium enhancement in regions of high abnormal phase contrast, a subset of patients did not have corresponding gadolinium enhancement (e.g. Fig. 8, patient 2). The absence of gadolinium enhancement suggests an intact blood brain barrier, while the high phase contrast suggests blood product deposition from past hemorrhage. These non-gadolinium-enhancing susceptibility-shifted regions may therefore indicate repair of the local blood brain barrier.
CONCLUSION
This study demonstrated that multichannel phase sensitive imaging, combined with a novel reconstruction technique and a robust phase unwrapping algorithm, provided reproducible and high contrast in high-resolution brain images at 7T. The phase images were created from the same dataset acquired for optimal parenchymal contrast in the magnitude images and without high-order shimming. The phase images highlighted the deep gray matter and cortical gray/white matter, improved visualization of the microvasculature, and highlighted clinical pathology such as hemorrhages, brain tumor vascular abnormalities and MS plaques. Phase imaging is expected to be valuable for defining anatomic structures in the brain and may contribute to defining prognosis, disease progression and response to therapy for neurological diseases.
ACKNOWLEDGEMENTS
This research was supported by UC Discovery Grants LSIT01-10107 and ITL-BIO04-10148 in conjunction with GE Healthcare, NIH grants R01 CA059880 and P50 CA97257, and NDSEG and NSF GRFP fellowships.
Footnotes
Publisher's Disclaimer: This is a PDF file of an unedited manuscript that has been accepted for publication. As a service to our customers we are providing this early version of the manuscript. The manuscript will undergo copyediting, typesetting, and review of the resulting proof before it is published in its final citable form. Please note that during the production process errors may be discovered which could affect the content, and all legal disclaimers that apply to the journal pertain.
REFERENCES
- Abduljalil AM, Schmalbrock P, Novak V, Chakeres DW. Enhanced gray and white matter contrast of phase susceptibility-weighted images in ultra-high-field magnetic resonance imaging. J. Mag. Reson. Imaging. 2003;18:284–290. doi: 10.1002/jmri.10362. [DOI] [PubMed] [Google Scholar]
- Bagley LJ, Grossman RI, Judy KD, Curtis M, Loevner LA, Polansky M, Detre J. Gliomas: correlation of magnetic susceptibility artifact with histologic grade. Radiology. 1997;202:511–516. doi: 10.1148/radiology.202.2.9015082. [DOI] [PubMed] [Google Scholar]
- Bartzokis G, Lu PH, Tishler TA, Fong SM, Oluwadara B, Finn JP, Huang D, Bordelon Y, Mintz J, Perlman S. Myelin breakdown and iron changes in Huntington’ s Disease: pathogenesis and treatment implications. Neurochem. Res. 2007;32:1655–1664. doi: 10.1007/s11064-007-9352-7. [DOI] [PubMed] [Google Scholar]
- Bourekas EC, Christoforidis GA, Abduljalil AM, Kangarlu A, Chakeres DW, Spigos DG, Robitaille PM. High resolution MRI of the deep gray nuclei at 8 Tesla. J. Comput. Assist. Tomogr. 1999;23:867–874. doi: 10.1097/00004728-199911000-00009. [DOI] [PubMed] [Google Scholar]
- Cavaglia M, Dombrowski SM, Drazba SM, Vasanji A, Bokesch PM, Janigro D. Regional variation in brain capillary density and vascular response to ischemia. Brain Res. 2001;910:81–93. doi: 10.1016/s0006-8993(01)02637-3. [DOI] [PubMed] [Google Scholar]
- Christoforidis GA, Kangarlu A, Abduljalil AM, Schmalbrock P, Chaudhry A, Yates A, Chakeres DW. Susceptibility-based imaging of glioblastoma microvascularity at 8T: correlation of MR imaging and postmortem pathology. Am. J. Neuroradiol. 2004;25:756–760. [PMC free article] [PubMed] [Google Scholar]
- Connor JR, Menzies SL, Burdo JR, Boyer PJ. Iron and iron management proteins in neurobiology. Pediatr. Neurology. 2001;25:118–129. doi: 10.1016/s0887-8994(01)00303-4. [DOI] [PubMed] [Google Scholar]
- Deistung A, Mentzel HJ, Rauscher A, Witoszynskyj S, Kaiser WA, Reichenbach JR. Demonstration of paramagnetic and diamagnetic cerebral lesions by using susceptibility weighted phase imaging (SWI) Z. Med. Phys. 2006;16:261–267. doi: 10.1078/0939-3889-00324. [DOI] [PubMed] [Google Scholar]
- Doraiswamy PM, Finefrock AE. Metals in our minds: therapeutic implications for neurodegenerative disorders. Lancet Neurol. 2004;3:431–434. doi: 10.1016/S1474-4422(04)00809-9. [DOI] [PubMed] [Google Scholar]
- Drayer B, Burger P, Darwin R, Riderer S, Herfkens R, Johnson GA. Magnetic resonance imaging of brain iron. Am. J. Roentgenol. 1986;147:103–110. doi: 10.2214/ajr.147.1.103. [DOI] [PubMed] [Google Scholar]
- Duyn JH, van Gelderen P, Li T-Q, de Zwart JA, Koretsky AP, Fukunaga M. High-field MRI of brain cortical substructure based on signal phase. Proc. Natl. Acad. Sci. U.S.A. 2007;104:11796–11801. doi: 10.1073/pnas.0610821104. [DOI] [PMC free article] [PubMed] [Google Scholar]
- Folkman J. Tumor suppression by p53 is mediated in part by the antiangiogenic activity of endostatin and tumstatin. Sci. S.T.K.E. 2006;354:pe35. doi: 10.1126/stke.3542006pe35. [DOI] [PubMed] [Google Scholar]
- Gomori JM, Grossman RI, Yu-Ip C, Asakura T. NMR relaxation times of blood: dependence on field strength, oxidation state, and cell integrity. J. Comput. Assist. Tomogr. 1987;11:684–690. [PubMed] [Google Scholar]
- Haacke EM, Ayaz M, Khan A, Manova ES, Krishnamurthy B, Gollapalli L, Ciulla C, Kim I, Peterson F, Kirsch W. Establishing a baseline phase behaviour in magnetic resonance imaging to determine normal vs. abnormal iron content in the brain. J. Magn. Reson. Imaging. 2007;26:256–264. doi: 10.1002/jmri.22987. [DOI] [PubMed] [Google Scholar]
- Haacke EM, Brown RW, Thompson MR, Venkatesan R. Magnetic resonance imaging: physical principles and sequence design. 1st ed. New York: Wiley-Liss; 1999. p. 375. [Google Scholar]
- Haacke EM, Cheng NY, House MJ, Liu W, Neelavalli J, Ogg RJ, Khan A, Ayaz M, Kirsch W, Obenaus A. Imaging iron stores in the brain using magnetic resonance imaging. Magn. Reson. Imaging. 2005;23:1–25. doi: 10.1016/j.mri.2004.10.001. [DOI] [PubMed] [Google Scholar]
- Haacke WM, Xu Y, Cheng YN, Reichenbach JR. Susceptibility-weighted imaging. Magn. Reson. Med. 2004;52:612–618. doi: 10.1002/mrm.20198. [DOI] [PubMed] [Google Scholar]
- Hallgren B, Sourander P. The effect of age on non-haemin iron in the human brain. J. Neurochem. 1958;3:1–51. doi: 10.1111/j.1471-4159.1958.tb12607.x. [DOI] [PubMed] [Google Scholar]
- Hayes CE, Hattes N, Roemer PB. Volume imaging with MR phased arrays. Magn. Reson. Med. 1991;18:309–319. doi: 10.1002/mrm.1910180206. [DOI] [PubMed] [Google Scholar]
- Hetherington HP, Wen-Jang C, Gonen O, Pan JW. Robust fully automated shimming of the human brain for high-field 1H spectroscopic imaging. Magn. Reson. Med. 2006;56:26–33. doi: 10.1002/mrm.20941. [DOI] [PubMed] [Google Scholar]
- Jenkinson M. Fast, automated, N-dimensional phase-unwrapping algorithm. Magn. Reson. Med. 2003;49:193–197. doi: 10.1002/mrm.10354. [DOI] [PubMed] [Google Scholar]
- Ke Y, Ming QZ. Iron misregulation in the brain: a primary cause of neurodegenerative disorders. Lancet Neurol. 2003;2:246–253. doi: 10.1016/s1474-4422(03)00353-3. [DOI] [PubMed] [Google Scholar]
- Kesselring J. Prognosis in multiple sclerosis. Schweizerische medizinische Wochenschrift. 1997;127:500–505. [PubMed] [Google Scholar]
- Li TQ, Gelderen P, Merkle H, Talagala L, Koretsky AP, Duyn J. Extensive heterogeneity in white matter intensity in high-resolution T2*-weighted MRI of the human brain at 7.0T. NeuroImage. 2006;32:1032–1040. doi: 10.1016/j.neuroimage.2006.05.053. [DOI] [PubMed] [Google Scholar]
- Loeffler DA, Connor JR, Juneau PL, Snyder BS, Kanaley L, DeMaggio AJ, Nguyen H, Brickman CM, LeWitt PA. Transferrin and iron in normal, Alzheimer’s disease and Parkinson’s disease brain regions. J. Neurochem. 1995;65:710–716. doi: 10.1046/j.1471-4159.1995.65020710.x. [DOI] [PubMed] [Google Scholar]
- Morris CM, Candy JM, Oakley AF, Bloxham CA, Edwardson JA. Histochemical distribution of non-haem iron in the human brain. Acta. Anat. 1992;144:235–257. doi: 10.1159/000147312. [DOI] [PubMed] [Google Scholar]
- Ogg RJ, Langston JW, Haacke EM, Steen RG, Taylor JS. The correlation between phase shifts in gradient echo MR images and regional brain iron concentration. Magn. Reson. Imaging. 1999;17:1141–1148. doi: 10.1016/s0730-725x(99)00017-x. [DOI] [PubMed] [Google Scholar]
- Rauscher A, Sedlacik J, Barth M, Mentzel HJ, Reichenbach JR. Magnetic susceptibility-weighted MR phase imaging of the human brain. Am. J. Neuroradiol. 2005;26:736–742. [PMC free article] [PubMed] [Google Scholar]
- Schenck JF. The role of magnetic susceptibility in magnetic resonance imaging: MRI magnetic compatibility of the first and second kinds. Med. Phys. 1996;23:815–850. doi: 10.1118/1.597854. [DOI] [PubMed] [Google Scholar]
- Schenck JF, Zimmerman EA. Review: High-field magnetic resonance imaging of brain iron: birth of a biomarker. N.M.R. Biomed. 2004;17:433–445. doi: 10.1002/nbm.922. [DOI] [PubMed] [Google Scholar]
- Schneider E, Glover G. Rapid in-vivo shimming. Magn. Reson. Med. 1991;18:335–347. doi: 10.1002/mrm.1910180208. [DOI] [PubMed] [Google Scholar]
- Sehgal V, Delproposto Z, Haddar D, Haacke EM, Sloan AE, Zamorano LJ, Barger G, Hu J, Yingbiao X, Prabhakaran KP, Elangovan IR, Neelavalli J, Reichenbach JR. Susceptibility-weighted imaging to visualize blood products and improve tumor contrast in the study of brain masses. J. Magn. Reson. Imaging. 2006;24:41–51. doi: 10.1002/jmri.20598. [DOI] [PubMed] [Google Scholar]
- Vaughan JT, Garwood M, Collins CM, Liu W, DelaBarre L, Adriany G, Andersen P, Merkle H, Goebel R, Smith MB, Ugurbil K. 7T vs. 4T: RF power, homogeneity, and signal-to-noise comparison in head images. Magn. Reson. Med. 2001;46:24–30. doi: 10.1002/mrm.1156. [DOI] [PubMed] [Google Scholar]
- Wald LL, Carvajal L, Moyher SE, Nelson SJ, Grant PE, Barkovich AJ, Vigneron DB. Phased array detectors and an automated intensity-correction algorithm for high-resolution MR imaging of the human brain. Magn. Reson. Med. 1995;34:433–439. doi: 10.1002/mrm.1910340321. [DOI] [PubMed] [Google Scholar]
- Webb P, Macovski A. Rapid, fully automatic, arbitrary-volume in vivo shimming. Magn. Reson. Med. 1991;20:113–122. doi: 10.1002/mrm.1910200112. [DOI] [PubMed] [Google Scholar]
- Wen H, Jaffer FA. An in vivo automated shimming method taking into account shim current constraints. Magn. Reson. Med. 1995;34:898–904. doi: 10.1002/mrm.1910340616. [DOI] [PMC free article] [PubMed] [Google Scholar]
- Wilson JL, Jenkinson M, Araujo I, Kringelbach ML, Rolls ET, Jezzard P. Fast, fully automated global and local magnetic field optimization for fMRI of the human brain. NeuroImage. 2002;17:967–976. [PubMed] [Google Scholar]
- Xu D, Kelley DAC, Hess CP, Lupo JM, Mukherjee P, Nelson SJ, Vigneron DB. Proc. A.S.N.R. San Diego: 2006. Potential benefits of 7T in neuro-imaging. [Google Scholar]
- Yamada N, Imakita S, Sakuma T, Takamzya M. Intracranial calcification on gradient-echo phase images: depiction of diamagnetic susceptibility. Radiology. 1996;198:171–178. doi: 10.1148/radiology.198.1.8539373. [DOI] [PubMed] [Google Scholar]
- Zecca L, Youdim MB, Riederer P, Connor JR, Crichton RR. Iron, brain aging and neurodegenerative disorders. Nat. Rev. Neurosci. 2004;5:863–873. doi: 10.1038/nrn1537. [DOI] [PubMed] [Google Scholar]