Abstract
A dark band or rim along parts of the subendocardial border of the left ventricle (LV) and the myocardium has been noticed in some dynamic contrast-enhanced MR perfusion studies. The artifact is thought to be due to susceptibility effects from the gadolinium bolus, motion, or resolution, or a combination of these. Here motionless ex vivo hearts in which the cavity was filled with gadolinium are used to show that dark rim artifacts can be consistent with resolution effects alone.
Keywords: dark rim, artifact, filtering, myocardial perfusion imaging, dynamic contrast MRI
In dynamic contrast-enhanced MRI studies, numerous researchers have noticed an endocardial “dark rim” that appears when the gadolinium contrast bolus appears in the left ventricle (LV). This artifact typically precedes tissue uptake and is transient in nature. During a visual analysis of the images, it often is not difficult to read through this artifact because, unlike true perfusion deficits, it does not remain after the bolus. In a semiquantitative or quantitative analysis, however, the artifact can cause significant differences in estimated flow parameters by either changing the upslope or baseline for signal difference calculations, or changing the fit parameters of a compartment model or a non-model-based approach. This is especially true when subendocardial regions are analyzed separately, which has been suggested as a more sensitive measure of disease (2,3). An example of the effect of the artifact on the upslope parameters is shown in Fig. 1.
FIG. 1.
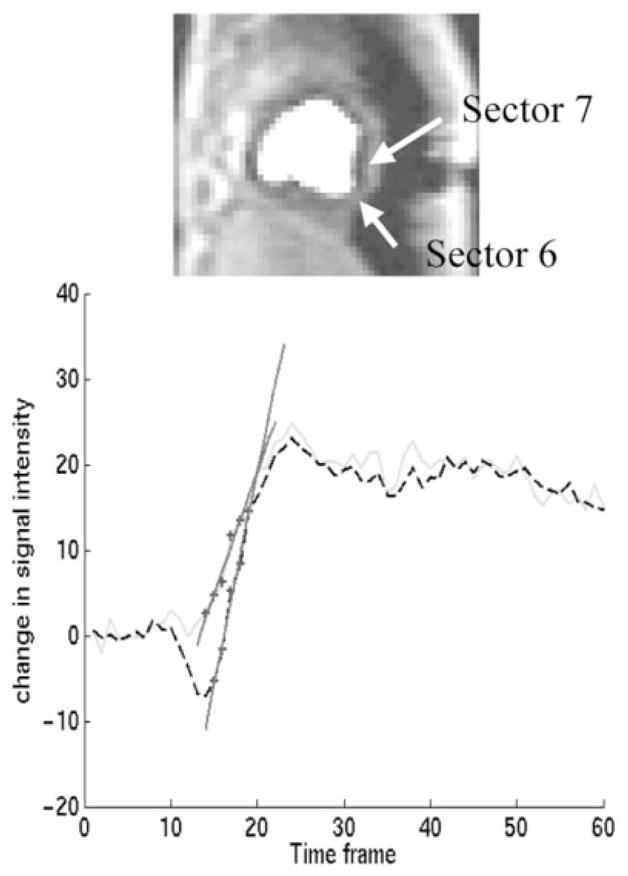
Example of the effect of the dark rim artifact on upslope analysis. Top: A time frame shortly after gadolinium infusion in a dynamic canine study, corresponding to time frame 16 in the bottom plot. A saturation recovery turboFLASH sequence was used. Acquisition pixel size was 2.3 × 4.7 mm with the larger pixel size in the phase-encoding (horizontal) direction. Bottom: The subendocardium was divided into eight equiangular regions. The signal difference time curves for the subendocardial regions in sectors 6 (solid line) and 7 (dashed) are shown. The dip at the beginning of the time curve from sector 7 is an example of a severe case of the dark rim artifact. The artifact was not apparent in sector 6. Other sectors were also affected. The maximum upslopes found for each curve, using a five-point fit (1), are plotted as well. The (normalized) up-slope values are 0.034 and 0.059. This is a 58% difference, due to the dark rim artifact. No ischemia was present in this slice.
The dark rim is often thought to be a susceptibility effect (4) because it arises in tandem with the arrival of the bolus of gadolinium, which can in concentration cause changes in the local magnetic field. It is also suspected to be due to resolution and motion effects (4,5).
We hypothesize that the dark rim artifact may be due largely to limited spatial resolution (Gibbs ringing) and to motion of the cardiac cycle. This is in contrast to Ref. 5, which implied that motion is the main cause, and showed that similar artifacts can be created using a simulation of a 1D edge moving with constant velocity. The interaction with cardiac motion can be complex, so in the current study we performed experiments in which motion was not present.
Note that this dark rim artifact is different from the flow-related dark artifacts that can be found when cine steady-state free precession (SSFP) sequences are used (6,7). Primarily fast low-angle shot (FLASH) type sequences are considered in this work, though similar types of results are expected with SSFP.
MATERIALS AND METHODS
Acquisition and Reconstruction
Three isolated ex vivo canine hearts were obtained from unrelated non-imaging studies. In each heart the LV cavity was filled with saline and gadolinium (Omniscan). With a 0.1 mmol/kg dose, the maximum concentration expected in the arterial input function is 5–10 millimolar (mM). The maximum concentration used in one heart was approximately 5 mM, and a somewhat lower concentration was used in the other two hearts. The tissue had no gadolinium contrast in it and was not fixed with formalin. In one heart the right ventricle (RV) cavity was also filled with gadolinium.
The point of using ex vivo preparations was to have a reproducible model of when the peak of the bolus enters the LV. The preparation also has the benefit of excluding any motion effects or effects due to temporal variations in gadolinium concentration.
The hearts were imaged on a Siemens 3T Trio using an eight-channel receive-only head coil. Several dynamic acquisitions with a saturation recovery turboFLASH sequence used for in vivo dynamic studies (linear phase ordering, TI = 100 ms to center of k-space, flip angle = 10°, TR ~ 2–4 ms, TE ~ 1 ms, multicoil parallel imaging generalized autocalibrating partially parallel acquisitions (GRAPPA) with R ~ 1.6, 24 reference lines, 8-mm-thick slices) using different spatial resolutions were performed. Additional images of one of the hearts were obtained on the same day with a Siemens Avanto 1.5T using a four-element head coil. A dynamic turboFLASH (TI = 100, TE = 1.2, TR ~ 2.6 ms, flip angle = 12°, no GRAPPA, 8-mm-thick slices) sequence was used.
Magnitude reconstructions from the Siemens scanners were used in the analyses because we have found that these reconstructions correspond to the square root of sum-of-squares reconstructions of raw k-space data. Additionally, in our experience GRAPPA artifacts do not resemble the dark rim artifacts.
Dark Rim Amplitude
The percentage of the dark rim artifact (i.e., the dip adjacent to the LV cavity) was estimated from line profiles through the image in both the phase-encode and read directions. Each line profile was plotted and the intensity change between the bottom of the dip and the estimated average myocardial intensity outside the dip was determined by visual inspection. This intensity change was divided by the peak minus the average myocardial signal intensity to give a percent decrease that can be compared to predictions from the theory of Gibbs ringing. In most cases the percent decrease reported is from the average of two line profiles from adjacent rows or columns.
Compensations
Gibbs ringing has been extensively studied in a wide variety of fields. It is known that it arises from the truncation of the higher spatial frequencies of the true object. A filter that gives a less abrupt truncation, by smoothing the transition from measured frequencies to (unmeasured) spatial frequencies with a value of zero, will reduce Gibbs ringing. This does have a cost in spatial resolution, depending on the filter. A Hanning filter has been shown to remove Gibbs ringing, at the cost of a 50% reduction in spatial resolution (8).
A low-pass exponential filter H(k) = e−α(|k|/N)p used for the reduction of Gibbs ringing artifacts is described in Ref. 9. This filter, with α = 32 and p = 20, was applied in 1D along the phase-encoding direction on a magnitude image to determine whether it reduced the dark rim artifact.
RESULTS
Figure 2 shows the effect of increasing resolution in one slice of one of the ex vivo hearts. At low resolution, the dark rim artifact is clearly evident from the location where the edge of the blood pool and myocardial interface is perpendicular to the phase-encoding direction. As spatial resolution increases, the artifact is reduced. A line profile through the ventricle is shown in Fig. 3 to better appreciate the magnitude of the ringing. The amplitude and width of the dip are seen to decrease as resolution is improved.
FIG. 2.

TurboFLASH acquisition of a contrast-filled stationary dog heart on the 3T scanner. The readout (vertical) and phase-encoding (horizontal) acquisition pixel dimensions are (a) 1.56 × 4.69 mm, (b) 1.04 × 3.15 mm, and (c) 1.04 × 1.50 mm. The readout bandwidth = 870 Hz/pixel in all three acquisitions, and TE = 1.07, 1.23, and 1.23 ms for a–c, respectively. Note that the dark rim artifact from strong edges perpendicular to the phase-encode direction is seen in a, decreases in b, and decreases further in c.
FIG. 3.
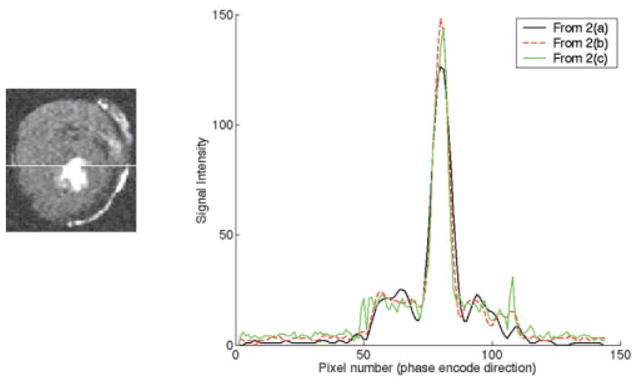
Line profiles horizontally through Fig. 2 images at the location shown in the image at the left, which is the same as Fig. 2c. The black line profile is from the lowest-resolution acquisition (Fig. 2a), the dip amplitude is approximately 8.5%, and the width is 5 pixels. The dashed line profile is from the middle acquisition (Fig. 2b), the dip amplitude is approximately 4.6%, and the width is 3 pixels. The green line profile is from the highest-resolution acquisition (Fig. 2c), the dip amplitude is ~3%, and the width is 1.5 pixels.
Figure 4 illustrates the result of swapping the read and phase directions, which rotates the artifact to remain perpendicular to the lower-resolution acquisition direction. The shape changes of the cavity in Fig. 4 are consistent with smoothing in the phase-encode direction. This was determined by taking the 2D fast Fourier transform (FFT) of the high-resolution image corresponding to the slice in Fig. 4, truncating its frequency extent in the phase-encode direction, and then performing an inverse 2D FFT and examining the cavity shape.
FIG 4.
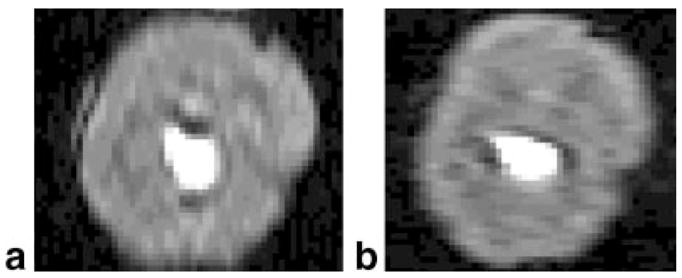
Another slice from the same ex vivo heart shown in Fig. 2, with the following resolutions: (a) 4.69 × 1.56 mm (phase-encode direction vertical), dip amplitude = 10%, width = 3.5 pixels; and (b) 1.56 × 4.69 mm (phase-encode direction horizontal), dip amplitude = 7%, width = 3 pixels.
An additional example with the read and phase directions swapped is given in Fig. 5 with both the RV and LV filled with contrast. The dark rim artifact appears in both the horizontal and vertical profiles of both images. In each case the dip intensity is slightly larger in the phase-encode direction, likely due to edges being perpendicular to the phase-encode direction. The phase-encoding resolution is slightly worse in Fig. 5a (4.3 mm vs. 3.23 mm), as is the artifact dip intensity (~11% vs. ~9%). The septal wall shows dark rim artifact on both the LV and RV sides.
FIG. 5.
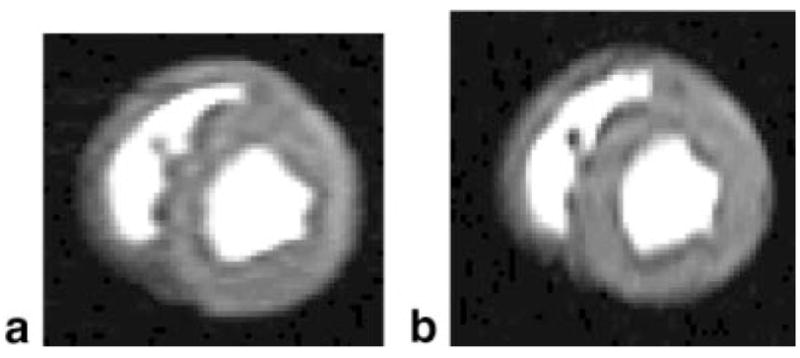
This image shows the result when both the RV and LV were filled with gadolinium. a: The phase-encode direction is horizontal, with 4.3 × 1.56 mm pixels (zero-padded to 1.56 × 1.56 mm pixels in the display). The dip amplitude is ~11% in the horizontal direction and ~6% in the vertical direction. b: The phase-encode direction is vertical, with 1.56 × 3.23 mm pixels. The dip amplitude is ~7% in the horizontal direction and ~9% in the vertical profile. The dark rim is also seen in the subendocardium of the RV.
Compensations
The effect of using an exponential filter is shown in Fig. 6. This filter greatly reduces the ringing, but also reduces contrast and resolution. The smoothing was done in only one dimension here, since the read direction had high resolution.
FIG. 6.
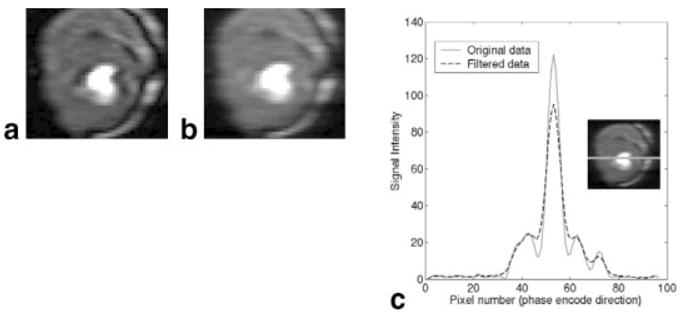
a: Image with a dark rim artifact. b: After 1D exponential filtering in the horizontal direction. c: Line profile of signal intensities through the image before and after filtering. The inset figure illustrates where the line profile originates.
DISCUSSION
While it is somewhat established that the dark rim artifact relates to susceptibility, motion, and/or resolution (4), further controlled experiments are needed to provide more insight into this issue. The current results demonstrate that dark rim artifacts similar to those found in vivo can be found in motion-free ex vivo hearts, and the nature of the artifact depends on spatial resolution in both the data acquisition and image display. The dark rim tends to be seen in the ex vivo hearts most prominently next to the blood–myocardium interface perpendicular to the direction with the lowest spatial resolution (which is typically the phase-encoding direction). The artifact width decreases with increasing acquisition spatial resolution. The artifact amplitude can be reduced by filtering. All of these trends are consistent with effects from truncating high k-space frequencies, also known as Gibbs ringing.
These findings have important implications for the quantification of transmural perfusion, endocardial perfusion, and endoepicardial perfusion gradients. Transmural perfusion is affected if a substantial part of the region is estimated incorrectly. Endocardial perfusion can be dramatically affected, as illustrated in Fig. 1, where the artifact resulted in a 50% change in the upslope parameter. Furthermore, endoepicardial perfusion gradients will be distorted if the endocardial estimate is inaccurate. In fact, since ischemia typically starts in the subendocardium, these artifacts mimic subendocardial ischemia to a great degree. Even for trained readers it can be difficult to distinguish dark rim artifact from true subendocardial ischemia if the blood pool stays rather bright and thus the artifact is not transient.
Gibbs ringing is likely not the only source of dark rim artifacts in vivo. Motion and susceptibility effects may be important factors to consider depending on the acquisition parameters, contrast dosage, and subject anatomy and physiology.
Susceptibility
Susceptibility can cause dark (and bright) artifacts at high gadolinium concentrations, as shown in vials and the subclavian vein in Ref. 10. These artifacts are due to dephasing and signal pile-up, and are predictable for simple geometries oriented perpendicular to the main magnetic field. Note that the TE is very short (~1 ms) for the perfusion sequence, which reduces susceptibility effects.
Partial Volume
Partial volume effects are another consideration. While standard partial volume effects would simply give a signal with intensity between the two mixed regions, the mix of blood and tissue in voxels bordering the LV blood pool could possibly cancel each other within the voxel at certain TEs in a manner similar to the phase cancellation of fat and water. This type of artifact would be expected to appear around the interface, rather than at selected parts. It would also likely be ~1 acquisition voxel wide, although with thick slices more voxels could have mixed blood and tissue, depending on the voxel size. The phase-encode direction has larger pixel dimensions, so an increase in partial volume effect would be expected in that direction. However, this would likely require a TE greater than the ~1 ms used here to reach a 180° phase shift across the dimensions of a single voxel.
A recent abstract reported results from a range of concentrations and resolutions with a bag suspended in a larger container (11). The artifact size tended to increase with concentration and poorer resolution. This trend is consistent with Gibbs ringing effects and, at the higher concentrations, susceptibility effects.
It is likely that with inversion recovery sequences, partial volume effects would produce significant dark rim artifacts. Some inversion times could pair a positive blood pool signal with a negative tissue signal to give reduced signal in voxels with mixed blood and tissue along the endocardium.
Edge Strength
Gibbs ringing is a function of the strength of the edge, the slope of the edge, and the acquisition pixel size. It has been shown that the amplitude of the first lobe of the ringing is 9% of the edge height. However, the degree of ringing seen in reconstructed images depends on the alignment of the image voxel locations with the edge location. If the edge is of infinite slope and falls on a sample point in the image, and the image is reconstructed without zero-filled interpolation, the Gibbs ringing will not be seen (8). Reconstruction with zero-filled interpolation or more general edge locations will always reveal some degree of Gibbs ringing, even with very high-resolution acquisitions. Whether the ringing is noticeable depends on the noise level and the position, strength, and slope of the edge.
As resolution is increased, the ringing is compressed spatially, while the amplitude remains the same if the edge has infinite slope. Thus the portion of the image affected by the first few ringing lobes (which die off as 1/x) becomes smaller. By Gibbs’ theory, the width of the dips should decrease linearly with an increase in the k-space acquisition extent. A trend was observed (Fig. 3) that lower-resolution acquisitions have wider dips, but the dip widths were too variable and too difficult to quantitate accurately in these experiments to determine whether a linear relationship existed.
The ringing is expected throughout the tissue and blood, at reduced and predictable amplitudes. The dip amplitudes estimated from the acquired images are consistent with that expected from Gibbs ringing. However, the ringing is most often apparent only at the blood–tissue interface. This is likely due to image noise and the visual Mach effect (12). The Mach effect is the property of the human visual system whereby greater contrast than is actually present is detected when the eye is presented with abrupt changes of intensity.
As expected (though not shown), the same type of dark rim artifact is apparent when an SSFP readout is used rather than the turboFLASH or fast gradient echo-echo train (FGRET). We observed the dark rim artifact in a dynamic canine study using SSFP, and it was similar to that seen in a subsequent turboFLASH acquisition that had a similar resolution and contrast dose. Fenchel et al. (13) reported that the dark rim artifact was more severe with SSFP acquisitions than with turboFLASH. The SSFP images did have higher contrast in that study, which would increase Gibbs ringing. Other artifacts due to flow effects in SSFP acquisitions (6,7) have also been reported.
Preliminary computer simulations that altered the signal strength in the blood pool have shown that the severity of the artifact can be very dependent on the blood-to-myocardium contrast (14). The simulations also implied that compartment model parameters are affected relatively little by the artifact.
Limitations
In this work we used ex vivo hearts to obtain a somewhat realistic testbed on which to assess different sequence parameters with an unchanging unmoving object, rather than attempt to duplicate these measurements with in vivo preparations. The tissue had no gadolinium in it, which is the case when the dark rim artifact initially appears in vivo, but is not the case during the time period of most interest (i.e., when the tissue takes up contrast agent). Tissue uptake would reduce the blood-to-tissue contrast and thus the size of the Gibbs ringing lobes. This artificial preparation is a limitation of the present work, and the conclusions should be considered with this in mind. In addition, relatively poor resolutions (up to 4.7 mm in the phase-encode direction) were used in some of the examples. so the artifacts were more clearly evident. Current clinical acquisitions can provide better spatial resolution in most cases, depending on the heart rate and the coverage required.
Another limiting factor is the cavity size. The ex vivo hearts used here were near systole, which can be expected to have different Gibbs ringing effects and susceptibility effects than when the walls are thinner and the cavity is more dilated.
CONCLUSIONS
The subendocardial dark rim artifact that is sometimes seen concomitantly with the gadolinium bolus in myocardial perfusion imaging is primarily a spatial resolution effect in some cases. Experiments with stationary ex vivo heart preparations showed that spatial resolution could cause and resolve such effects. Other factors (e.g., motion, susceptibility, and intravoxel phase cancellations) are also expected to cause or contribute to the dark rim artifact, depending on the situation.
As the use of subendocardial analysis of the myocardium becomes more widespread, the impact of the dark rim artifact will increase. For quantitative or semiquantitative analysis, high-resolution acquisitions (<2.5 mm resolution) and/or compensation schemes can be used to reduce the part of the dark rim artifact that is due to Gibbs ringing. Trained readers can also usually identify the artifact. An increased understanding of the role played by Gibbs ringing in the creation of dark rim artifacts will allow for improved data acquisition and analysis techniques for myocardial perfusion imaging.
Acknowledgments
We thank the Cardiovascular Research and Training Institute (CVRTI) at the University of Utah, and in particular Dr. Bonnie Punske for providing the ex vivo hearts. We also thank Nate Pack and Sathya Vijayakumar for their assistance with the imaging preparations.
References
- 1.Schwitter J, Nanz D, Kneifel S, Bertschinger K, Buchi M, Knusel PR, Marincek B, Luscher TF, Schulthess GKV. Assessment of myocardial perfusion in coronary artery disease by magnetic resonance. A comparison with positron emission tomography and coronary angiography. Circulation. 2001;103:2230–2235. doi: 10.1161/01.cir.103.18.2230. [DOI] [PubMed] [Google Scholar]
- 2.Lee DC, Simonetti OP, Harris KR, Holly TA, Judd RM, Wu E, Klocke FJ. Magnetic resonance versus radionuclide pharmacological stress perfusion imaging for flow-limiting stenoses of varying severity. Circulation. 2004;110:58–65. doi: 10.1161/01.CIR.0000133389.48487.B6. [DOI] [PubMed] [Google Scholar]
- 3.Muehling OM, Wilke NM, Panse P, Jerosch-Herold M, Wilson BV, Wilson RF, Miller LW. Reduced myocardial perfusion reserve and transmural perfusion gradient in heart transplant arteriopathy assessed by magnetic resonance imaging. J Am Coll Cardiol. 2003;42:1054–1060. doi: 10.1016/s0735-1097(03)00924-0. [DOI] [PubMed] [Google Scholar]
- 4.Barkhausen J, Hunold P, Jochims M, Debatin JF. Imaging of myocardial perfusion with magnetic resonance. J Magn Reson Imaging. 2004;19:750–757. doi: 10.1002/jmri.20073. [DOI] [PubMed] [Google Scholar]
- 5.Storey P, Chen Q, Li W, Edelman RR, Prasad PV. Band artifacts due to bulk motion. Magn Reson Med. 2002;48:1028–1036. doi: 10.1002/mrm.10314. [DOI] [PubMed] [Google Scholar]
- 6.Markl M, Alley MT, Elkins CJ, Pelc NJ. Flow effects in balanced steady state free precession imaging. Magn Reson Med. 2003;50:892–903. doi: 10.1002/mrm.10631. [DOI] [PubMed] [Google Scholar]
- 7.Storey P, Li W, Chen Q, Edelman RR. Flow artifacts in steady-state free precession cine imaging. Magn Reson Med. 2004;51:115–122. doi: 10.1002/mrm.10665. [DOI] [PubMed] [Google Scholar]
- 8.Parker DL, Gullberg GT, Frederick PR. Gibbs artifact removal in magnetic resonance imaging. Med Phys. 1987;14:640–645. doi: 10.1118/1.596032. [DOI] [PubMed] [Google Scholar]
- 9.Archibald R, Gelb A. A method to reduce the Gibbs ringing artifact in MRI scans while keeping tissue boundary integrity. IEEE Trans Med Imaging. 2002;21:305–319. doi: 10.1109/TMI.2002.1000255. [DOI] [PubMed] [Google Scholar]
- 10.Neimatallah MA, Chenevert TL, Carlos RC, Londy FJ, Dong Q, Prince MR, Kim HM. Subclavian MR arteriography: reduction of susceptibility artifact with short echo time and dilute gadopentetate dimeglumine. Radiology. 2000;217:581–586. doi: 10.1148/radiology.217.2.r00oc37581. [DOI] [PubMed] [Google Scholar]
- 11.Weber OM. On artifacts in first-pass myocardial perfusion imaging. Proceedings of the 8th Annual Soc Card Magn Res; San Francisco, CA, USA. 2005. pp. 111–112. [Google Scholar]
- 12.Welford WT. The visual Mach effect. Physics Educ. 1968;3:83–84. [Google Scholar]
- 13.Fenchel M, Helber U, Simonetti OP, Stauder NI, Kramer U, Nguyen CN, Finn JP, Claussen CD, Miller S. Multislice first-pass myocardial perfusion imaging: Comparison of saturation recovery (SR)-TrueFISP-two-dimensional (2D) and SR-TurboFLASH-2D pulse sequences. J Magn Reson Imaging. 2004;19:555–563. doi: 10.1002/jmri.20050. [DOI] [PubMed] [Google Scholar]
- 14.DiBella EVR. Spatial resolution and blood-to-myocardium contrast effects in perfusion studies. Proceedings of the 8th Annual Soc Card Magn Res; San Francisco, CA, USA. 2005. pp. 279–281. [Google Scholar]


