


Abstract
Specificity data for groups of transcription factors (TFs) in a common regulatory network can be used to computationally identify the location of cis-regulatory modules in a genome. The primary limitation for this type of analysis is the paucity of specificity data that is available for the majority of TFs. We describe an omega-based bacterial one-hybrid system that provides a rapid method for characterizing DNA-binding specificities on a genome-wide scale. Using this system, 35 members of the Drosophila melanogaster segmentation network have been characterized, including representative members of all of the major classes of DNA-binding domains. A suite of web-based tools was created that uses this binding site dataset and phylogenetic comparisons to identify cis-regulatory modules throughout the fly genome. These tools allow specificities for any combination of factors to be used to perform rapid local or genome-wide searches for cis-regulatory modules. The utility of these factor specificities and tools is demonstrated on the well-characterized segmentation network. By incorporating specificity data on an additional 66 factors that we have characterized, our tools utilize ∼14% of the predicted factors within the fly genome and provide an important new community resource for the identification of cis-regulatory modules.
INTRODUCTION
The identification of cis-regulatory sequences throughout the genome and the complementary sequence-specific trans-acting factors that bind within these modules is an important step in deciphering the mechanism of spatial and temporal gene regulation in metazoans. The majority of sequence-specific transcription factors (TFs) in a eukaryotic genome can be readily identified by sequence homology to previously identified families of DNA-binding domains, where complex organisms usually contain a higher proportion of TFs (∼5–10%) due to the requirement for more elaborate transcriptional regulatory networks (1). However, identifying cis-regulatory modules (CRMs) within a genome is difficult due to the more dynamic nature of these sequences relative to coding sequences (2) and the fact that the vast majority of DNA in higher eukaryotes is noncoding sequence (3).
Biochemical and computational methods for the identification of CRMs have been developed, yet limitations remain. Biochemical methods based on ChIP–chip (4–6), nuclease hypersensitive sites (7,8) and 5C (9,10) allow the identification of functional elements throughout the genome. However, these techniques are limited typically to cell types that can be obtained in sufficient quantities for each protocol. In addition, identification of genomic binding sites by ChIP does not reveal whether those sites are functional; binding sites that are occupied in vivo may not contribute to organismal fitness, as long as they do not have negative consequences (6,11). CRMs can be computationally identified by searching for overrepresented clusters of binding sites within the genome for groups of TFs that function in a common transcriptional regulatory network (12–16). The accuracy of these predictions can be improved by incorporating phylogenetic comparisons between species separated by moderate evolutionary distances (17,18). In combination with ChIP experiments, computational analysis of evolutionary conservation provides an approach to identify functional TF-binding sites (19).
The prediction of CRMs and their cognate factors via binding site cluster analysis has been most thoroughly studied in the context of the regulatory cascade driving anterior–posterior (A–P) pattern formation during embryogenesis in Drosophila melanogaster. A hierarchy of genes responsible for the systematic subdivision of the embryo into 14 segments has been defined through exhaustive genetic studies (20–22). These genes are expressed in four sequential steps—maternal, gap, pair-rule and segment polarity—with genes in each tier of the hierarchy cooperating with the previous group of factors to coordinate expression of the next set of genes (Figure 1). This cascade also activates the homeotic genes in distinct zones that define the initial body plan. The majority of genes within this regulatory network are TFs that coordinate patterned expression of the next tier of genes by binding to clusters of sites within their CRMs; the unique expression patterns of the activators and repressors that bind each CRM determine its spatial activity (23,24). However, even within this carefully studied network, the location and number of CRMs that regulate many genes within this segmentation cascade are unknown. One major obstacle is the limited specificity data available even for some of the central factors involved in this process (e.g. Gt and Kni) despite their identification about 20 years ago (17,25,26). Position weight matrices (PWMs) for subsets of these TFs have been utilized to identify new CRMs (12,14,17,26), but a more complete description of specificities would provide a powerful tool to predict CRMs in this transcriptional regulatory network.
Figure 1.
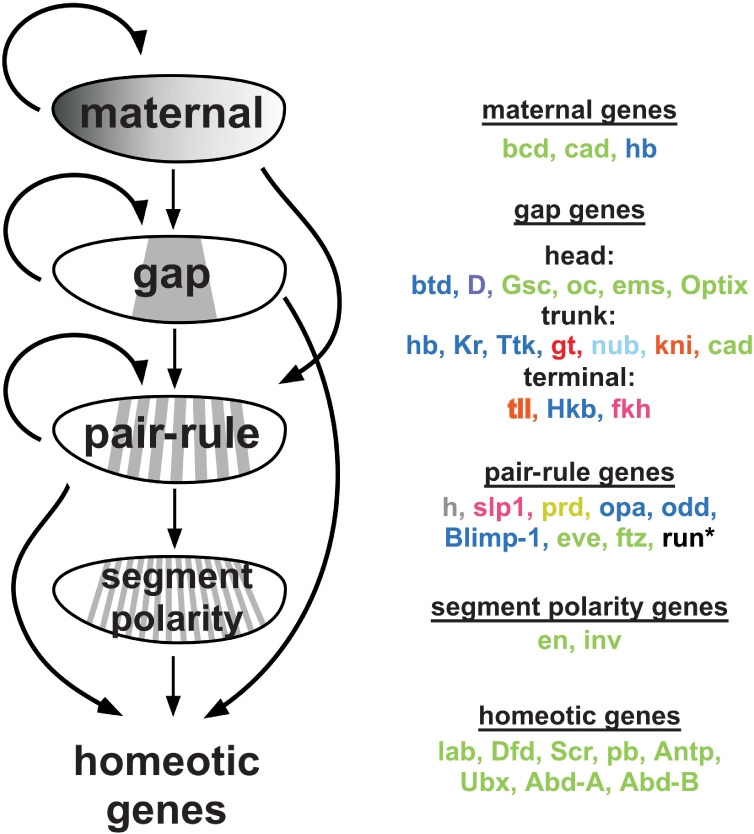
Transcription factors involved in A–P patterning. TFs involved in A–P patterning function in a hierarchical network to subdivide the embryo into 14 segments. The early maternal factors are expressed in broad gradients, with subsequent TF groups expressed in patterns that are increasingly refined. TFs involved in early segmentation or expressed in early patterns that were characterized in this study are grouped according to their initial stage of expression and they are color-coded to indicate the type of DNA-binding domain [Cys2His2 zinc fingers = blue, homeodomains = green, bHLH = gray, bZip = red, winged helix = pink, nuclear hormone receptor = orange, POU motif = light blue, paired motif = yellow, and HMG = lavender. Runt is black and was characterized as an alpha fusion (37)].
The small proportion of TFs with well-characterized DNA-binding specificities is not limited to D. melanogaster. This incomplete state of knowledge is representative of the majority of eukaryotic genomes and reflects the absence of high-throughput studies of factor specificities. In vitro methods for characterizing specificity include DNaseI footprinting (27), SELEX (28–31) and protein-binding microarrays (32–35). To date, these methods have not been widely adopted for large-scale analysis of TF specificities. TF specificities can also be identified as overrepresented motifs within DNA sequences identified in genome-wide TF ChIP datasets (4–6,36). When applied to the comparatively simple yeast genome, this approach successfully identified high confidence motifs for 65 of 203 (32%) of its TFs (4). The inability to determine specificities for the majority of these factors may reflect the difficulty in identifying motifs within the larger sequence segments defined by ChIP experiments and the complications associated with TFs that bind DNA in complexes with one or more other TFs.We have previously described a bacterial one-hybrid (B1H) system for the rapid characterization of TFs (37,38). This technology has certain attributes that make it suitable as a platform for the genome-wide analysis of DNA-binding domain specificities. Selections are performed in vivo, which precludes the need to purify any given factor. Moreover, binding sites are isolated based on their ability to activate a biological response in the context of competition from a pool of potential sites in the Escherichia coli genome, which simulates the functional requirements in a eukaryotic genome. Binding sites for a factor are isolated in a single round of selection using standard molecular biology and sequencing technologies making it accessible to most laboratories. Here, we describe substantial improvements to the B1H system that increase its sensitivity and dynamic range, and make it amenable for the high-throughput analysis of sequence-specific TFs (Figure 2). Using this system, we have determined specificities for 35 factors that play prominent roles in early A–P patterning. Our dataset dramatically expands the set of defined specificities for these factors and these motifs are good predictors of CRMs throughout the genome. To facilitate utilization of these specificities, we have created a GBrowse-based visualization tool (39) that allows an end-user to examine the overrepresentation of binding sites for any number of individual factors as well as combinations of these factors throughout the D. melanogaster genome (biotools.umassmed.edu/genomesurveyor). The genome browser interface is coupled to a genome-wide search tool to identify the most significant peaks of binding site overrepresentation for any combination of factors. Using the early segmentation network as a test case, we demonstrate that our dataset and computational tools can accurately identify known CRMs in this regulatory network.
Figure 2.

Overview of the omega-based B1H system. (A) Cartoon depicting recruitment of direct omega fusions (left) and omega–Zif12–HD fusions (right) to the weak promoter driving the HIS3 and URA3 reporters used in this system. The 28-bp library is positioned 7 bases upstream of the –35 box allowing the TF to bind to a recognition element up to three turns upstream of the promoter. The ZF10 library has the binding site for Zif12 (TGGGCGG) positioned 21 bases upstream of the promoter and the 10-bp randomized region is located immediately 5′ to this site. (B) Overview of Bait and Prey plasmids used in this system. Bait plasmids are constructed by cloning the TF of interest as a C-terminal fusion to omega (omega-TF hybrid). Homeodomains are cloned into a modified bait plasmid (pB1H2ω2-12) that results in their expression as an omega-ZF12-HD hybrid (Noyes, et al. manuscript in preparation). (C) Binding site selection procedure. A bait plasmid and the appropriate prey plasmid are transformed into the selection strain. Transformants are grown on minimal media lacking histidine and challenged with various concentrations of 3-AT. Surviving colonies represent a complementary interaction between the bait plasmid (TF) and a single member of the prey library. The library region from ∼20–25 surviving colonies are amplified by colony PCR and sequenced. The resulting sequences are analyzed by MEME (42) to recover the TF's recognition motif.
We have supplemented our specificity database with the specificities of an additional 66 factors that were also characterized using our B1H selection system (Noyes, et al. manuscript in preparation). The combination of a large database of factor specificities coupled with web-based tools for the rapid analysis of any combination of TFs provides the community with a readily accessible tool to discover CRMs genome-wide. The combination of computational analysis based on conservation of binding sites for individual factors and experimental techniques for identifying sites in a single organism (e.g. ChIP–chip) should allow a comprehensive annotation of the CRMs throughout the genome and the TFs that function through these elements.
MATERIALS AND METHODS
Omega-based binding site selection system
The omega-based binding site selection system (Figure 2) was derived from an alpha-based B1H selection system (37,38). A detailed description of the construction of the ΔrpoZ selection strain, the omega-fusion expression vectors, the 28-bp and ZF10 randomized libraries and the binding site selection procedure is presented in the Supplementary Methods.
Factor information
The amino acid sequence for each factor used and all of the sequences of the binding sites recovered in the individual selections are provided in Supplementary Table 1 with the exception of the majority of the homeodomain sequences and selected binding sites, which will be described seperately (Noyes, et al. manuscript in preparation). Sequence logos (40) for each factor were created by WebLogo (41) using the aligned motifs defined by MEME (42) identified within the B1H-selected sequences. PWMs representing the specificities of these factors are listed in Supplementary Table 2.
Omega-fusion activity assays
The constructs used in the omega-Zif268, omega-Gt, omega-Prd and omega-Hb activity assays as well as the assay conditions are described in the Supplementary Methods
Motifcount analysis
First, the ‘expression profile’ of a TF is determined from available data on the in situ hybridization of the TF's mRNA (17,43), which is a real-valued measurement of the TF's expression level in each of 100 equally spaced intervals (‘bins’) along the A–P axis of the Stage 4–6 (blastoderm) embryo. Then calculate the ‘discrete expression profile’ for a set of 48 CRMs that drive A–P gene expression in a defined pattern in the blastoderm embryo (17): for each CRM, determine whether it drives gene expression in each of the 100 bins along the A–P axis by imposing a fixed threshold on the real-valued expression levels. For each CRM, ‘count’ the number of binding sites for the TF, using its PWM and Stubb (44) as described in ref. (45). Then for each of the 100 bins along the A–P axis, collect the set of CRMs that are ‘expressed’ in that bin, and compute the average of the binding site counts for these CRMs. This average is the TF's ‘MOTIFCOUNT’ for that bin, which is plotted along with the TF's expression profile for each bin along the A–P axis.
P-values for this analysis were computed as follows:
For a repressor, regions of influence were chosen around the boundaries of its domain of expression, and for each such region of influence the correlation coefficient between the TF expression profile and its MOTIFCOUNT was tested by calculating the Pearson correlation coefficient (ρ). We tested the null hypothesis of ρ = 0 (with the alternative hypothesis ρ < 0, which represents anticorrelation).
For an activator, CRMs were classified as either ‘positive’ or ‘negative’ depending on whether the CRM's region of expression overlapped predominantly with the TF's expression domain, or not. A two-sample t-test was performed on the MOTIFCOUNT in these classes of CRMs to test for a difference of means in these two classes.
Gbrowser-based web tool
Single motif tracks
For each PWM, scan the genome with a sliding window of 500 bp shifted in 50-bp increments, and count the number of occurrences of the PWM in each window, using the Stubb program (44) to generate the ‘DICT’ score. The resulting profile of DICT scores is then plotted as a ‘track’ in GBrowse (39). These tracks are shown for each PWM in D. melanogaster and D. pseudoobscura in genomic coordinates of the former. A ‘two-species’ track is also plotted, combining the DICT scores of homologous windows from the two genomes. For this, each species’ DICT score is first converted to a ‘z-score’, by subtracting the genome-wide mean and then dividing by the genome-wide standard deviation, and the z-scores of the homologous windows are averaged. For D. melanogaster windows in which the syntenic region could not be properly defined using the ‘liftover’ tool (genome.ucsc.edu), the D. melanogaster z-score is halved to obtain the two-species track.
Motif combination tracks
Any combination of two or more PWMs can be used to create a ‘motif combination track’ that is dynamically plotted as follows: For each 500-bp window, the z-score of each PWM's DICT score is computed as above, set to zero if it is negative, and an average over the chosen combination of PWMs is regarded as the score of this window. The resulting score profile is plotted as a track. Such tracks may be created for each of the two genomes separately. A ‘two-species’ motif combination track may also be created by averaging the scores from homologous windows. The mean and standard deviation of a combination track is computed from 1 Mbp sequence on either side of the region currently displayed by the browser. The Genome-wide search tool is described in the Supplementary Methods.
RESULTS
Development of the omega-based B1H system
Our original B1H system for characterizing DNA-binding specificity utilized TF fusions to the alpha-subunit of RNA polymerase (alpha–TF) (37,38). This system contains three components: the alpha–TF expression vector, a tandem HIS3-URA3 reporter cassette in a low copy number plasmid (pH3U3) and the selection strain with the bacterial homologs of the reporter genes inactivated (ΔhisB, ΔpyrF). The HIS3-URA3 reporter cassette is regulated by a weak promoter and consequently these genes, which provide a direct method for auxotrophic selection, are only weakly transcribed. However, when a functional binding site for the alpha-linked TF is present upstream of the weak promoter, RNA polymerase can be actively recruited to stimulate transcription of the reporter cassette (46). Thus, bacteria harboring a complementary interaction between the TF and reporter DNA can be selected under appropriate growth conditions, allowing binding sites complementary to a TF to be isolated from a randomized library introduced into the reporter vector. Our alpha-based system, while suitable for characterizing factors such as Cys2His2 zinc finger proteins, proved ineffective with several additional factors, including basic helix–loop–helix proteins (bHLH) and homeodomains (data not shown). The origin of this limitation was unclear, but one potential source was insufficient sensitivity: alpha is an essential gene, and as such, alpha–TF fusions are in competition with endogenous alpha for incorporation into RNA polymerase complexes.
Omega is the only conserved component of bacterial RNA polymerase (α2ββ′ω) that is not required for viability under laboratory growth conditions (47). Hochschild and Dove (48) demonstrated that artificial interactions between a sequence-specific TF and the omega-subunit of RNA polymerase, like interactions with the alpha-subunit, could mediate activation of a nearby promoter. Because Omega is not required for viability, Omega-fusions have the potential advantage that selections might be performed in an omega-knockout (ΔrpoZ) strain, where omega-fusions could be uniformly incorporated into RNA polymerase without competition. Under these conditions, the selection system should be more sensitive due to the higher cellular concentration of RNAP–TF complexes, allowing weaker protein–DNA interactions to be characterized.
To test this hypothesis we knocked-out the rpoZ gene in our selection strain (Supplementary Figure 1) and examined the activity of an omega–Zif268 fusion with a reporter vector containing a Zif268-binding site. The fusion was expressed using three promoter strengths: a strong dual promoter (lppC-lacUV5) used for alpha-based selections, a lacUV5 promoter and a mutant lacUV5 promoter (lacUV5m) (Supplementary Figure 2). Omega–Zif268 expressed via the weakest (lacUV5m) promoter displayed robust activity, allowing cells to survive at higher 3-AT concentrations than was tolerated by the alpha–Zif268 fusion under optimal expression conditions (data not shown). Surprisingly, omega–Zif268 constructs expressed with either the dual promoter or the lacUV5 promoter proved toxic. However, for other factors (Paired, Hunchback and Giant) higher expression levels obtained using the stronger promoters were required to fully activate the reporter system (Supplementary Figure 3). The difference in promoter strengths used to drive expression of each factor was reflected in the relative protein expression levels of each factor within the cell (Supplementary Figure 4). Thus, the availability of three different promoter strengths provides flexibility to characterize a wide variety of TFs that may differ in affinity, specificity and expression level. The omega-based B1H system is sensitive to changes in the strength of the interaction between a DNA-binding domain and its target site. The activity of omega–Zif268 with its consensus sequence was compared to three different variants of the binding site that have 4- to 20-fold reduced affinity (49). A clear correlation is observed between colony size and number with the quality of the binding site: cells containing the consensus sequence within the reporter displayed the highest rates of survival and the largest colonies relative to the survival rates and colony sizes for other sites with decreased affinity (Supplementary Figure 5). Based on these results we expect that the distribution of sequences that are recovered from a binding site selection will be a function of the difference in affinity of the protein for these sites. As a result the recognition motif constructed from the selected sites should accurately reflect the specificity of the factor.
The optimal position of the Zif268-binding site was determined by examining the activity of reporters harboring sites positioned in various registers relative to the promoter (Supplementary Figure 6). Based on this analysis, a new 28-bp randomized binding site library was constructed that contains ∼2 × 10⁸ unique clones, which should encode the majority of possible 12-bp sites in each frame of the binding site window. The utility of the 28-bp library in the omega-B1H system was assessed by determining the DNA-binding specificity of three well-characterized DNA-binding domains: Zif268, Mig1 and Rap1. The recognition motif for each factor generated from the selected sequences matches well with previously described specificities for these factors (Supplementary Figure 7). Thus, the omega-based B1H system and the new 28-bp binding site library can be used to rapidly determine the DNA-binding specificity of a TF. However, homeodomains did not yield a recognition motif when characterized in the standard omega-based B1H system (data not shown). Consequently a modified version of the selection system was created for domains that are limited by either weak specificity or affinity (Figure 2): these factors are characterized as fusions to fingers 1 and 2 of Zif268 (Zif12) (50) using a modified randomized binding site library, ‘ZF10’, that is complementary to the incorporated fingers which will be described separately (Noyes et al. manuscript in preparation).
Large-scale analysis of D. melanogaster TFs
To demonstrate that this technology is sufficiently rapid and simple to perform a comprehensive characterization of the TFs, we focused on characterizing the majority of the factors in the early A–P patterning network in D. melanogaster. This network contains representative members of a wide variety of DNA-binding domain families that are present in higher eukaryotes (17). Included within this set of factors are members of the five most highly represented DNA-binding domain families (51): Cys2His2 zinc fingers, homeodomains, bHLH, bZIP and winged helix as well as other less well-represented domains (Figure 1). All told, ∼80% of the sequence-specific TFs in the fly genome utilize one of the DNA-binding domains represented in this group (52). Some of these TFs, such as the gap gene Kruppel (Kr), have very well-defined genetic roles and DNA-binding specificities. Others, such as the gap genes Giant (Gt) and Knirps (Kni) have well-defined genetic roles, but their specificities are only roughly described by a handful of binding sites mapped by DNaseI footprinting (27). Therefore, this set of factors provides an opportunity not only to supplement and improve the existing specificity data for this network but also to assess the ability of our technology to characterize a wide variety of DNA-binding domain families.
We characterized the specificity of 35 different factors involved in the A–P pathway, which represent nine different DNA-binding domain families (Figure 3 and Supplementary Table 1). The specificity determined for these factors using the omega-based B1H system is in most cases consistent with previously determined specificity data, where available. For example the existing DNase-based specificities of Bicoid (Bcd), Kr and Tailless (Tll), which represent three different families of DNA-binding domains, are quite similar to the specificities obtained from the B1H system (Figure 4). Moreover, the stringency of the selection can be varied to recover binding sites with different ranges in affinity as demonstrated by motifs generated for Bcd from sites collected at two different selection stringencies (5 and 10 mM 3-AT). Both of these motifs display the same core DNA-binding specificity that is consistent with previously published data (27,53), but the higher stringency selection yielded a more constrained motif, due to a greater enrichment of the highest affinity sites. Thus, where good specificity data previously exists, there is excellent concordance between the B1H data and other datasets for these factors.
Figure 3.

Specificities of the 35 TF in the A–P regulatory pathway characterized by the omega-B1H system. These TFs are grouped by DNA-binding domain family and color-coded as described in Figure 1.
Figure 4.

Comparison of B1H-generated recognition motifs to previously published data. (Left panels) The B1H recognition motifs for Bcd, Kr and Tll are very similar to the motifs generated from DNase footprinting data (FlyREG) (27). In the case of Bcd, the high stringency data (10 mM 3-AT) is most similar to the previously described SELEX data (53), whereas the lower stringency data is more similar to the FlyREG data. (Right panels) The B1H recognition motifs for Cad, Gt and Kni differ significantly from the FlyREG data. For Cad, the B1H-generated data is similar to SELEX data on the chicken homolog (55), but provides better definition of the overall sequence preference.
A number of factors in the dataset lacked quality recognition motifs. Some of these factors, such as Caudal (Cad), Gt and Kni, were originally identified and described ∼20 years ago, and play critical early roles in segmentation (25), yet have poorly defined specificity (Figure 4). For example, our recognition motif for Cad is similar to, but much better defined than, the specificity of Cad determined by Dearolf and colleagues (54) (TTTATG) based on several sites in the ftz zebra stripe element or than SELEX data available on the chicken Cad homolog, CdxA (55). The existing DNaseI footprinting data for Cad appears to misrepresent its specificity in the 3′ end of its recognition sequence (27). Two other notable examples are Gt and Kni. The existing DNaseI motifs for both of these factors contain only limited information about their sequence preferences. By comparison the B1H data for these factors provides a detailed description of their recognition motifs. Overall, we successfully determined the specificity of 35 D. melanogaster TFs. PMWs for these factors are listed in Supplementary Table 2. Only a single factor (Croc) attempted with this set of factors failed to produce a recognition motif using the omega-B1H system, resulting in a 97% success rate (35/36). This flexibility suggests that the omega-based B1H selection system will be suitable for the high-throughput characterization of the majority of sequence-specific TFs present in the D. melanogaster as well as other eukaryotic genomes.
Assessing the predictive value of the B1H-generated motifs
As an initial assessment of the utility of our binding site motifs for identifying CRMs, we examined the correlation between the expression profile of each TF and the occurrence of its binding sites in 48 CRMs from D. melanogaster that drive patterned gene expression in the early embryo, using a previously described method (17). When a TF functions as an activator, one would expect an overrepresentation of its binding sites in CRMs that drive gene expression in the same spatial and temporal domains. Conversely, when a TF functions as a repressor that defines a spatial boundary for the expression of a CRM, there should be an anticorrelation between the expression profile of the TF and of CRMs that contain its binding sites. We focused on a set of eight TFs that play prominent roles in early patterning for which we could compare our characterized recognition motifs (‘B1H’) with existing motifs previously utilized for CRM discovery (‘DnaseI’) (17). We used Stubb (44) to calculate, for each CRM, a score that describes the number of binding sites for any given TF and their quality based on its PWM. The A–P axis of the embryo was divided into 100 different regions and for each such region, the average of the scores (of a TF) over all of the CRMs contributing to gene expression in that region was calculated. This average score, called Motifcount, was then compared with the expression profile of each TF (Figure 5). Because local features of each Motifcount plot can be biased by the score of an individual CRM, which may or may not be significant, correlations between these plots were calculated over a sizeable fraction of the embryo (>15% embryo length). In almost every comparison significant correlations or anticorrelations are observed between the Motifcount scores for each TF and their expression profiles along the A–P axis. For some TFs, such as Bcd and Kr, we find that there are very similar Motifcount profiles for both the DNaseI and B1H PWMs, which is consistent with the similarity between their motifs (Figure 4). Bcd displays a strong correlation between its Motifcount and expression profile, as would be anticipated for an activator, whereas Kr displays a strong anticorrelation between its Motifcount and expression profile, as would be anticipated for a repressor. For the majority of these comparisons, the significance of the observed correlation or anticorrelation is greater for the B1H PWMs (indicated by the P-value; Figure 5). The most striking difference is observed for Kni, where the P-value improves from 0.2 to 10–14. Cad is the one exception; although the B1H motif is more consistent with the existing specificity data, the DNaseI recognition motif displays a somewhat better correlation with the expression data. The improved correlations observed for most of the B1H motifs are particularly noteworthy given that the majority of the DNaseI data is obtained from bindings sites footprinted within these CRMs.
Figure 5.

Motifcount plots over 48 CRMs from D. melanogaster that drive early patterned expression. Comparison of the Motifcount plots based on the DNaseI (17) and B1H PWMs for Bcd, Cad, Hb, Hkb, Gt, Kni, Kr and Tll. In each plot, the red line indicates the TF expression profile over the embryo length (x-axis, 0 = anterior pole; y-axis, arbitrary units). The average number of binding sites for each factor over the CRMs that drive expression in each region (the Motifcount, see Materials and Methods for calculation) is indicated by a blue line plotted as a function of the z-score, where 0 is the genome-wide mean (indicated by the magenta line). Solid bars at the top of each graph indicate the window regions over which correlations between the factor expression profile and the Motifcount profile were calculated with the exception of Bcd and Cad, which were calculated over the entire region. P-values for strongest correlation/anticorrelation between the TF expression profile and its Motifcount along the A–P axis are listed to the right of the plots where the bold value indicates the most significant correlation.
One additional feature of these plots is of particular interest. For some of the repressors, e.g. Gt, Hb and Hkb, there is a strong underrepresentation of binding sites in CRMs that have overlapping expression profiles. Selective pressure against the presence of these binding sites may play an important role in shaping the sequence composition of the CRM just as there is selective pressure to maintain binding sites for factors that participate in gene regulation (56). Overall, these results suggest that our B1H-generated PWMs have favorable properties for the prediction of CRMs and are superior to the previously employed PWMs for CRM discovery (17,26). A Motifcount analysis on syntenic regions to these CRMs within the D. pseudoobscura and D. mojanvensis genomes generates similar plots indicating that our PWMs should have utility for the prediction of CRMs within related species (Supplementary Figure 8).
Genome Surveyor: a new tool for identifying CRMs
We developed a new genome analysis tool, Genome Surveyor, to rapidly search for putative CRMs based on the presence of overrepresented binding sites for a combination of TFs. A simple scoring function was chosen based on its ability to readily identify known CRMs amongst a large population of random intergenic sequences (Supplementary Table 3): putative CRMs are identified by computing the average of the overrepresentation score (z-score) for a group of TFs over 500-bp windows tiled across the genome. Using our PWMs, this scoring function distinguishes CRMs in our test set with an accuracy that is similar to that of Stubb (44). Importantly, this scoring function provides an enormous advantage in speed over Stubb, as the z-scores for each factor can be calculated once across the genome and this stored information may then be used in all combination searches that include a particular TF. Our method differs from that of ecis-analyst (26) in that we value each site according to its PWM score, which allows both strong and weak sites to contribute to the overall score for each 500-bp window. The significance of the overall score in each window for each TF is determined by calculating a z-score, which reflects how the score in that window compares to the overall genomic distribution. In contrast, ecis-analyst employs a user-defined threshold (P-value) to determine if a site will be scored as present, and if defined as present, all sites contribute equally to the score.
We developed a flexible user interface that operates through the GBrowse software package (39) to allow a user to utilize our scoring function and library of PWMs to search for CRMs in the D. melanogaster genome (Figure 6). This interface allows gene-specific browsing or genome-wide searching for CRMs. For gene-specific browsing, tracks that indicate the scores for individual factors, along with their significance values, can be displayed across a genomic region of interest (up to 500 kb). Combination tracks can also be generated to identify peaks of binding site overrepresentation for any collection of factors. For example, in the genomic region surrounding ‘eve’ the tracks for individual maternal and gap factors (e.g. Bcd, Hkb, Hb, Kr and Tll) display small peaks indicating overrepresentation of sites at various positions, but when certain groups of these factors are combined, strong peaks of binding site overrepresentation are evident that correspond to known ‘eve’ pair-rule stripe CRMs (Figure 6). The accuracy of these CRM predictions can be increased by cross-species comparisons to identify peaks that are present in the D. melanogaster genome and in a syntenic region of the D. pseudoobscura genome (18,26). Using our scoring function, the identification of CRMs in a population of intergenic sequences is improved if scores from two genomes are combined (Supplementary Table 3). These comparisons are implemented in Genome Surveyor by calculating z-scores for each TF within the D. pseudoobscura genome and mapping the homologous regions onto the D. melanogaster genome. The Gbrowse window can be used to display individual and combination tracks for TFs in the D. pseudoobscura genome as well as ‘two-species tracks’ that average the z-scores of each factor or group of factors between the two genomes (Figure 6). This cross-species analysis over syntenic windows evaluates the total number of sites in each window, not the conservation of individual sites, as individual sites in a CRM may not be conserved but the entire element should be under stabilizing selection (56). These features allow a user to define significant clusters of binding sites for a group of factors in each genome independently, as well as within both genomes.
Figure 6.

Genome Surveyor display interface. A 20-kb region surrounding the ‘eve’ locus is displayed. Annotations for the D. melanogaster genome are shown at the top of the browser window. The predicted transcripts and genes in the D. melanogaster genome are indicated within the genomic region. Immediately below is a line indicating the regions where a high confidence alignment with the D. pseudoobsura genome has been assembled onto the melanogaster scaffold. Annotations for identified CRMs [downloaded from REDfly (62)] can also be displayed within this region. The user-configurable tracks for individual factors or groups of factors are displayed below the annotations. Multiple factor combination tracks can be displayed simultaneously. These tracks represent the average of the z-scores for each factor plotted over this genomic region for the combination of TFs selected by the user, where the factors included are indicated above each track (i.e. Kr, Bcd, Hkb, Tll and Hb, which were the anterior factor search set used to generate the list of hits in Table 1). The numbers in the upper left-hand corner indicate the maximum value (z-scores) for each plot, the estimated genome-wide mean and the mean + 2 SD, respectively. The positions of the genome-wide mean and the mean + 2 SD are also indicated on the plot by horizontal lines of the same color that transect the plot. In this view the two combination tracks (red) for the anterior factor search set are shown across D. melanogaster genome (mel) and the average over the D. melanogaster and D. pseudoobsura genomes (melpse). Both of these factor combinations contain a strong peak within the ‘eve’ stripe 1 CRM. Two other Combination tracks for other groups of factors (a different gap set and a pair-rule set) are also shown. These groups display significant peaks that overlap with other CRMs. Below the five Combination tracks are a number of tracks for individual factors. These tracks provide a rapid assessment of the individual factors that are potentially contributing to each combination track. For example, significant peaks for Bcd, Hkb, Kr and Tll all overlap with the stripe 1 CRM (blue box).
We also created a Genome Search Tool within Genome Surveyor that allows a user to perform genome-wide searches for the highest scoring windows using any combination of factors. This page can be accessed via a link in the Gbrowse webpage wherein users can select the combination of factors that they want to employ in their search, the number of top hits that they want returned, and the option to search in the D. melanogaster genome alone, or in combination with the D. pseudoobscura genome. To avoid recovering peaks that are primarily the result of a strong peak for a single factor, an additional filter can be enabled that requires the combination peak score to be composed of a certain number of factors with individual scores above a desired significance threshold. Each search returns a table of positions within the D. melanogaster genome with the highest average z-scores listed in descending order (Table 1). The z-scores for each hit are listed in the D. melanogaster and D. pseudoobscura genomes as well as the combination score across both genomes. The output also includes a list of factors that are contributing significantly to the score within each region, as well as the nearest neighboring genes and their distances from the center of the binding site cluster. The location of each hit is linked back to the Gbrowse tool to enable visualization of the surrounding genomic region for more detailed inspection of the contributing factors.
Table 1.
Top 20 matches in a genome-wide search for sequences with overrepresented binding sites for TFs that regulate anterior gene expression during early embryogenesis (Bcd, Hb, Hkb, Kr & Tll)
| Rank | Location | Dmel | Dpse | DmelDpse | Motifs | Gene | Known CRM | Expression |
|---|---|---|---|---|---|---|---|---|
| 1 | 2R 5498250 | 5.3 | 3.59 | 4.44 | bcd, hkb, tll, kr | eve | eve_stripe1 | stripe1 |
| 2 | 3L 8645450 | 5.65 | 1.6 | 3.62 | bcd, hkb, tll, kr | h | h_stripe1 | stripe1 |
| 3 | 2L 3611150 | 2.51 | 4.22 | 3.31 | bcd, tll kr | odd | odd_-5 | ant + post |
| 4 | 3R 2694100 | 3.47 | 3.07 | 3.24 | bcd, tll, kr | ftz | ftz_ftzDE | Stripe1 + 5 |
| 5 | 3L 20630500 | 3.33 | 2.93 | 3.13 | tll, kr | kni | kni_KD | ant+post |
| 6 | X 20534450 | 3.28 | 2.98 | 3.11 | hkb, tll, kr | run | stripes | |
| 7 | X 9535750 | 3.35 | 2.73 | 3.04 | bcd, tll, kr | btd | btd_Ss-Bg | head |
| 8 | 2L 12682100 | 3.29 | 2.66 | 2.91 | hkb, kr, hb | pdm2 | stripes | |
| 9 | 3R 4527100 | 2.73 | 2.96 | 2.78 | kr, hb | hb | hb_HZ526 | post |
| 10 | 3R 675650 | 1.81 | 3.47 | 2.64 | bcd, tll, hb | opa | stripes | |
| 11 | 2L 12689800 | 2.85 | 2.43 | 2.61 | hkb, kr, hb | pdm2 | stripes | |
| 12 | 2L 3834050 | 3.22 | 2.09 | 2.59 | bcd, kr | slp2 | slp2_-3 | ant |
| 13 | 3R 15955950 | 2.32 | 2.99 | 2.58 | bcd, tll | |||
| 14 | X 7500350 | 3.2 | 1.89 | 2.54 | tll, kr, hb | cut | CNS | |
| 15 | 2R 20730400 | 2.19 | 3 | 2.52 | bcd | Kr | Kr_CD1 | ant + central |
| 16 | X 20462750 | 2.85 | 2.38 | 2.52 | tll, kr | |||
| 17 | 3L 14138800 | 2.65 | 2.33 | 2.49 | bcd, hkb, kr | D | D_(+5) | central |
| 18 | 2R 20744500 | 1.99 | 2.89 | 2.44 | kr, hb | Kr | stripes | |
| 19 | 2R 5490050 | 2.25 | 2.53 | 2.38 | bcd, tll, kr | eve | eve_stripe2 | stripe 2 |
| 20 | 3L 6090300 | 2.16 | 2.76 | 2.37 | hkb, tll, kr, hb | Ets65A | CNS |
Genomic sites were ranked based on dual genome z-scores (DmelDpse; where genome-wide mean + 2 SD = 0.74). TF motifs with significant individual scores (>mean + 2 SD) are shown for each segment. Flanking genes and overlapping CRMs with anterior-posterior specific expression are shown. Because several of the factors are also expressed during CNS development, two flanking genes with CNS specific expression are also indicated.
The effectiveness of these tools and database is evident in the top hits that are returned from a combined D. melanogaster and D. pseudoobscura genome search using TFs that are involved in anterior patterning (Bcd, Hb, Hkb, Kr and Tll; Table 1). This search produces a remarkable number of strong hits that neighbor genes with early anterior expression patterns: 13 of the 15 top hits are in genes that display early anterior expression and 8 of these 13 are in previously annotated CRMs. The top hit from this search falls within ‘eve’ stripe 1 (Figure 6). Bcd, Hkb, Kr and Tll all contribute robustly to the composite peak at this position as is evident from their individual factor traces, which are all well in excess of 2 SD above the genomic mean. The next four hits within this search neighbor genes with gap or pair-rule patterns of expression (h, odd, ftz and kni; Table 1). The three hits neighboring the pair-rule genes are all in known CRMs that control expression of ‘stripe 1’, as might be anticipated for the anterior TFs set (Supplementary Figure 9). Performing the search using two genomes significantly increased the number of top hits near genes that are involved in early segmentation. A search with the same set of factors using only the D. melanogaster genome yielded a subset of the CRMs that were found in the two-species search (8 of the top 15 hits neighbor genes that display anterior expression, as opposed to 13 of 15 with the ‘two-species’ scores; Supplementary Table 4). Thus the dual genome search has enriched the validated positives recovered by the genomic search consistent with previous studies that have utilized cross-species comparisons in CRM identification (18,26).
DISCUSSION
We have developed an omega-based B1H system that allows the high-throughput determination of TF DNA-binding specificities. This system has several advantages over other techniques for characterizing DNA-binding specificity. First, the use of E. coli as our platform allows the isolation of TF-binding sites in vivo with a single round of selection without protein purification. Because of the extremely high transformation efficiency of E. coli, randomized binding site libraries with complexity greater than 108 members can be utilized. With omega–TF hybrids, the absence of competition from endogenous omega provides a more sensitive selection system with a much greater dynamic range than previous systems (37,57). This sensitivity has allowed us to successfully characterize TFs that failed to generate motifs in the alpha-based B1H system and make it feasible to consider a genome-wide analysis of TF specificities.
Using this system we have determined recognition motifs for 35 factors in the fly segmentation network. In addition, we have characterized the specificity of another 66 factors not directly associated with this network (Noyes et al. manuscript in preparation), which have been incorporated into our database. Together, these specificities represent ∼14% of the predicted D. melanogaster TFs (52). For comparison the FlyREG database contains motifs for 53 TFs constructed from five or more identified binding sites (27); thus our database nearly doubles the number of specificities that are available, and in cases where these databases overlap, our data is typically of higher quality.
Our data is not a perfect representation of each factor's specificity. For example, using our Knirps motif a strong region of binding site overrepresentation in ‘eve’ stripe 3 + 7 is identified, but only a weak peak is present in ‘eve’ stripe 4 + 6 (Figure 6). Both of these enhancers are regulated by Knirps (58), but while ‘eve’ stripe 3 + 7 has been previously demonstrated to have many high-quality binding sites, the previously predicted binding sites for Knirps in ‘eve’ stripe 4 + 6 are many fewer and much poorer matches to the consensus sequence. In fact, because the expression profile of ‘eve’ stripe 4 + 6 overlaps with the core expression domain of Knirps there will be selective pressure against high-affinity Knirps sites within this element. It is likely that our difficulty in identifying the weak binding sites within this region stems from the inability of our motif to accurately rank biologically relevant low-affinity sites. This limitation may result from the fact that our motifs are generated from a small number of selected binding sites (20 to 30 on average) and are typically collected at a single stringency. By sequencing a large number of selected sequences at multiple stringencies we should be able to further improve the sensitivity of our recognition motifs for low-affinity target sites (e.g. Bicoid, Figure 4).
The rate of successful TF characterization within the B1H system makes it amenable to perform comprehensive surveys of TF specificity in complex organisms: once cloned, 10 or more factors can be analyzed in parallel in the B1H system in a manner of days. Our current dataset is focused primarily on monomeric DNA-binding domains, but also includes examples of homodimers and heterodimers. This reductionist approach does not address the potential for sets of factors to cooperatively recognize motifs that are not a simple composite formed from their individual motifs, such as the Exd–Hox combinations (59–61). In cases where this may be a concern, pairs of factors can be characterized in the B1H system using expression vectors developed for evaluating the specificity of heterodimers (37,38).
The Genome Surveyor tool provides a fast, flexible and accessible platform to use the PWMs generated from our B1H data to identify CRMs in the fly genome. Other groups have previously used the D. melanogaster maternal and gap TFs to demonstrate that known and novel CRMs could be successfully identified within the genome based on the presence of clusters of binding sites for factors that function in a common regulatory pathway (12, 14,17,26). These studies demonstrated that even relatively crude representations of the DNA-binding specificity of a TF, typically constructed from DNaseI footprinting on a limited number of sites (52), could help identify CRMs and that these predictions could be improved by using two related fly genomes (18,26). These computational approaches, as well as an additional method (16) share the common overall strategy with Genome Surveyor of identifying clusters of overrepresented binding sites.
A key distinguishing feature of Genome Surveyor is that it precalculates the quality of each binding site within each window to generate an overall score, which is evaluated relative to the genome average to provide a measure of its significance. The scores of any combination of factors can then be combined with sufficient speed to allow genome-wide searches to be performed on a webserver. Thus, Genome Surveyor, which is integrated within the GBrowse software interface, provides a particularly powerful platform for gene-specific or genome-wide searches for CRMs regulated by a user-defined combination of factors. Genome-wide searches can be performed with any combination of 101 factors over the D. melanogaster and D. pseudoobscura genomes and individual peaks of interest within the genome can then be examined using the GBrowse tools. Peaks that overlap with previously identified CRMs can be easily identified by uploading annotations for these elements from the REDfly website (redfly.ccr.buffalo.edu) (62). The number and quality of PWMs available for these searches will increase with the adoption of new, high-depth sequencing such as 454 (63,64) and SOLEXA-based sequencing (65,66) for the analysis of the B1H-selected binding sites.
As the number of factors with high-quality PWMs increases, it should be feasible to annotate most potential CRMs using combinations of factors that function in common regulatory networks. Cooperating TFs could be identified based on common expression patterns, phenotypes or physical interactions. Because Genome Surveyor is built into the GBrowse webtool format (39), it will also be possible to incorporate other corroborating datasets into these tools, such as genome-wide ChIP analysis of TF binding or chromatin structure. The combination of these experimental and computation approaches for the identification of CRMs should provide the most robust method for the functional annotation of these elements throughout eukaryotic genomes.
SUPPLEMENTARY DATA
Supplementary Data are available at NAR Online.
ACKNOWLEDGEMENTS
We would like to thank the Berkeley Drosophila Genome Project (BDGP) for producing the cDNA clones used in this study, the Drosophila Genomics Resource Center (DGRC) for distributing the clones, and Mark Stapleton and Susan Celniker for sharing unpublished data. Some of these ORFs were obtained from clones produced by BDGP under National Institutes of Health grant (HG002673 to S. E. Celniker). We would like to thank Robin Smith for technical support. S.A.W. M.B.N. and X.M. were supported by National Institutes of Health grants (GM068110 and HG003721 to S.A.W.), A.W. was supported in part by National Institutes of Health grant (HG003721 to S.A.W.). M.H.B. and A.W. were supported in part by a New Scholar in Aging Award from the Ellison Medical Foundation and American Cancer Society grant (RSG-05-026-01-CCG) to M.H.B. Funding to pay the Open Access publication charges for this article was provided by GM068110.
Conflict of interest statement. None declared.
REFERENCES
- 1.Levine M, Tjian R. Transcription regulation and animal diversity. Nature. 2003;424:147–151. doi: 10.1038/nature01763. [DOI] [PubMed] [Google Scholar]
- 2.Ludwig MZ, Patel NH, Kreitman M. Functional analysis of eve stripe 2 enhancer evolution in Drosophila: rules governing conservation and change. Development. 1998;125:949–958. doi: 10.1242/dev.125.5.949. [DOI] [PubMed] [Google Scholar]
- 3.Siepel A, Bejerano G, Pedersen JS, Hinrichs AS, Hou M, Rosenbloom K, Clawson H, Spieth J, Hillier LW, et al. Evolutionarily conserved elements in vertebrate, insect, worm, and yeast genomes. Genome Res. 2005;15:1034–1050. doi: 10.1101/gr.3715005. [DOI] [PMC free article] [PubMed] [Google Scholar]
- 4.Harbison CT, Gordon DB, Lee TI, Rinaldi NJ, Macisaac KD, Danford TW, Hannett NM, Tagne JB, Reynolds DB, et al. Transcriptional regulatory code of a eukaryotic genome. Nature. 2004;431:99–104. doi: 10.1038/nature02800. [DOI] [PMC free article] [PubMed] [Google Scholar]
- 5.Lee TI, Rinaldi NJ, Robert F, Odom DT, Bar-Joseph Z, Gerber GK, Hannett NM, Harbison CT, Thompson CM, et al. Transcriptional regulatory networks in Saccharomyces cerevisiae. Science. 2002;298:799–804. doi: 10.1126/science.1075090. [DOI] [PubMed] [Google Scholar]
- 6.Zeitlinger J, Zinzen RP, Stark A, Kellis M, Zhang H, Young RA, Levine M. Whole-genome ChIP-chip analysis of Dorsal, Twist, and Snail suggests integration of diverse patterning processes in the Drosophila embryo. Genes Dev. 2007;21:385–390. doi: 10.1101/gad.1509607. [DOI] [PMC free article] [PubMed] [Google Scholar]
- 7.Crawford GE, Holt IE, Mullikin JC, Tai D, National Institutes of Health Intramural Sequencing C, Blakesley R, Bouffard G, Young A, Masiello C, et al. Identifying gene regulatory elements by genome-wide recovery of DNase hypersensitive sites. Proc. Natl. Acad. Sci. 2004;101:992–997. doi: 10.1073/pnas.0307540100. [DOI] [PMC free article] [PubMed] [Google Scholar]
- 8.Sabo PJ, Humbert R, Hawrylycz M, Wallace JC, Dorschner MO, McArthur M, Stamatoyannopoulos JA. Genome-wide identification of DNaseI hypersensitive sites using active chromatin sequence libraries. Proc. Natl Acad. Sci. 2004;101:4537–4542. doi: 10.1073/pnas.0400678101. [DOI] [PMC free article] [PubMed] [Google Scholar]
- 9.Dostie J, Richmond TA, Arnaout RA, Selzer RR, Lee WL, Honan TA, Rubio ED, Krumm A, Lamb J, Nusbaum C, et al. Chromosome Conformation Capture Carbon Copy (5C): a massively parallel solution for mapping interactions between genomic elements. Genome Res. 2006;16:1299–1309. doi: 10.1101/gr.5571506. [DOI] [PMC free article] [PubMed] [Google Scholar]
- 10.Dostie J, Dekker J. Mapping networks of physical interactions between genomic elements using 5C technology. Nat. Protocol. 2007;2:988–1002. doi: 10.1038/nprot.2007.116. [DOI] [PubMed] [Google Scholar]
- 11.Gao F, Foat B, Bussemaker H. Defining transcriptional networks through integrative modeling of mRNA expression and transcription factor binding data. BMC Bioinformatics. 2004;5:31. doi: 10.1186/1471-2105-5-31. [DOI] [PMC free article] [PubMed] [Google Scholar]
- 12.Berman BP, Nibu Y, Pfeiffer BD, Tomancak P, Celniker SE, Levine M, Rubin GM, Eisen MB. Exploiting transcription factor binding site clustering to identify cis-regulatory modules involved in pattern formation in the Drosophila genome. Proc. Natl Acad. Sci. USA. 2002;99:757–762. doi: 10.1073/pnas.231608898. [DOI] [PMC free article] [PubMed] [Google Scholar]
- 13.Markstein M, Markstein P, Markstein V, Levine MS. Genome-wide analysis of clustered Dorsal binding sites identifies putative target genes in the Drosophila embryo. Proc. Natl Acad. Sci. USA. 2002;99:763–768. doi: 10.1073/pnas.012591199. [DOI] [PMC free article] [PubMed] [Google Scholar]
- 14.Rajewsky N, Vergassola M, Gaul U, Siggia ED. Computational detection of genomic cis-regulatory modules applied to body patterning in the early Drosophila embryo. BMC Bioinformatics. 2002;3:30. doi: 10.1186/1471-2105-3-30. [DOI] [PMC free article] [PubMed] [Google Scholar]
- 15.Lifanov AP, Makeev VJ, Nazina AG, Papatsenko DA. Homotypic regulatory clusters in Drosophila. Genome Res. 2003;13:579–588. doi: 10.1101/gr.668403. [DOI] [PMC free article] [PubMed] [Google Scholar]
- 16.Sosinsky A, Bonin CP, Mann RS, Honig B. Target Explorer: An automated tool for the identification of new target genes for a specified set of transcription factors. Nucleic Acids Res. 2003;31:3589–3592. doi: 10.1093/nar/gkg544. [DOI] [PMC free article] [PubMed] [Google Scholar]
- 17.Schroeder MD, Pearce M, Fak J, Fan H, Unnerstall U, Emberly E, Rajewsky N, Siggia ED, Gaul U. Transcriptional control in the segmentation gene network of Drosophila. PLoS Biol. 2004;2:E271. doi: 10.1371/journal.pbio.0020271. [DOI] [PMC free article] [PubMed] [Google Scholar]
- 18.Sinha S, Schroeder MD, Unnerstall U, Gaul U, Siggia ED. Cross-species comparison significantly improves genome-wide prediction of cis-regulatory modules in Drosophila. BMC Bioinformatics. 2004;5:129. doi: 10.1186/1471-2105-5-129. [DOI] [PMC free article] [PubMed] [Google Scholar]
- 19.Kheradpour P, Stark A, Roy S, Kellis M. Reliable prediction of regulator targets using 12 Drosophila genomes. Genome research. 2007;17:1919–1931. doi: 10.1101/gr.7090407. [DOI] [PMC free article] [PubMed] [Google Scholar]
- 20.Jaeger J, Reinitz J. On the dynamic nature of positional information. BioEssays. 2006;28:1102–1111. doi: 10.1002/bies.20494. [DOI] [PubMed] [Google Scholar]
- 21.Peel AD, Chipman AD, Akam M. Arthropod segmentation: beyond the Drosophila paradigm. Nat. Rev. Genet. 2005;6:905–916. doi: 10.1038/nrg1724. [DOI] [PubMed] [Google Scholar]
- 22.Pick L. Segmentation: painting stripes from flies to vertebrates. Dev. Genet. 1998;23:1–10. doi: 10.1002/(SICI)1520-6408(1998)23:1<1::AID-DVG1>3.0.CO;2-A. [DOI] [PubMed] [Google Scholar]
- 23.Arnosti DN, Barolo S, Levine M, Small S. The eve stripe 2 enhancer employs multiple modes of transcriptional synergy. Development. 1996;122:205–214. doi: 10.1242/dev.122.1.205. [DOI] [PubMed] [Google Scholar]
- 24.Arnosti DN. Analysis and function of transcriptional regulatory elements: insights from Drosophila. Annu. Rev. Entomol. 2003;48:579–602. doi: 10.1146/annurev.ento.48.091801.112749. [DOI] [PubMed] [Google Scholar]
- 25.St Johnston D, Nusslein-Volhard. The origin of pattern and polarity in the Drosophila embryo. Cell. 1992;68:201–219. doi: 10.1016/0092-8674(92)90466-p. [DOI] [PubMed] [Google Scholar]
- 26.Berman BP, Pfeiffer BD, Laverty TR, Salzberg SL, Rubin GM, Eisen MB, Celniker SE. Computational identification of developmental enhancers: conservation and function of transcription factor binding-site clusters in Drosophila melanogaster and Drosophila pseudoobscura. Genome Biol. 2004;5:R61. doi: 10.1186/gb-2004-5-9-r61. [DOI] [PMC free article] [PubMed] [Google Scholar]
- 27.Bergman CM, Carlson JW, Celniker SE. Drosophila DNase I footprint database: a systematic genome annotation of transcription factor binding sites in the fruitfly, Drosophila melanogaster. Bioinformatics. 2005;21:1747–1749. doi: 10.1093/bioinformatics/bti173. [DOI] [PubMed] [Google Scholar]
- 28.Ellington AD, Szostak JW. In vitro selection of RNA molecules that bind specific ligands. Nature. 1990;346:818–822. doi: 10.1038/346818a0. [DOI] [PubMed] [Google Scholar]
- 29.Tuerk C, Gold L. Systematic evolution of ligands by exponential enrichment: RNA ligands to bacteriophage T4 DNA polymerase. Science. 1990;249:505–510. doi: 10.1126/science.2200121. [DOI] [PubMed] [Google Scholar]
- 30.Wright WE, Funk WD. CASTing for multicomponent DNA-binding complexes. Trends Biochem. Sci. 1993;18:77–80. doi: 10.1016/0968-0004(93)90156-h. [DOI] [PubMed] [Google Scholar]
- 31.Roulet E, Busso S, Camargo AA, Simpson AJ, Mermod N, Bucher P. High-throughput SELEX-SAGE method for quantitative modeling of transcription-factor binding sites. Nat. Biotechnol. 2002;20:831–835. doi: 10.1038/nbt718. [DOI] [PubMed] [Google Scholar]
- 32.Bulyk ML, Huang X, Choo Y, Church GM. Exploring the DNA-binding specificities of zinc fingers with DNA microarrays. Proc. Natl Acad. Sci. USA. 2001;98:7158–7163. doi: 10.1073/pnas.111163698. [DOI] [PMC free article] [PubMed] [Google Scholar]
- 33.Linnell J, Mott R, Field S, Kwiatkowski DP, Ragoussis J, Udalova IA. Quantitative high-throughput analysis of transcription factor binding specificities. Nucleic Acids Res. 2004;32:e44. doi: 10.1093/nar/gnh042. [DOI] [PMC free article] [PubMed] [Google Scholar]
- 34.Berger MF, Philippakis AA, Qureshi AM, He FS, Estep PW, Bulyk ML. Compact, universal DNA microarrays to comprehensively determine transcription-factor binding site specificities. Nat. Biotech. 2006;24:1429–1435. doi: 10.1038/nbt1246. [DOI] [PMC free article] [PubMed] [Google Scholar]
- 35.Mukherjee S, Berger MF, Jona G, Wang XS, Muzzey D, Snyder M, Young RA, Bulyk ML. Rapid analysis of the DNA-binding specificities of transcription factors with DNA microarrays. Nat. Genet. 2004;36:1331–1339. doi: 10.1038/ng1473. [DOI] [PMC free article] [PubMed] [Google Scholar]
- 36.Lieb JD, Liu X, Botstein D, Brown PO. Promoter-specific binding of Rap1 revealed by genome-wide maps of protein–DNA association. Nat. Genet. 2001;28:327–334. doi: 10.1038/ng569. [DOI] [PubMed] [Google Scholar]
- 37.Meng X, Brodsky MH, Wolfe SA. A bacterial one-hybrid system for determining the DNA-binding specificity of transcription factors. Nat. Biotechnol. 2005;23:988–994. doi: 10.1038/nbt1120. [DOI] [PMC free article] [PubMed] [Google Scholar]
- 38.Meng X, Wolfe SA. Identifying DNA sequences recognized by a transcription factor using a bacterial one-hybrid system. Nat. Protocol. 2006;1:30–45. doi: 10.1038/nprot.2006.6. [DOI] [PubMed] [Google Scholar]
- 39.Stein LD, Mungall C, Shu S, Caudy M, Mangone M, Day A, Nickerson E, Stajich JE, Harris TW, Arva A, et al. The Generic Genome Browser: a building block for a model organism system database. Genome Res. 2002;12:1599–1610. doi: 10.1101/gr.403602. [DOI] [PMC free article] [PubMed] [Google Scholar]
- 40.Schneider TD, Stephens RM. Sequence logos: a new way to display consensus sequences. Nucleic Acids Res. 1990;18:6097–6100. doi: 10.1093/nar/18.20.6097. [DOI] [PMC free article] [PubMed] [Google Scholar]
- 41.Crooks GE, Hon G, Chandonia JM, Brenner SE. WebLogo: a sequence logo generator. Genome Res. 2004;14:1188–1190. doi: 10.1101/gr.849004. [DOI] [PMC free article] [PubMed] [Google Scholar]
- 42.Bailey TL, Elkan C. Fitting a mixture model by expectation maximization to discover motifs in biopolymers. Proc. Int. Conf. Intell. Syst. Mol. Biol. 1994;2:28–36. [PubMed] [Google Scholar]
- 43.Tomancak P, Berman BP, Beaton A, Weiszmann R, Kwan E, Hartenstein V, Celniker SE, Rubin GM. Global analysis of patterns of gene expression during Drosophila embryogenesis. Genome Biol. 2007;8:R145. doi: 10.1186/gb-2007-8-7-r145. [DOI] [PMC free article] [PubMed] [Google Scholar]
- 44.Sinha S, van Nimwegen E, Siggia ED. A probabilistic method to detect regulatory modules. Bioinformatics. 2003;19(Suppl. 1):i292–i301. doi: 10.1093/bioinformatics/btg1040. [DOI] [PubMed] [Google Scholar]
- 45.Sinha S. On counting position weight matrix matches in a sequence, with application to discriminative motif finding. Bioinformatics. 2006;22:e454–463. doi: 10.1093/bioinformatics/btl227. [DOI] [PubMed] [Google Scholar]
- 46.Dove SL, Joung JK, Hochschild A. Activation of prokaryotic transcription through arbitrary protein-protein contacts. Nature. 1997;386:627–630. doi: 10.1038/386627a0. [DOI] [PubMed] [Google Scholar]
- 47.Gentry DR, Burgess RR. rpoZ, encoding the omega subunit of Escherichia coli RNA polymerase, is in the same operon as spoT. J. Bacteriol. 1989;171:1271–1277. doi: 10.1128/jb.171.3.1271-1277.1989. [DOI] [PMC free article] [PubMed] [Google Scholar]
- 48.Dove SL, Hochschild A. Conversion of the omega subunit of Escherichia coli RNA polymerase into a transcriptional activator or an activation target. Genes Dev. 1998;12:745–754. doi: 10.1101/gad.12.5.745. [DOI] [PMC free article] [PubMed] [Google Scholar]
- 49.Miller JC, Pabo CO. Rearrangement of side-chains in a Zif268 mutant highlights the complexities of zinc finger-DNA recognition. J. Mol. Biol. 2001;313:309–315. doi: 10.1006/jmbi.2001.4975. [DOI] [PubMed] [Google Scholar]
- 50.Pomerantz JL, Sharp PA, Pabo CO. Structure-based design of transcription factors. Science. 1995;267:93–96. doi: 10.1126/science.7809612. [DOI] [PubMed] [Google Scholar]
- 51.Tupler R, Perini G, Green MR. Expressing the human genome. Nature. 2001;409:832–833. doi: 10.1038/35057011. [DOI] [PubMed] [Google Scholar]
- 52.Adryan B, Teichmann SA. FlyTF: a systematic review of site-specific transcription factors in the fruit fly Drosophila melanogaster. Bioinformatics. 2006;22:1532–1533. doi: 10.1093/bioinformatics/btl143. [DOI] [PubMed] [Google Scholar]
- 53.Wilson DS, Sheng G, Jun S, Desplan C. Conservation and diversification in homeodomain-DNA interactions: a comparative genetic analysis. Proc. Natl Acad. Sci. USA. 1996;93:6886–6891. doi: 10.1073/pnas.93.14.6886. [DOI] [PMC free article] [PubMed] [Google Scholar]
- 54.Dearolf CR, Topol J, Parker CS. The caudal gene product is a direct activator of fushi tarazu transcription during Drosophila embryogenesis. Nature. 1989;341:340–343. doi: 10.1038/341340a0. [DOI] [PubMed] [Google Scholar]
- 55.Margalit Y, Yarus S, Shapira E, Gruenbaum Y, Fainsod A. Isolation and characterization of target sequences of the chicken CdxA homeobox gene. Nucleic Acids Res. 1993;21:4915–4922. doi: 10.1093/nar/21.21.4915. [DOI] [PMC free article] [PubMed] [Google Scholar]
- 56.Ludwig MZ, Bergman C, Patel NH, Kreitman M. Evidence for stabilizing selection in a eukaryotic enhancer element. Nature. 2000;403:564–567. doi: 10.1038/35000615. [DOI] [PubMed] [Google Scholar]
- 57.Durai S, Bosley A, Abulencia AB, Chandrasegaran S, Ostermeier M. A bacterial one-hybrid selection system for interrogating zinc finger-DNA interactions. Comb. Chem. High Throughput Screen. 2006;9:301–311. doi: 10.2174/138620706776843147. [DOI] [PubMed] [Google Scholar]
- 58.Clyde DE, Corado MS, Wu X, Pare A, Papatsenko D, Small S. A self-organizing system of repressor gradients establishes segmental complexity in Drosophila. Nature. 2003;426:849–853. doi: 10.1038/nature02189. [DOI] [PubMed] [Google Scholar]
- 59.Pearson JC, Lemons D, McGinnis W. Modulating Hox gene functions during animal body patterning. Nat. Rev. Genet. 2005;6:893–904. doi: 10.1038/nrg1726. [DOI] [PubMed] [Google Scholar]
- 60.Ryoo HD, Mann RS. The control of trunk Hox specificity and activity by Extradenticle. Genes Dev. 1999;13:1704–1716. doi: 10.1101/gad.13.13.1704. [DOI] [PMC free article] [PubMed] [Google Scholar]
- 61.Wilson DS, Desplan C. Structural basis of Hox specificity. Nat. Struct. Biol. 1999;6:297–300. doi: 10.1038/7524. [DOI] [PubMed] [Google Scholar]
- 62.Gallo SM, Li L, Hu Z, Halfon MS. REDfly: a Regulatory Element Database for Drosophila. Bioinformatics. 2006;22:381–383. doi: 10.1093/bioinformatics/bti794. [DOI] [PubMed] [Google Scholar]
- 63.Margulies M, Egholm M, Altman WE, Attiya S, Bader JS, Bemben LA, Berka J, Braverman MS, Chen YJ, Chen Z, et al. Genome sequencing in microfabricated high-density picolitre reactors. Nature. 2005;437:376–380. doi: 10.1038/nature03959. [DOI] [PMC free article] [PubMed] [Google Scholar]
- 64.Hoffmann C, Minkah N, Leipzig J, Wang G, Arens MQ, Tebas P, Bushman FD. DNA bar coding and pyrosequencing to identify rare HIV drug resistance mutations. Nucleic Acids Res. 2007;35:e91. doi: 10.1093/nar/gkm435. [DOI] [PMC free article] [PubMed] [Google Scholar]
- 65.Johnson DS, Mortazavi A, Myers RM, Wold B. Genome-wide mapping of in vivo protein–DNA interactions. Science. 2007;316:1497–1502. doi: 10.1126/science.1141319. [DOI] [PubMed] [Google Scholar]
- 66.Barski A, Cuddapah S, Cui K, Roh T-Y, Schones DE, Wang Z, Wei G, Chepelev I, Zhao K. High-resolution profiling of histone methylations in the human genome. Cell. 2007;129:823–837. doi: 10.1016/j.cell.2007.05.009. [DOI] [PubMed] [Google Scholar]
Associated Data
This section collects any data citations, data availability statements, or supplementary materials included in this article.