


Abstract
Several methods are available to predict cis-regulatory modules in DNA based on position weight matrices. However, the performance of these methods generally depends on a number of additional parameters that cannot be derived from sequences and are difficult to estimate because they have no physical meaning. As the best way to detect cis-regulatory modules is the way in which the proteins recognize them, we developed a new scoring method that utilizes the underlying physical binding model. This method requires no additional parameter to account for multiple binding sites; and the only necessary parameters to model homotypic cooperative interactions are the distances between adjacent protein binding sites in basepairs, and the corresponding cooperative binding constants. The heterotypic cooperative binding model requires one more parameter per cooperatively binding protein, which is the concentration multiplied by the partition function of this protein. In a case study on the bacterial ferric uptake regulator, we show that our scoring method for homotypic cooperatively binding proteins significantly outperforms other PWM-based methods where biophysical cooperativity is not taken into account.
INTRODUCTION
Unraveling regulatory pathways is a key step toward understanding biological processes. A major problem with which biologists are often confronted is that they want to retrieve new binding sites for a known regulatory protein, while reducing the number of costly and time-consuming experiments. Therefore, they generally construct a PWM based on a set of known binding sequences such as those resulting from SELEX experiments. Then they score the putative promoter of each gene and validate the highest scoring genes in the wet lab by, e.g. mutagenesis in the predicted binding site followed by RT-PCR.
Several methods have been developed to score genes based on a PWM, depending on the interaction between the transcription factor and DNA. The first interaction mode studied was between a protein and a single binding site within a promoter (1). Later on, physically inspired adaptations were proposed to account for multiple binding sites (2) and cooperatively binding proteins (3), as well as more statistically inspired methods such as Cluster Buster (4) and MSCAN (5). However, the performance of these methods depends on a number of additional parameters that cannot be derived from sequences and are difficult to estimate as they have no physical meaning. In this article, we describe a new scoring method that takes multiple binding sites and cooperative binding into account by means of a minimum number of physical parameters. Therefore, we theoretically derive the binding probability within a putative promoter sequence. First, we consider the binding probability at a single binding site, then the influence of multiple binding sites and homotypic cooperative binding is studied (i.e. cooperative binding with the same protein). Subsequently, we apply our method to the homotypic cooperatively binding ferric uptake regulator (Fur) in Pseudomonas aeruginosa and show that taking cooperativity into account yields a significant performance enhancement. Finally, we also describe how the method can be extended to heterotypic cooperatively binding proteins and pre-bound complexes with a flexible dimerization domain.
METHODS
The single binding site model
Our aim is to score and rank genes based on the probability that they are regulated by a given protein. This probability can be estimated as the probability that at least one protein copy is bound within the putative promoter. If each promoter contains maximum one binding site, genes can be ranked based on the binding probability at the best scoring site within their promoter. The equilibrium probability of a site  being bound by a transcription factor
  is
is
| 1 |
| 2 |
| 3 |
with Ki the binding constant. This equation is in fact an alternative formulation of the Fermi-Dirac distribution (6), and can be well approximated by the Boltzmann distribution for sites with a low binding probability:
| 4 |
Even though this equation does not yield a good approximation of the binding probability for the best binding sites, it preserves the rank order of the sites. This implies that genes can be ranked based on the probability Pi of a single protein binding at a site  , which is (7)
| 5 |
with Z the partition function  , and Γ the number of sites in the genome. Γ equals twice (two strands) the genome length, or in the special case of a homodimeric protein only once because of rotation symmetry.
Suppose, we are given a set of aligned sequences Xin for  , where it is known that each Xin is a preferred binding site for the considered DNA-binding protein. Based on the frequency matrix f(b, j) of these sequences and the genomic base frequencies p(b), a PWM can be defined as (1)
| 6 |
and Pi can be estimated as follows:
| 7 |
However, we noticed that this equation is only correct up to a constant factor. This can be explained as follows: in the derivation of Equation (6) (which is shown in the online supporting material), the approximation was made that the partition function equals its expected value  , while it is mainly dependent on the best binding sites as they have the highest Ki's. Therefore, the Pi's calculated in Equation (7) are scaled by a factor
  which, fortunately, does not influence the rank order of the individual sites. Even more, this factor can easily be calculated since the sum
  should be equal to one.
Multiple binding sites and homotypic cooperative binding
To take multiple binding sites into account when predicting regulation, Liu and Clarke calculated the probability  that at least one of the sites is occupied within the putative promoter of a gene (2):
| 8 |
with  the number of sites within the putative promoter (i.e. the promoter length minus the length of the given aligned sequences), and
  calculated as in Equation (3). Later on, Granek and Clarke (3) adapted this formula to take cooperative binding into account. However, these approaches are not unproblematic. A major issue is that the approximation in Equation (3) is not thermodynamically justified as shown in the next paragraph. Moreover, the protein concentration and the binding constant in Equation (3) are often unknown. Binding constants can only be calculated from the Pi's if the partition function Z in Equation (5) is known. Furthermore, we noticed that the cooperative binding method developed by Granek and Clarke (3) is not applicable in the homotypic case. They implicitly assumed that there is one crucial regulatory protein and that its binding probability is affected through direct interactions by a number of cooperatively binding proteins. This concept cannot be used in the homotypic case as we cannot make a distinction between the crucial and the cooperatively binding proteins.
To derive a correct formula for  , we followed a similar reasoning as used to obtain Equation (4) starting from Equation (1). Analogously to Equations (3) and (4), we find:
| 9 |
and
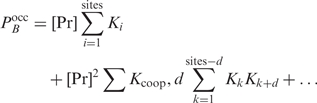 |
10 |
with  the cooperative binding constant for two proteins binding with d basepairs between their start positions. Note that in the multiple binding sites model, where cooperative binding is not taken into account,
  for every possible d. Filling in Equation (5) yields a formulation in terms of Pi:
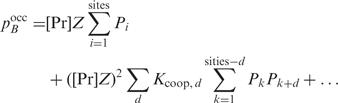 |
11 |
The second order terms in which  hardly influence the rank order of the genes as the Pi's of successive sites typically differ by several orders of magnitude. Hence, we will neglect them and only use the first term in our multiple binding sites model. The third and higher order terms are also negligible because protein-DNA recognition dominates protein-protein recognition for a regulatory protein (i.e. if this would not be true, we would expect that protein polymerization along the DNA would dominate DNA recognition and, therefore, interfere with the regulatory function).
To solve the problem of the unknown parameters, we propose a different ranking strategy. Intuitively, the most straightforward approach would be to increase the protein concentration starting from zero and to see which sites are bound first. Therefore, instead of ranking genes based on  given a fixed protein concentration, we fix
  to a threshold probability of 50% and rank genes based on the corresponding protein concentration. This seems biologically more relevant, since it tells us in which order proteins are switched on or off:
  means that the gene should be in the middle between the on and the off state. Filling in
  in Equation (9) yields a threshold in terms of
  :
:  . If we denote the sum
  by
by  and
and 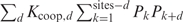 by
by  , we can write
  as
as
| 12 |
and, therefore, genes will be ranked based on
| 13 |
or
| 14 |
when  . The last equation is applied in our multiple binding sites model. Note that the rank order obtained by both equations does not depend on the exact value of Z, or the fact that the Pi's are determined up to a constant factor: when
  is scaled by a factor c,
  is scaled by c2 and
  by 1/c.
RESULTS AND DISCUSSION
To compare different prediction methods, we performed a case study on the Fur in P. aeruginosa. We tested the single binding site model, the multiple binding sites model and the homotypic cooperative binding model for several PWM's;. Moreover, we also evaluated the online available prediction methods PredictRegulon (8), Cluster Buster (4) and MSCAN (5). We could not make a comparison with the method of Liu and Clarke (2) or Granek and Clarke (3) since there are no data available on protein concentrations or the partition function.
The Fur protein
Fur is a conserved bacterial protein responsible for metal-dependent repression at the basis of the control exerted by iron on Fe-responsive genes. It is mainly studied in the human pathogen P. aeruginosa because the lack of this metal is a major environmental signal to trigger expression of important virulence factors (9).
The hypothetical Fur–DNA interaction model used in this article is shown in Figure 1. In this model, each monomer recognizes the same consensus sequence GATAATGAT(T/A). A second dimer can bind cooperatively 6 bp upstream or downstream from the first one (10), meaning that  can be neglected for every value of d except for d = 6.
Figure 1.

The Fur–DNA interaction model. This is the 3D structure of Pohl et al. (10) for the interaction between 1 Fur dimer and the DNA. We fitted the palindromic 19-bp consensus sequence GATAATGATAATCATTATC onto it in such a way that each monomer recognizes the same sequence GATAATGAT(T/A).
Ranking genes
To rank the genes with the different methods, we used the 25 SELEX sites found by Ochsner and Vasil (11) as a set of aligned sequences and included their complements as Fur is a homodimer. The −200 to 0 region was chosen as the putative promoter.
We studied three different PWM's;: one obtained with the method developed by Djordjevic et al. (6); another for which the Pi's are maximum likelihood (ML) estimates as given in Equation (6); and also one in which Pi's are posterior mean estimates (PME's;) derived from a uniform prior [these terms are explained in reference (12)]:
| 15 |
In this equation,  represents the number of cycles in the SELEX experiment, which is equal to 5 in this case (11), and n(b, j) is the number of times base b is observed at position j in the SELEX sites and their complements, divided by two.
Based on the ML and PME PWM's;, we scored each gene in the PA01 annotation table (13) using the single binding site model, the multiple binding sites model and homotypic cooperative binding model. The PWM of Djordjevic et al. (6) was only considered in combination with the single binding site model since it is determined up to an unknown constant factor μ, whereon the multiple binding sites and cooperative binding performances are strongly dependent.
We also tested three online available methods: PredictRegulon (8), Cluster Buster (4) and MSCAN (5). PredictRegulon uses a single binding site model with a different PWM, while the other two methods are based on statistical, instead of biophysical, multiple binding sites models. We set the model parameters equal to their default values, except for the minimum number of hits for MSCAN, which was chosen equal to 1.
Validation
We evaluated the different methods by means of the microarray analyses of Ochsner et al. (14) and Palma et al. (15). In the experiment of Ochsner et al. duplicate cultures were grown to stationary phase under iron-limiting or iron-replete conditions, while Palma et al. studied the early transcriptional response of exponentially growing Pseudomonas aeruginosa to iron. The differentially expressed genes are shown in the online supporting material.
Since Fur controls several other regulators, including the pyoverdine siderophore biosynthesis sigma factor PvdS (14), a certain number of iron-regulated genes will be regulated by Fur in an indirect way and no Fur-box will be found in the neighborhood of their promoters. As a consequence, only the high-scoring differentially expressed genes will be directly Fur-regulated and can be used as a true positive set; and reliable performance assessment can only be obtained for high-scoring genes. Therefore, unlike Granek and Clarke (3), we do not use ROC curves to evaluate our method, but we determine the number of true positives TP versus the number false positives FP for a limited number of false positives and evaluate the area under this curve. The higher this area, the better the method.
In Figure 2, the TP versus FP curves are plotted for PredictRegulon, Cluster Buster, MSCAN, the single binding site model that uses the PWM derived by Djordjevic et al. and the homotypic cooperative binding model for the PME PWM. The binding constant in the cooperative model was chosen as  with
with  kcal/mol; this choice will be explained later. Table 1 shows the areas under the FP versus TP curves with
  for all the different methods.
Figure 2.

Performance of the different methods. The TP versus FP curves are plotted for PredictRegulon, Cluster Buster, MSCAN, the single binding site model that uses the PWM derived by Djordjevic et al. and the homotypic cooperative binding model for the PME PWM with  kcal/mol.
Table 1.
Performances of the different models and PWM's;
| single binding site | multiple binding site | cooperative binding | |
|---|---|---|---|
| Djordjevic et al. | 45 | ||
| ML | 44 | 42 | 86 |
| PME | 46 | 46 | 91 |
| PredictRegulon | 57 | ||
| Cluster Buster | 48 | ||
| MSCAN | 44 |
The displayed numbers represent the areas under the FP versus TP curves for FP > 5.
Apparently, the performances of the single binding site and multiple binding sites models are comparable, while the cooperative binding model outperforms all the other methods as it concentrates more true positives at the beginning of the ranking. The corresponding gene ranking for the PME PWM can be found in the online supporting material. In fact, it is not surprising that the performances of the single binding site models and the biophysical multiple binding sites models are not significantly different. Binding energies for the best binding sites typically differ by several kJ/mol [i.e. the energy related to a non-covalent bond (16)]; and binding probabilities differ by a factor that depends exponentially on the difference in binding energy. Thus, without cooperative interactions, the binding probabilities at different binding sites typically differ by several orders of magnitude, and most of them are negligible, therefore.
Figure 3 shows the performance of the cooperative binding model for several values of  within a realistic range. The area under the FP versus TP curve is plotted for
  and
and  to make sure that the trend does not depend too much on the considered number of false positives. From this figure, it can immediately be seen that the cooperative binding model explains the microarray data better than the multiple binding sites model: the curves reach a minimum for
  . Furthermore, the trend corresponds well to our expectations. As long as the estimated
  is smaller than the true value, we expect that the performance of the method increases with
  . When the
  becomes greater than the true value, we anticipate that the performance saturates because a sequence of twice the binding site length does not occur by chance; otherwise the performance would decrease. Only when
  exceeds the binding energy of a single protein by a few orders of magnitude, the proteins will not be able to discriminate sites in the DNA well anymore since protein–protein recognition will dominate protein–DNA recognition. This results in a performance drop at
 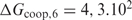 kcal/mol (this is not shown in Figure 3 for scaling reasons).
Figure 3.

Performance of the cooperative binding model as a function ΔGcoop,6. The area under the TP versus FP curve is shown as a function ofΔGcoop,6 for FP < 5 and FP < 10.
We chose  kcal previously because the performance saturates from this value on, and, therefore, we expect that it will be close to the true value. However, in the case of Fur, our method would perform just as well if we overestimated
  . Nevertheless, appropriate estimates should be provided in situations where several distances are important.
Extensions to more advanced binding models
Our method can be extended to heterotypic cooperatively binding proteins and pre-bound complexes with a flexible multimerization domain. In the first case, the order in which genes are up- or down-regulated depends on which protein concentration is varied and the concentrations of the proteins that bind cooperativily. Assume that the concentration of  changes under the considered conditions, and that the concentrations of the cooperatively binding proteins
  approximately remain the same (this assumption is equivalent to the assumption of Granek and Clarke where
  is the crucial protein). If
  ,
,  will first bind promoters that contain a binding site for
  and vice versa. Note that this kind of regulatory mechanism may especially be important in eukaryotes where the same regulators have to switch on different sets of genes in different cell types.
To illustrate how the extension for heterotypic cooperatively binding proteins can be obtained, we consider the case of two cooperatively binding proteins  and
and  and derive the probability
  that at least one of the sites is occupied by protein
  . Again we find Equation (9) but now with
| 16 |
where  represents the concentration of the considered promoter with
  bound at position i and
  bound at position j. We neglected second and higher order terms in the same way as under Equation (11). After expressing Equation (16) in terms of binding constants, and following an analogous reasoning as between Equations (10) and (13), the rank order of the genes can be obtained by
| 17 |
The subscripts correspond to the protein number, and  with Px, i the Pi for protein
  . Equation (17) can be interpreted as follows: when the concentration of protein
  is very low, the second terms in the numerator and in the denominator vanish, yielding the multiple binding sites model for
  as in Equation (14). In the opposite case, Equation (17) reduces to
| 18 |
which means that  only binds if it can bind in a cooperative way. For values of
  between these two extremes,
  serves as a weight factor in both the numerator and the denominator.
Before Equation (17) can be applied, we should first calculate the constant factors in the Px,i's and determine one additional parameter compared with the case of homotypic cooperative binding:  . In general, if there are more proteins involved in cooperative binding, one additional parameter
  is required per added protein
  . The partition function Zx can be determined by measuring the binding constant for one specific binding site and using Equation (5). The protein concentration
  can be estimated based on the measurements of the average number of proteins per cell volume
  and the average cell volume V:
| 19 |
with  the binding probability of
  at site
  . If
. If  can only bind cooperatively with
  and if
  does not change with
  ,
,  will be determined by Equation (3). The second condition means that
  , which will generally be fulfilled for the concentrations found for the top-ranked genes; otherwise,
  would hardly influence the binding of
  . Hence,
  can be assumed to be constant, and
| 20 |
If  can also bind cooperatively with other proteins than
  , a complete system of equations will be obtained. The solution can be found by an iterative algorithm.
Cooperative binding does not always have to deal with individual proteins that interact cooperatively upon DNA binding. It is also possible that proteins form pre-bound complexes and that a flexible multimerization domain allows for multiple distances between the binding sites of the individual proteins. To deal with such situations, we need a PWM and a relative binding constant  for each possible distance d. Then, we can determine Pi's for each PWM and scale them properly to make sure that the Pi's for the different distances will be determined up to the same constant factor.
CONCLUSION
We have introduced a new scoring method that utilizes the underlying physical binding model of protein–DNA and protein–protein recognition. This method requires a minimum number of physical parameters and detects cis-regulatory modules in almost the same way as they are recognized by the proteins. The more the parameters approach their true values, the more the detection method reflects physical reality. Therefore, a better performance can be obtained if the parameters are estimated or measured with a higher precision. The reliability of a prediction and the influence of each parameter on the performance can be estimated by testing several values of the parameters within a realistic range. For example, a certain distance of d basepairs may never occur between two important binding sites, and, therefore, the corresponding cooperative binding constant will not affect performance.
To obtain highly accurate predictions, we suggest that cooperative binding constants should be measured for relevant distances, as well as protein concentrations and partition functions in the case of heterotypic cooperative binding. Binding constants and partition functions can be derived from electrophoretic mobility shift analyses, and protein concentrations can be determined by measuring the mean number of proteins per cell volume and the mean cell volume. Furthermore, these measurements can provide clear insight into how binding energies and distances are related to gene regulation, and will allow further validation and development of biophysical prediction methods.
Supplementary Material
ACKNOWLEDGEMENTS
B.D.M is a full professor at the Katholieke Universiteit Leuven, Belgium. Y.M. is a professor at the Katholieke Universiteit Leuven, Belgium. P.C. is a professor at the Vrije Universiteit Brussel, Belgium. Research supported by: * Research Council KUL: GOA AMBioRICS, CoE EF/05/007 SymBioSys, several PhD/postdoc & fellow grants; * Flemish Government: – FWO: PhD/postdoc grants, projects G.0241.04 (Functional Genomics), G.0499.04 (Statistics), G.0232.05 (Cardiovascular), G.0318.05 (subfunctionalization), G.0553.06 (VitamineD), G.0302.07 (SVM/Kernel), research communities (ICCoS, ANMMM, MLDM); – IWT: PhD Grants, GBOU-McKnow-E (Knowledge management algorithms), GBOU-ANA (biosensors), TAD-BioScope-IT, Silicos; SBO-BioFrame; * Belgian Federal Science Policy Office: IUAP P6/25 (BioMaGNet, Bioinformatics and Modeling: from Genomes to Networks, 2007–2011); * EU-RTD: ERNSI: European Research Network on System Identification; FP6-NoE Biopattern; FP6-IP e-Tumours, FP6-MC-EST Bioptrain, FP6-STREP Strokemap.
Conflict of interest statement. None declared.
REFERENCES
- 1.Stormo GD, Fields DS. Specificity, free energy and information content in protein-dna interactions. TIBS. 1998;23:109–113. doi: 10.1016/s0968-0004(98)01187-6. [DOI] [PubMed] [Google Scholar]
- 2.Liu X, Clarke ND. Rationalization of gene regulation by a eukaryotic transcription factor: Calculation of regulatory region occupancy from predicted binding affinities. J. Mol. Biol. 2002;323:1–8. doi: 10.1016/s0022-2836(02)00894-x. [DOI] [PubMed] [Google Scholar]
- 3.Granek JA, Clarke ND. Explicit equilibrium modeling of transcription-factor binding and gene regulation. Genome Biol. 2005;6:R87. doi: 10.1186/gb-2005-6-10-r87. [DOI] [PMC free article] [PubMed] [Google Scholar]
- 4.Frith MC, Li MC, Weng Z. Cluster-buster: Finding dense clusters of motifs in dna sequences. Nucleic Acids Res. 2003;31:3666–3668. doi: 10.1093/nar/gkg540. [DOI] [PMC free article] [PubMed] [Google Scholar]
- 5.Alkema WB, Johansson O, Lagergren J, Wasserman WW. Mscan: Identification of functional clusters of transcription factor binding sites. Nucleic Acids Res. 2004;32:W195–W198. doi: 10.1093/nar/gkh387. [DOI] [PMC free article] [PubMed] [Google Scholar]
- 6.Djordjevic M, Sengupta AM, Shraiman BI. A biophysical approach to transcription factor binding site discovery. Genome Res. 2003;13:2381–2390. doi: 10.1101/gr.1271603. [DOI] [PMC free article] [PubMed] [Google Scholar]
- 7.Benos PV, Lapedes AS, Stormo GD. Is there a code for protein-DNA recognition? probab(ilistical)ly. BioEssays. 2002;24:466–475. doi: 10.1002/bies.10073. [DOI] [PubMed] [Google Scholar]
- 8.Yellaboina S, Seshadri J, Kumar MS, Ranjan A. Predictregulon: A web server for the prediction of the regulatory protein binding sites and operons in prokaryote genomes. Nucleic Acids Res. 2004;32:W318–W320. doi: 10.1093/nar/gkh364. [DOI] [PMC free article] [PubMed] [Google Scholar]
- 9.Escolar L, Perez-Martin J, De Lorenzo V. Opening the iron box: Transcriptional metalloregulation by the fur protein. J. Bacteriol. 1999;181:6223–6229. doi: 10.1128/jb.181.20.6223-6229.1999. [DOI] [PMC free article] [PubMed] [Google Scholar]
- 10.Pohl E, Haller JC, Mijovilovich A, Meyer-Klaucke W, Garman E, L VM. Architecture of a protein central to iron homeostasis: Crystal structure and spectroscopic analysis of the ferric uptake regulator. Mol. Microbiol. 2003;47:903–915. doi: 10.1046/j.1365-2958.2003.03337.x. [DOI] [PubMed] [Google Scholar]
- 11.Ochsner UA, Vasil ML. Gene repression by the ferric uptake regulator in Pseudomonas aeruginosa: Cycle selection of iron-regulated genes. Proc. Natl Acad. Sci. USA. 1996;93:4409–4414. doi: 10.1073/pnas.93.9.4409. [DOI] [PMC free article] [PubMed] [Google Scholar]
- 12.Durbin R, Eddy S, Krogh A, Mitchison G. Biological Sequence Analysis. Cambridge: Cambridge University Press; 2001. [Google Scholar]
- 13.Winsor GL, Lo R, Sui SJ, Ung KS, Huang S, Cheng D, K CW, Hancock RE, Brinkman FS. Pseudomonas aeruginosa genome database and pseudocap: Facilitating community-based, continually updated, genome annotation. Nucleic Acids Res. 2005;33:D338–D343. doi: 10.1093/nar/gki047. [DOI] [PMC free article] [PubMed] [Google Scholar]
- 14.Ochsner UA, Wilderman PJ, Vasil AI, Vasil ML. Genechip expression analysis of the iron starvation response in Pseudomonas aeruginosa: Identification of novel pyoverdine biosynthesis genes. Mol. Microbiol. 2002;45:1277–1287. doi: 10.1046/j.1365-2958.2002.03084.x. [DOI] [PubMed] [Google Scholar]
- 15.Palma M, Worgall S, Quadri LEN. Transcriptome analysis of the Pseudomonas aeruginosa response to iron. Arch. Microbiol. 2003;180:374–379. doi: 10.1007/s00203-003-0602-z. [DOI] [PubMed] [Google Scholar]
- 16.Berg JM, Tymoczko JL, Stryer L. Biochemistry. New York: W.H. Freeman and Company; 2001. [Google Scholar]
Associated Data
This section collects any data citations, data availability statements, or supplementary materials included in this article.