Abstract
In this second part of our study on the mechanism of perceived brightness, we explore the effects of manipulating three-dimensional geometry. The additional scenes portrayed here demonstrate that the same luminance profile can elicit different sensations of brightness as a function of how the objects in the scene are arranged in space. This further evidence confirms the implication of the scenes presented in the accompanying paper, namely that sensations of relative brightness—including standard demonstrations of simultaneous brightness contrast—cannot arise by computations of local contrast. The most plausible explanation of the full range of perceptual phenomena we have described is an empirical strategy that links the luminance profile in a visual stimulus with an association (the percept) that represents the profile’s most probable real-world source.
The cues about shadow and light in the accompanying paper (1) relied on implications about the illumination of a two-dimensional object (the surface of a card, or a billboard). Such depictions are limited by the fact that a variety of contrast relationships in the scene must be changed to achieve the desired graphical effects, albeit not in the immediate vicinity of the test diamonds. Thus, the regions depicted as being shadowed or lit in the scenes already presented required the introduction of large areas in which the gray scale values are altered (thus changing the “surrounds of the surrounds”), or, in the case of penumbras, changing the contrast boundary itself. We therefore devised another type of graphic in which the depiction of a three-dimensional object instead of a two-dimensional one allowed cues about illumination to be introduced with few, and ultimately no, changes in the configuration of the luminance profiles being compared.
EXPERIMENTAL PROCEDURES
The methods here are the same as those previously described (1). The dimensions and gray scale values in the additional scenes presented in this part of the study are given in Fig. 1.
Figure 1.
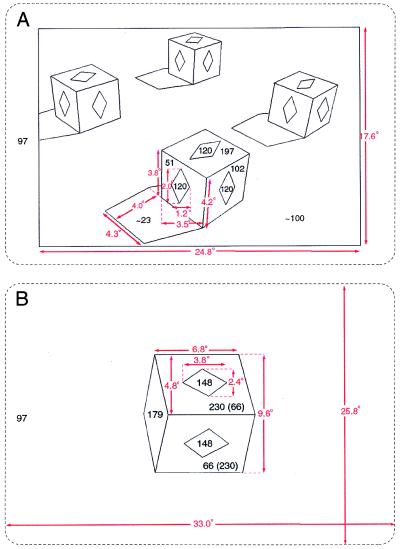
The dimensions (in degrees) of the various elements and their respective gray scale values (0–255) in the three-dimensional scenes presented in this component of the study. (A) Cube scene (see Fig. 2). (B) Rotated cube scene (see Fig. 3).
RESULTS
Use of Three-Dimensional Geometry To Alter Apparent Illumination.
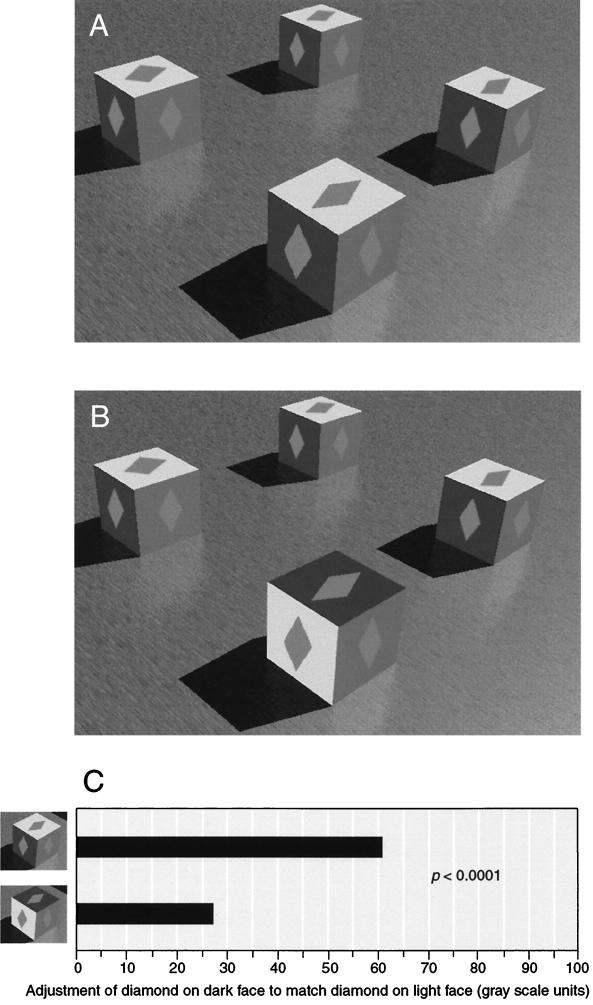
Fig. 2 presents the test diamonds and their surrounds on the faces of cubes depicted as being illuminated from a source at the upper right. As in the card and billboard figures, marked differences in the apparent brightness of the test diamonds are elicited by this alternative means of indicating whether a test diamond and its surround lie in light or shadow (compare the appearance of the test diamond on the cube in the foregrounds in Fig. 2 A and B). The average difference in perceived brightness of the diamonds when the dark surround and its diamond were depicted in shadow and the light surround in light (Fig. 2A) compared with the reversed depiction (Fig. 2B) was 124% (Fig. 2C). The only change used to elicit this marked difference in the perceived brightness of the equiluminant test diamonds is switching the position of the relevant faces of the cube from an apparently lighted region of the scene to a region in apparent shadow.
Figure 2.
Differences in apparent brightness elicited by cues about shadow and light in three dimensions. (A) Scene in which a three-dimensional design and rendering program was used to create the impression of illumination coming from the upper right. Subjects were asked to match the brightness of the two diamonds on the cube in the foreground, as in the previous tests. (B) The scene is identical to A, except the surrounds on the cube in the foreground have been switched so that the light surround is now on the side of the cube depicted as lying in shadow whereas the dark surround is on the illuminated top face. (C) Graph showing average adjustments made by eight subjects to equalize the brightness of the two test diamonds in each panel. These effects on the apparent brightness of the test diamonds are considerably greater than the effects elicited by the depiction of illumination in the card scenes in the accompanying paper. The reason is presumably that, whereas the effects of added shadow or light in the accompanying paper were determined in relation to an evenly illuminated scene, the effect in Fig. 2A is compared with a scene in Fig. 2B in which the light surround has been moved to a region of depicted shadow, and the dark surround has been moved to a region of depicted light. The appearance of the surfaces of the cube in Fig. 2B no longer accords with the cues about light and shadow, thus diminishing rather than enhancing the apparent difference in brightness between the test diamonds (see Fig. 5 in the accompanying paper).
Change in Perceived Brightness of Test Patches When Altered Direction of Illumination Is Only Implied.
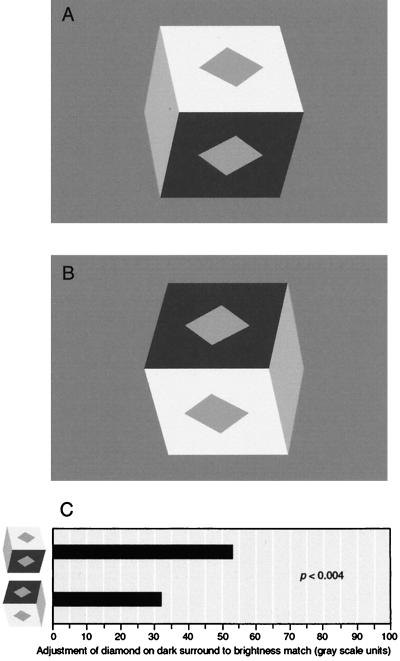
Despite this demonstration, it might be argued that the perceptual differences measured in Fig. 2C are still related to contrast differences that, in this case, arise from repositioning the light surround in Fig. 2A next to the shadow of the cube in Fig. 2B (and vice versa). To counter this objection, we devised yet another graphic that avoids this problem. In Fig. 3, the direction of the illumination is not specified by shadowing, as it is in Fig. 2. Rather, the graphic takes advantage of the fact that, because illumination from the sun or other sources is usually from above, observers assume a superior light source in the absence of other cues (see, for example, ref. 2). In this depiction, the two stimuli differ only in their orientation (compare Fig. 3 A and B). Even in this presentation, the average perceived difference in brightness elicited by the two equiluminant test patches was 65% (Fig. 3C). A large difference in perceived brightness elicited by exactly the same luminance profile in distinct orientations has, to our knowledge, not been described.
Figure 3.
Differences in apparent brightness elicited in the absence of any luminance changes in the scene. (A) Light and dark surrounds with equiluminant test diamonds drawn on adjacent faces of a cube. (B) The same scene rotated 180°. (C) Graph showing average adjustments made by the eight subjects to equalize the brightness of the two test diamonds in each panel. The reason for the relative reduction in the effect compared with Fig. 2 is presumably that the paucity of cues in this figure introduces a measure of uncertainty about the illumination of the scene (see Discussion). Indeed, a remarkable feature of the results throughout the study is how a variety of cues about illumination work together to influence the ultimate brightness of the test diamonds.
DISCUSSION
The results summarized in Tables 1 and 2 show that the apparent brightness of equiluminant test objects varies greatly as a function of how their illumination is portrayed. The absence of differences in local contrast in the graphics we used, culminating with the remarkable demonstration in Fig. 3, makes it difficult to rationalize these perceptual phenomena in terms of the opposing center-surround organization of the receptive fields of retinal, thalamic, or primary visual cortical neurons. Our account of the results up to this point does not, however, indicate (i) how these perceptual phenomena are best explained; (ii) what their significance is for understanding textbook demonstrations of simultaneous brightness contrast (Fig. 4A, for example); or (iii) their implications for visual perception more generally. The remainder of the discussion is devoted to these issues.
Table 1.
Summary of the performances of each of the eight subjects on all of the different tasks in the study (this paper and accompanying paper)

| IMAGE | DP | MW | AM | Subject 1 | Subject 2 | Subject 3 | Subject 4 | Subject 5 |
|---|---|---|---|---|---|---|---|---|
| 75.3 ± 0.7 | 73.7 ± 1.1 | 79.5 ± 0.7 | 67.8 ± 3.8 | 35.7 ± 4.3 | 49.2 ± 2.1 | 49.5 ± 4.2 | 61.2 ± 2.2 | |
| 48.9 ± 2.3 | 65.4 ± 1.2 | 50.7 ± 2.7 | 41.4 ± 4.3 | 18.3 ± 1.8 | 38.7 ± 3.3 | 29.1 ± 4.0 | 54.3 ± 3.2 | |
| 58.8 ± 2.9 | 70.3 ± 1.1 | 77.4 ± 0.6 | 51.6 ± 5.6 | 22.2 ± 2.3 | 48.6 ± 2.4 | 34.2 ± 4.5 | 59.7 ± 1.8 | |
| 10.8 ± 0.7 | 11.1 ± 1.0 | 5.3 ± 0.5 | 14.9 ± 0.9 | 11.3 ± 2.0 | 13.7 ± 2.8 | 15.5 ± 1.2 | 18.2 ± 2.8 | |
| 20.9 ± 0.7 | 23.2 ± 1.3 | 17.0 ± 0.8 | 17.6 ± 0.8 | 16.7 ± 2.6 | 18.1 ± 2.4 | 18.1 ± 1.3 | 22.0 ± 2.1 | |
| 11.0 ± 0.9 | 11.6 ± 0.9 | 4.2 ± 0.5 | 13.2 ± 1.2 | 13.9 ± 2.1 | 13.3 ± 2.7 | 10.2 ± 1.6 | 18.6 ± 2.2 | |
| 57.0 ± 3.4 | 70.2 ± 0.7 | 66.0 ± 1.0 | 73.2 ± 4.5 | 60.0 ± 3.2 | 67.8 ± 3.4 | 52.2 ± 1.8 | 77.4 ± 0.6 | |
| 73.8 ± 1.5 | 75.6 ± 0.6 | 77.4 ± 0.6 | 80.4 ± 3.8 | 73.8 ± 2.2 | 78.0 ± 1.0 | 68.4 ± 4.0 | 79.8 ± 0.7 | |
| 84.6 ± 1.1 | 84.0 ± 1.0 | 89.4 ± 0.6 | 88.2 ± 2.0 | 78.0 ± 1.0 | 77.4 ± 1.5 | 73.8 ± 1.5 | 81.6 ± 0.6 | |
| 65.4 ± 0.4 | 62.7 ± 0.3 | 67.8 ± 0.7 | 50.4 ± 2.9 | 60.3 ± 3.3 | 69.6 ± 2.9 | 56.1 ± 2.2 | 53.7 ± 1.4 | |
| 28.9 ± 2.3 | 40.8 ± 1.3 | 24.6 ± 5.8 | 18.3 ± 2.5 | 19.2 ± 2.4 | 26.7 ± 2.9 | 21.0 ± 2.9 | 36.9 ± 2.0 | |
| 54.6 ± 3.1 | 69.9 ± 1.4 | 72.0 ± 0.9 | 33.9 ± 2.8 | 28.5 ± 2.8 | 64.8 ± 1.7 | 37.2 ± 3.0 | 60.6 ± 1.7 | |
| 18.5 ± 10.9 | 53.3 ± 2.3 | 33.9 ± 1.1 | 25.5 ± 2.3 | 20.1 ± 2.5 | 32.5 ± 2.5 | 32.4 ± 3.2 | 42.0 ± 3.4 | |
Mean responses ± SEM are shown in gray scale units. Paired t tests were used to evaluate the significance of the perceived differences in the brightness of the test diamonds. Interindividual performance differed substantially whereas intraindividual performance was remarkably consistent.
Table 2.
Mean values (±SEM in gray scale units) obtained for the indicated tasks by adjusting the diamond on dark surround to match the diamond on the light surround (left column), compared to adjusting the diamond on the light surround to match the diamond on the dark surround (right column)

| IMAGE | Mean adjustment of diamond on dark surround | Mean adjustment of diamond on light surround |
|---|---|---|
| 61.3 ± 5.9 | 54.9 ± 4.0 | |
| 43.4 ± 5.9 | 42.8 ± 4.7 | |
| 52.6 ± 6.9 | 49.4 ± 5.2 | |
| 12.6 ± 4.5 | 8.3 ± 4.1 | |
| 19.2 ± 3.3 | 15.4 ± 3.2 | |
| 12.0 ± 2.6 | 8.8 ± 2.5 | |
| 65.5 ± 3.0 | 59.8 ± 4.9 | |
| 75.9 ± 1.4 | 73.8 ± 4.2 | |
| 82.1 ± 1.9 | 81.2 ± 3.7 | |
| 60.8 ± 3.2 | 66.4 ± 7.2 | |
| 27.1 ± 4.2 | 26.3 ± 5.8 | |
| 52.7 ± 6.2 | 47.3 ± 5.5 | |
| 32.0 ± 6.1 | 36.9 ± 4.7 | |
The results of these two procedures were in all cases similar. In control trials between these tasks, subjects were asked to adjust the diamonds in each of the scenes in the absence of any context. The result (not shown) indicated that subjects were able to do this with great accuracy (±3 gray scale units) and that their performance was consistent over the testing period.
Figure 4.
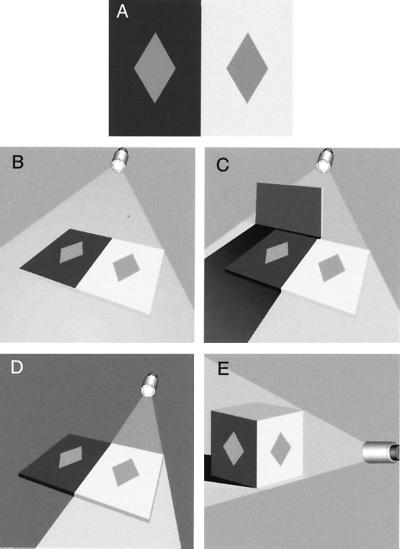
Cartoon illustrating the standard illusion of simultaneous brightness contrast (A) and some of its possible real-world sources (B–E).
An Explanation Based on the Statistics of Visual Experience.
If lateral interactions among lower order visual neurons cannot easily account for these effects, what, then, does? The alternative explanation implied by the perceptual phenomena we report is that the relative brightnesses of the elements in a visual stimulus are empirical associations elicited by the full gamut of luminance relationships in the scene. In this conception, it is not local contrast that causes differences in the brightness of the test patches, but what the test patch luminance in the context of the luminances in the rest of the scene has most often signified. For example, if two objects return the same amount of light to the eye when one is in shadow and the other is not (see Fig. 4C), the one in shadow will, empirically, always have returned more light to the eye when the objects are viewed together in the same illumination. If these percepts are generated as associations elicited by the statistical implications of the luminance profiles in visual stimuli, then this fact about luminance relationships will bias what is seen, causing the test patch in shadow to look brighter than the test patch that is unshadowed. Similarly, an object lying in a region of local illumination (see Fig. 4D) always will have returned less light to the eye when compared with an equiluminant object that is not locally lit. By the same argument, the test patch in light will tend to look dimmer than the test patch not within the region of local illumination.
Explanation of the Standard Simultaneous Brightness Contrast Illusion.
How, then, can such reasoning account for the perceptions elicited by the standard presentation of simultaneous brightness contrast, in which two equiluminant test objects are presented on different backgrounds in the absence of any obvious scene or cues that convey information about illumination (see Fig. 4A)? The explanation we propose, as in the argument put forward to explain the effects of depicted shadow and light, is predicated on the statistical significance of the luminance profiles involved. In the absence of more specific cues, the “scene” in the standard presentation of the simultaneous brightness contrast illusion could represent any of the possibilities illustrated in Fig. 4B–E (i.e., an evenly illuminated two-dimensional object with different surface properties, as in Fig. 4B; a surface on which the dark portion is generated by a shadow, as in Fig. 4C; a surface on which the light region is generated by local illumination, as in Fig. 4D; or the additional possibilities that would arise from the three-dimensionality of objects, as in Fig. 4E). The stimulus in Fig. 4A also could represent a scene in which the lighter surround actually lies in shadow or in which the dark surface lies in local illumination (see Figs. 4 and 5 in the accompanying paper). In short, this stimulus is deeply ambiguous with respect to the meaning of the luminances portrayed.
Figure 5.
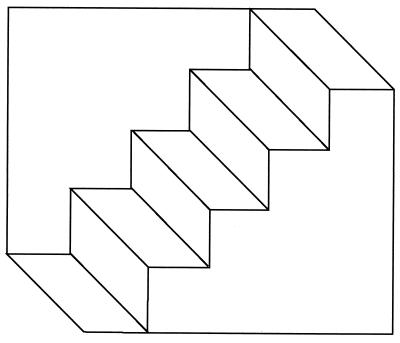
Ambiguous geometrical stimulus that illustrates the importance of probability in the perception of form (the Schroeder stair). See text for explanation. This particular example implies the preeminence of individual learning in eliciting visual associations; in fact, we make no judgment about the relative importance of ontogenetic versus phylogenetic contributions to this process.
An expedient—and perhaps the only—way to cope with this ambiguity (which is, to a greater or lesser degree, present in all of the graphics we have used, and indeed in all scenes) would be to generate the perception of Fig. 4A empirically, based on what a particular luminance profile most often has signified. To our knowledge, statistical information about the meanings of luminance profiles in representative visual scenes has not been determined. Despite this ignorance, it is certain that the dark and light surrounds in Fig. 4A will not have always represented a surface reflectance boundary in an evenly illuminated scene (e.g., Fig. 4B), the only circumstance in which the equiluminant test diamonds actually would represent equiluminant objects. On the contrary, as indicated in Fig. 4, the stimulus often will have arisen from one of a variety of other possibilities generated by shadow, light, the configuration of objects in the third dimension, and other factors not considered here (such as inherent luminosity). We therefore suggest that the stimulus in Fig. 4A is seen not as the luminance profile that it actually represents but as an association determined both by learning and whatever phylogenetic biases have been built into the visual system by the experience of the species. Regarded in this way, the brightness relationships seen in Fig. 4A are no more nor less illusory than the perception of the other stimuli in Fig. 4 or indeed of any visual stimulus.
Broader Significance of an Empirical Basis for Perception.
The statistical strategy that we propose to account for the perception of relative brightness is arguably similar to the strategy for perceiving at least some other aspects of visual stimuli. For example, minimal cues about the form of ambiguous objects have long been known to compel the perception of particular spatial relationships (reviewed in ref. 2). Thus, Fig. 5 shows a stimulus that is seen as a stair by most observers. In fact, the diagram (the so-called Schroeder stair) equally well represents an overhanging cornice, as can be seen by turning the figure upside down. Observers presumably see a stair rather than a cornice because this set of lines and angles has signified a stair much more often than a descending overhang. The association elicited by the stimulus therefore is biased heavily toward a stair by the statistics of what the stimulus usually has meant.
The plausibility of this parallel explanation of illusions concerning two different visual qualities—brightness and form—raises the possibility that the visual system generally is organized to elaborate percepts on a statistical basis rather than by computations that directly inform us about the properties of a visual stimulus.
CONCLUSIONS
The idea that experience can affect visual perception is, of course, not new. The most notable proponent of this theme has been Helmholtz, who argued persuasively in the 19th century that many aspects of what we see are influenced by what he called “unconscious inference” (3). With respect to brightness perception, his ideas are described in volume II of his monograph on vision (ref. 2, pp. 264–300). In this century, further experiments on the influence of experience on the perception of brightness have been reviewed thoroughly by Evans (4), Beck (5), and Hurvich (6). The upshot of this work has been the view that perception is “a prologue to learning,” providing a “representation” that subsequently allows “inferences about associations” to be made (7). Neither Helmholtz nor his successors suggested that the phenomenology of simultaneous brightness contrast points to a more fundamental strategy in visual perception, namely to have visual stimuli elicit in a probabilistic manner associations that are themselves the percepts we experience.
The “errors” in the perception of brightness that arise in the exercise of this probabilistic process are counterbalanced by the enormous value of this strategy of perception. Thus, a scheme of perception based on empirically determined probabilities insures that a given stimulus always elicits a pattern of neural activity (the percept) that represents the most frequently encountered real-world source of the stimulus. In the face of the many uncertainties that the visual world routinely presents, this statistical mechanism may be the best way to disambiguate scenes and thus to guarantee appropriate behavior (which provides the feedback that motivates this process). Although an observer perceiving luminance or other visual relationships on this basis only rarely will see objects that precisely accord with the measured values of the stimulus, the “misperceptions” that ensue are trivial compared with the benefit of always seeing visual stimuli as the scenes they are most likely to represent.
Acknowledgments
We are grateful to Tim Andrews, David Coppola, David Fitzpatrick, Beau Lotto, Tom Polger, Len White, and Oren Yishai for helpful criticisms. This work was supported by National Institutes of Health Grant NS29187.
References
- 1. Williams S M, McCoy A N, Purves D. Proc Natl Acad Sci USA. 1998;95:13296–13300. doi: 10.1073/pnas.95.22.13296. [DOI] [PMC free article] [PubMed] [Google Scholar]
- 2.Rock I. Perception. New York: Scientific American Library; 1995. [Google Scholar]
- 3.von Helmholtz H L F. Helmholtz’s Treatise on Physiological Optics. Hamburg, Germany: Verlag um Leopold Voss; 1911. ; transl. Southall, J. P. C. (1924) (George Banta, Menasha, WI), Vols. I—III (German). [Google Scholar]
- 4.Evans R M. An Introduction to Color. New York: John Wiley; 1948. [Google Scholar]
- 5.Beck J. Surface Color Perception. Ithaca: Cornell Univ. Press; 1972. [Google Scholar]
- 6.Hurvich L M. Color Vision. Sunderland, MA: Sinauer; 1981. [Google Scholar]
- 7.Barlow H. Vision Res. 1990;30:1561–1571. doi: 10.1016/0042-6989(90)90144-a. [DOI] [PubMed] [Google Scholar]


