

Abstract
The association of the TATA binding protein (TBP) to eukaryotic promoters is a possible rate-limiting step in gene expression. Slow promoter binding might be related to TBP’s ability to occlude its DNA binding domain through dimerization. Using a “pull-down” based assay, we find that TBP dimers dissociate slowly (t½ = 6–10 min), and thus present a formidable kinetic barrier to TATA binding. At 10 nM, TBP appears to exist as a mixed population of monomers and dimers. In this state, TATA binding displays burst kinetics that appears to reflect rapid binding of monomers and slow dissociation of dimers. The kinetics of the slow phase is in excellent agreement with direct measurements of the kinetics of dimer dissociation.
Keywords: TFIID, kinsim/protein/DNA interactions
The regulation of eukaryotic genes involves the binding of the TATA binding protein (TBP) to the −30 region of the gene’s promoter. TBP then coalesces the assembly of a transcription complex (1–3). Promoter binding of TBP appears to be slow and possibly rate-limiting in transcription (4–8). Not surprisingly, transcriptional activators stimulate the association of TBP to promoters; however, the mechanism by which activators recruit TBP is unknown. Understanding the mechanistic basis of the rate-limiting step in TBP/TATA association, therefore, is a critical prelude to understanding mechanistically how activators recruit TBP.
Both human and yeast TBP homodimerize in solution, whether in a pure system at low nanomolar concentrations, in a crude system when complexed with TAFIIs, or in vivo (refs. 9 and 10; A. Jackson-Fisher and B.F.P., unpublished data). The equilibrium dissociation constant for dimerization of human TBP is in the range of 4 nM, which is well below the estimated 1 μM concentration of TBP in the nucleus (9, 11). Fig. 1A illustrates a possible dimer arrangement of TBP as determined by x-ray crystallography (12, 13). The TBP dimer interface is located in the evolutionarily conserved 180 carboxyl-terminal amino acids, and by crystallographic and biochemical criteria appears to overlap its DNA binding surface (9, 12–19). Thus, dimerization competes with DNA binding.
Figure 1.
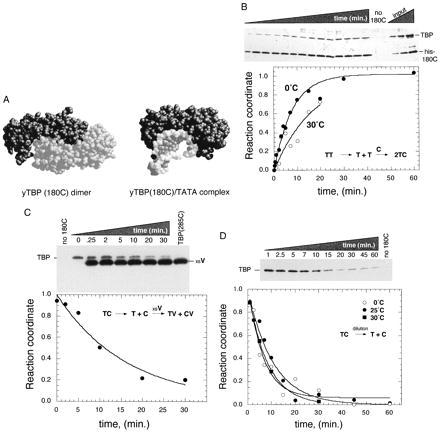
Kinetics of TBP dimer dissociation. (A) Space-filling representations, based upon crystal structure determinations, of the conserved core DNA binding domain of yeast TBP in the absence (Left) and presence (Right) of DNA (13, 14). (B) TBP subunit exchange as measured by the NAB assay (9). •, 1 μM TBP (T) and 2.5 μM his-180C (C) were mixed at 0°C. ○, 1 μM TBP and 0.25 μM his-180C were mixed at 30°C. At various times, samples were quenched and subjected to the NAB assay. A silver-stained gel of the raw 0°C data is shown above the graph of the quantitated data. His-180C was omitted from reactions indicated by “no 180C” (shown in duplicate). Increasing amounts of input proteins, which provide a standard for linearity of the signal, are shown as “input.” (C) TBP subunit exchange measured by dissociation of his-180C/TBP heterodimers. A total of 0.01 μM TBP and 0.25 μM his-180C was mixed and allowed to reach equilibrium at 0°C. A total of 10 μM TBP(285C), designated as “xsV,” was then added to initiate net dissociation of TBP from his-180C. At various times, samples were processed through the NAB assay. A TBP Western blot of the raw data is shown above the quantitation. His-180C was omitted from lanes designated “no 180C.” TBP(285C) was omitted from the 0 min. point. Because TBP(285C) was added at a 1,000-fold excess over TBP, a small but significant amount contaminates the washed resin. The his-180C signal is not shown. (D) Dissociation of his-180C/TBP heterodimers by dilution. TBP (0.025 μM) and his-180C (0.125 μM) were bound to nickel resin at 0°C, allowed to reach equilibrium, then diluted 300-fold into equivalent buffer at 0°C (○), 25°C (•), or 30°C (▪) to initiate net dissociation of TBP dimers. At various times, samples were processed through the NAB assay. A TBP Western blot of the raw data is shown above the quantitation for the 25°C data. Due to the low immunoreactivity of his-180C, its signal was detected at low levels only after extended exposure to film. In all cases, the recovery of his-180C on the resin was constant, indicating stable association of his-180C with the nickel resin (data not shown). In B–D, all TBP band intensities were within the linear range of quantitation.
TBP has been proposed to bind TATA in two steps (20). The first step is thought to involve a weak, unstable TBP/TATA complex, which rapidly preequilibrates with free monomeric TBP prior to a rate-limiting isomerization into a stable complex. The isomerization step may involve the large distortion of TATA DNA as observed in the crystal structure. However, recent studies suggest that this step is quite rapid (21, 22). The conclusions of these studies were based upon outcomes of experiments performed under pseudo-first order conditions of excess protein over DNA. Under such conditions, only a small portion of the entire protein population is monitored, but is assumed to reflect the entire population. If TBP is present as a mixed population of monomers and nonbinding dimers, then only monomer binding will be observed, and the observed bimolecular association rate constant represents an underestimate of its true value. Moreover, as demonstrated in this manuscript, experiments performed under conditions of excess protein cannot distinguish between reactions involving only monomeric TBP vs. reactions involving a mixed population of monomers and dimers. Only under conditions of excess DNA over protein, where the entire protein population is monitored, can kinetically distinct binding populations be distinguished. The evidence presented here suggests that under physiological conditions, TBP is largely present as a dimer. Dimers are kinetically slow to dissociate and thus represent a rate-limiting step in DNA binding.
MATERIALS AND METHODS
Proteins and DNA.
Recombinant his-180C was produced in Escherichia coli and purified to apparent homogeneity as described (9). Recombinant human TBP and TBP(285C) were purified from E. coli as described (9), except that the sonication and centrifugation steps prior to polyethylenimine precipitation were omitted. TBP purified in this manner was >95% active for TATA binding as determined in ref. 23, and >98% pure on silver-stained SDS/polyacrylamide gels. TBP concentrations were determined as described (9). TATA DNA (28 bp) contained the 8-bp adenovirus major late TATA box and was quantified as described (23).
Binding Conditions.
Except where noted, all TBP and DNA binding reactions contained 20 mM Tris-acetate (pH 7.5), 5% glycerol, 4 mM spermidine, 1 mM DTT, 75 mM potassium glutamate, 0.1 mM EDTA, 4 mM MgCl2, 13.6 μM (nucleotides) poly(dG-dC), 0.01% Nonidet P-40, and 5 μg/ml bovine serum albumin.
Nickel Agarose Binding (NAB) Assays.
The NAB assay was described (9) and contained the following modifications. Sample time points (20 μl) were incubated with ice-cold nickel-chelated Sepharose (10 μl) equilibrated with quench buffer (20 mM Tris-acetate, pH 7.5/20% glycerol/1 M KCl/4 mM MgCl2) and vortex mixed for 15 sec. The presence of high KCl concentrations dramatically slowed the dimer dissociation reaction, thereby minimizing subunit exchange during the work-up (9). The resin was collected by centrifugation and washed twice with 1.5 ml of quench buffer. Proteins were eluted from the drained resins in Laemmli protein sample buffer containing 0.5 M imidazole and electrophoresed on SDS/10% polyacrylamide gels. The binding and dilution reactions in Fig. 1 C and D contained 20 mM imidazole and lacked poly(dG-dC), spermidine, EDTA, and DTT.
Quantitation of Protein Binding.
Samples from the NAB assay were subjected to SDS/PAGE and either silver stained or subjected to ECL (Amersham) Western blot analysis. Increasing amounts of input were loaded to ensure linearity of the signals. Band intensities were quantitated by laser densitometry. The raw TBP signal (STBP) was normalized to recovery of his-180C (S180C) according to the equation S = (STBP − S0,TBP)/(S180C − S0, 180C), where S0,TBP and S0,180C correspond to the signals present at the corresponding positions on the gel when his-180C was omitted from the reaction. S was plotted as a function of time (t) and fit using kaleidagraph software to the equation S = ΔS(1 − e−kt) + Sbkd in Fig. 1B, and S = ΔS(e−kt) + Sbkd in Fig. 1 C and D. ΔS and Sbkd are variables evaluated by kaleidagraph and standard errors reported, and k is the observed first order rate constant for dimer dissociation. The data were translated into a reaction coordinate, which varied between 0 and 1 according to the equation: Reaction coordinate = (S − Sbkd)/ΔS.
TATA DNA Binding Assays.
TBP was incubated with 32P-end labeled TATA DNA for various periods of time and filtered over nitrocellulose using a 96-well dot blot apparatus as described (23). The radioactivity retained on the filter was quantitated by a PhosphorImager (Molecular Dynamics) and normalized to vary between 0 and 1 as described above for the NAB assay. From one set of experiments to another, the maximum retention of radioactivity (at the reaction endpoint) varied between 60 and 100% of the expected retention. This difference appeared to be related to variations in the lots of nitrocellulose. Retention of TATA DNA in the absence of TBP was ≈1–2% of the input. In the presence of TBP, no retention of a mutant TATA probe, above background, was observed, indicating that binding was specific.
RESULTS
NAB Assay.
To quantitatively measure the kinetics of TBP dimer dissociation, we have employed a NAB assay (9). TBP homodimers are mixed with polyhistidine-tagged homodimer derivatives. At various times, the extent of subunit exchange is assessed by rapidly (within 15 sec) pulling the tagged TBP out of solution with nickel agarose and measuring the co-retention of untagged TBP. To prevent TBP from exchanging during the 15-sec incubation with resin, and to minimize dissociation during subsequent wash steps, the dimer exchange reaction is quenched with ice-cold buffer containing 1 M KCl. Under these conditions exchange is very slow (t½ >20 min) (9).
Several features of this assay should be emphasized. First, if TBP is specifically retained on the resin, then the rate of dimer dissociation necessarily is slower than the rate of dimer formation with the tagged TBP. Therefore, the exchange kinetics are dominated by the rate of dimer dissociation. Second, the exchange reaction takes place in solution and not on the resin, and therefore is not affected by the resin or the quench. Third, because the quench effectively stops any further exchange, reaction time courses can be as short as sampling permits, despite the fact that resin incubation and subsequent work up can take as long as a minute.
Using the NAB assay, the equilibrium dissociation constant for human TBP dimers was previously found to be in the range of 4 nM, and thus represents a strong interaction (9). Our next objective was to compare the rate of dimer dissociation with the rate of TATA DNA binding. We chose solution conditions that were optimal for promoter-specific transcription, which includes incubations at 30°C. However, we and others have found that TBP is extremely temperature sensitive at 30°C, having a t½ of inactivation ranging from about 7 to 40 min depending on the TBP concentration and solution conditions (23–25). Therefore, we chose to perform a qualitative assessment at 30°C, and a quantitative assessment at 0°C where TBP is stable.
Rate of TBP Dimer Dissociation.
Typical human TBP dimer exchange reactions are shown in Fig. 1B. Untagged TBP is not retained on the resin in the absence of polyhistidine tagged TBP(180C), termed his-180C, indicating that retention is specific. In the presence of his-180C, increasing amounts of TBP were retained with time. At both 0°C and 30°C, subunit exchange was slow (t½ = 6 min; koff = 1.9 ± 0.2 × 10⁻³⋅sec−1 at 0°C), which is a direct reflection of the rate of dimer dissociation.
If dimers are slow to dissociate, then it follows that if his-180C/TBP heterodimers were allowed to form, then addition of excess amounts of a third untagged TBP derivative, TBP(285C), should result in a decay of the TBP signal with kinetics similar to the formation of the original heterodimer. As shown in Fig. 1C, TBP was lost with a t½ of 11 min, which is similar to that measured in Fig. 1B. That TBP and TBP(285C) compete for his-180C binding provides further support for the specificity of the reaction.
As a third method to verify the kinetics of dimer dissociation, resin-bound his-180C/TBP heterodimers were diluted 300-fold, at 0°C, 25°C, or 30°C, to a concentration well below the dimer KD. Sample time points were taken and analyzed for the amount of TBP retained on the resin (Fig. 1D). Net dissociation of TBP proceeded with kinetics (t½ = 7.4 min; koff = 1.6 ± 0.3 × 10⁻³⋅sec−1 at 25°C) similar to that obtained with the other two assays. Thus, by three different methods, TBP dimers appear to be kinetically slow (t½ = 6–10 min.) in dissociating.
TBP/TATA Association Displays Burst Kinetics.
To assess how the rate of dimer dissociation influences the kinetics of DNA binding, TATA DNA binding reactions were performed under pseudo-first order conditions of excess of [32P]TATA DNA, which allowed the binding of the entire TBP population to be monitored. TBP was preincubated at its final concentration (10 nM) to allow a new dimer–monomer equilibrium to be established and reactions initiated with addition of 50 nM TATA DNA. As shown in Fig. 2, a burst of binding was observed, which was followed by a slower binding phase. Similar results were obtained by mobility shift and DNase I footprinting assays (R.A.C., unpublished data).
Figure 2.
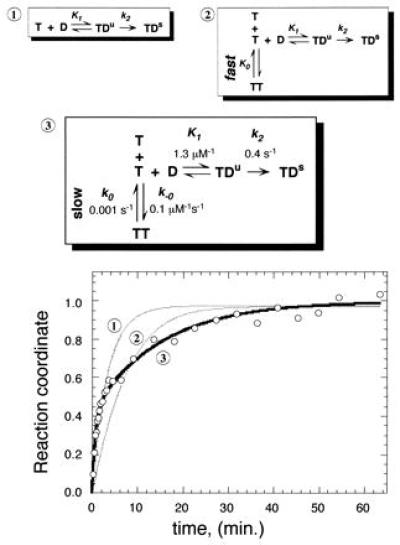
TBP/TATA association displays burst kinetics. Three possible mechanisms for the binding of TBP (T) to TATA (D) are shown. Mechanism 1 includes two steps as proposed by others (20, 21), in which an unstable TBP/TATA complex (TDu) isomerizes into a stable TDs complex. Mechanisms 2 and 3 include TBP dimerization (TT) as a competing reaction, in which dimers are either in rapid equilibrium with monomers (mechanism 2) or represent a kinetically significant step (mechanism 3). TBP was preincubated at 0°C for >60 min. at 10 nM. [32P]TATA DNA (28 bp and 50 nM) was added to initiate the binding time course. This TATA concentration is ≈100-fold higher than the KD for the TBP/TATA complex (23), and is therefore saturating. Data were normalized such that the reaction coordinate ranged from 0 to 1 as described in Materials and Methods. The data were fit to mechanisms 1, 2, and 3 as indicated on the graph using kinsim software (26). Rate constants for a fit to mechanism 3 are shown in the diagram of mechanism 3. The program did not provide error evaluations. Varying any of the kinetic rate constants by more than 10% yielded curves that provided a noticeably poorer fit of the data.
Using the kinetic simulator kinsim (26), attempts were made to fit the data to each of the three mechanisms shown in Fig. 2. Mechanism 1 assumes that TBP dimers do not appreciably exist, and that TBP monomers bind TATA DNA in two steps: a rapid preequilibrium governed by K1 and an isomerization step governed by k2, as proposed by others (20, 21). Mechanism 2 invokes TBP dimerization as a competing reaction but that dimers are in rapid equilibrium with monomers and governed by K0. Mechanism 3 also includes TBP dimerization as a competing reaction but in addition invokes dimer dissociation as a kinetically significant step. Only mechanism 3 provided a good fit to the data throughout its entire range. Thus, the data are most consistent with a mechanism in which TBP dimerization competes with DNA binding, and dimer dissociation represents a kinetically significant step.
Values for the kinetic parameters generated from a fit to mechanism 3 are also presented in Fig. 2. Strikingly, the fit yielded a rate of dimer dissociation (t½ = 11 min; koff = 1.0 × 10⁻³⋅sec−1) that was similar to that determined by the NAB assay. Moreover, the equilibrium dissociation constant (K0), which is manifested through the burst amplitude, was determined to be ≈10 nM, which is close to the 4 nM value previously reported using the NAB assay (9).
Use of Kinetic Simulations to Predict Outcomes.
Using kinsim, we performed a number of computer simulations to help design experiments that could further distinguish mechanisms 1, 2, and 3. Simulations revealed that kinetic profiles performed in the presence of excess TBP do not readily distinguish any of these mechanisms (demonstrated below). This might explain why previous kinetic studies performed with excess TBP had not found evidence for dimerization (20, 21). When TBP is in excess, only a small portion of the total TBP actually binds DNA. Thus, only the rapid binding of monomers would be detected.
A clear distinction between mechanism 3 and mechanisms 1 or 2 (which are not distinguishable) can be made by comparing kinetic profiles generated in the presence of excess TBP with those generated with excess TATA DNA. Simulations of mechanisms 1 and 3, at a fixed TBP concentration (100 nM) and variable TATA DNA concentrations (10, 25, 100, and 300 nM) are shown in the Fig. 3 Upper. As discussed above, when TBP is in excess, the kinetic profiles do not distinguish the mechanisms (compare the 10 and 25 nM curves in the two Upper panels). The major distinction comes when comparing excess TATA DNA (300 nM): mechanism 1 (and 2) predict that the 300 nM TATA DNA reaction will proceed the fastest and be monophasic, while mechanism 3 predicts that the reaction will proceed with a fast and slow phase. Consistent with mechanism 3, the experimental data in Fig. 3 yielded a biphasic fast/slow response at high DNA concentrations, and a fast monophasic response at low DNA concentrations.
Figure 3.
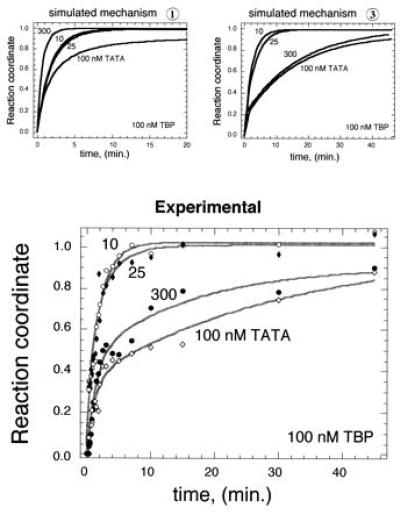
Experimental distinction between mechanisms 1 and 3. Using the rate constants determined in Fig. 2, kinsim was used to simulate binding according to either mechanism 1 or 3 at 100 nM TBP and 10, 25, 100, and 300 nM TATA DNA. Binding reactions were then performed and assayed as described in Fig. 2.
TBP Concentration Sets the Amplitude of the Burst Phase.
According to mechanism 3, when TBP is present at concentrations below, at, or well above the dimer equilibrium dissociation constant (1, 10, 2,000 nM) its gross kinetic profiles for TATA DNA binding should be fast and monophasic, biphasic, or slow and monophasic, respectively. Moreover, if TBP, which is at equilibrium at these three concentrations, is diluted to the same concentration (1 nM) and immediately allowed to bind DNA, it should retain the slow binding behavior of its prediluted state. As shown in Fig. 4, when TBP is preincubated at 1 nM, it displayed rapid monophasic binding. When preincubated at 10 nM, but assayed for binding at 1 nM, binding was biphasic. When preincubated at 2,000 nM, then assayed for binding at 1 nM, slow binding was observed. This is consistent with a slow conversion of predominantly dimers into monomers. Similar slow rates of binding were observed if both the TBP and TATA DNA final concentrations were elevated by up to a thousand fold, and if his-180C or yeast TBP were employed (R.A.C., unpublished data).
Figure 4.
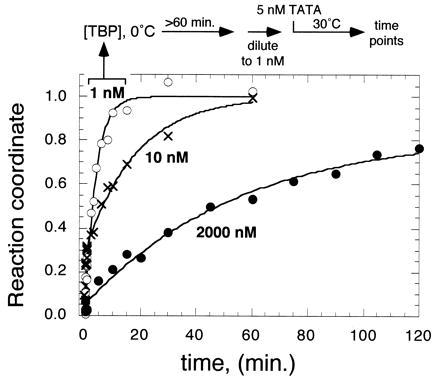
Concentration and preincubation effect on TBP/TATA binding. TBP (1, 10, or 2,000 nM, as indicated) was preincubated for at least 60 min at 0°C. Reactions were then diluted to 1 nM at 30°C, and binding was immediately initiated with the addition of 5 nM [32P]TATA DNA. Binding was assayed as described in Fig. 2.
DISCUSSION
The binding of TBP and/or TFIID to promoters is slow and possibly rate-limiting in transcription (4–8). Why is TBP so inefficient in promoter binding? TBP must kink the DNA or recognize transiently kinked DNA to stably bind to it, but this step is quite rapid (12, 14, 20, 21, 27). TBP might be bound to inhibitors such as Dr1, topoisomerase I, and Mot 1, which either inhibit TBP/TATA binding or its function (28–30). But TBP, whether alone or in a TFIID TBP/TAF complex, is intrinsically poor in TATA binding in the absence of these factors (ref. 5, and this study). Since, in yeast, transcriptional activation and presumably TBP recruitment can be achieved in the absence of factors tightly associated with TBP (31–33), the state of self-association of uncomplexed TBP is mechanistically relevant.
We have demonstrated that human or yeast TBP, whether alone, in context with TAFs, or in vivo, forms homodimers (refs. 9 and 10; A. Jackson-Fisher and B.F.P., unpublished data). TBP or TFIID dimerization competes with DNA binding and suggests that dimerization is a natural intrinsic mechanism for negatively autoregulating its DNA binding activity. The crystallographic structures of TBP dimers and TBP/TATA complexes provide a plausible mechanism for this competition (12–19), in which the concave saddle-shaped 180C domain either binds DNA or a second TBP molecule.
Here we present several lines of evidence which lead us to conclude that the rate at which TBP dimers dissociate dictates the kinetics of DNA binding. (i) The rate of TBP dimer dissociation was measured directly and found to be slow (t½ ≈ 10 min). (ii) In reactions containing a mixed population of monomers and dimers, TATA binding displayed burst kinetics in which we attribute the rapid phase to monomeric TBP and the slow phase to a slow dissociation of dimers. The kinetics of the slow phase was similar to the kinetics of TBP dimer dissociation, suggesting that the two are measuring the same phenomena. According to this interpretation, the amplitude of the burst phase is a measure of the initial monomer concentration. From this, an equilibrium dissociation constant of 10 nM was calculated for TBP dimers, which is in good agreement with our earlier measurements of ≈4 nM using a protein “pull-down” assay (9). The total nuclear TBP concentration is estimated to be in the range of 1 μM (11). (iii) As expected for a reaction limited by dimer dissociation, the slow binding kinetics to TATA was independent of DNA concentration as long as it was in excess over TBP. (iv) Preincubation of TBP at a concentration (1 nM) below its dimer equilibrium dissociation constant (K0), generates a rapid binding population of TBP that is presumed to be monomeric. Preincubation at a concentration (10 nM) near K0, generates a rapid and slow binding form, even when binding is examined at 1 nM. When preincubated at a concentration (2 μM) well above K0, then immediately assayed for binding at 1 nM (or at any other concentration), only the slow binding phase is observed, which we interpret to reflect dimers that have not yet undergone dissociation.
Previous kinetic studies performed under conditions of excess TBP had not detected TBP dimers (20–22). Kinetic simulations and verification by experimentation, presented here, demonstrate that under conditions of excess TBP, kinetic profiles provide no signature that distinguishes dimers from low activity monomers. The binding of yeast TBP to TATA has been reported through a number of studies to proceed with an apparent ka in the range of 2–5 × 10⁵ M−1⋅s−1. This value might include contributions from a competing dimerization reaction. Interestingly, the only other kinetic study performed in the presence of excess TATA DNA obtained an apparent ka that was 10-fold lower than that using excess TBP (34). Such deviation is expected if TBP dimerization is a competing reaction.
Because slow dissociation of TBP dimers is intrinsic to TBP and appears to dictate, in total or in part, the kinetics by which TBP binds DNA, this step provides a kinetic basis upon which TBP binding factors including basal factors, coactivators, and activators are likely to act upon. Our recent studies suggest that the RNA polymerase III transcription factor Brf1, which binds to a portion of TBP located in the crystallographic dimer interface, inhibits TBP dimerization (A. Jackson-Fisher, D. Kaczorowski, and B.F.P., unpublished data). There are likely to be additional steps in transcription complex assembly, which depending upon the promoter and factors involved, may be rate-limiting. The data here represent the description of an elementary kinetic step that limits how fast TBP can bind to a promoter in the absence of other factors.
Acknowledgments
This work was supported by grants from the National Institutes of Health (GM47855), the Searle Scholars Program/The Chicago Community Trust, and the Leukemia Society of America.
ABBREVIATIONS
- TBP
TATA binding protein
- NAB
nickel agarose binding
References
- 1.Hernandez N. Genes Dev. 1993;7:1291–1308. doi: 10.1101/gad.7.7b.1291. [DOI] [PubMed] [Google Scholar]
- 2.Zawel L, Reinberg D. Annu Rev Biochem. 1995;64:533–561. doi: 10.1146/annurev.bi.64.070195.002533. [DOI] [PubMed] [Google Scholar]
- 3.Pugh B F. Curr Opin Cell Biol. 1996;8:303–311. doi: 10.1016/s0955-0674(96)80002-0. [DOI] [PubMed] [Google Scholar]
- 4.Wang W, Gralla J D, Carey M. Genes Dev. 1992;6:1716–1727. doi: 10.1101/gad.6.9.1716. [DOI] [PubMed] [Google Scholar]
- 5.Lieberman P M, Berk A J. Genes Dev. 1994;8:995–1006. doi: 10.1101/gad.8.9.995. [DOI] [PubMed] [Google Scholar]
- 6.Kobayashi N, Boyer T G, Berk A J. Mol Cell Biol. 1995;15:6465–6473. doi: 10.1128/mcb.15.11.6465. [DOI] [PMC free article] [PubMed] [Google Scholar]
- 7.Reinberg D, Horikoshi M, Roeder R G. J Biol Chem. 1987;262:3322–3330. [PubMed] [Google Scholar]
- 8.Klein C, Struhl K. Science. 1994;266:280–282. doi: 10.1126/science.7939664. [DOI] [PubMed] [Google Scholar]
- 9.Coleman R A, Taggart A K, Benjamin L R, Pugh B F. J Biol Chem. 1995;270:13842–13849. doi: 10.1074/jbc.270.23.13842. [DOI] [PubMed] [Google Scholar]
- 10.Taggart A K, Pugh B F. Science. 1996;272:1331–1333. doi: 10.1126/science.272.5266.1331. [DOI] [PubMed] [Google Scholar]
- 11.Kato K, Makino Y, Kishimoto T, Yamauchi J, Kato S, Muramatsu M, Tamura T. Nucleic Acids Res. 1994;22:1179–1185. doi: 10.1093/nar/22.7.1179. [DOI] [PMC free article] [PubMed] [Google Scholar]
- 12.Nikolov D B, Hu S H, Lin J, Gasch A, Hoffmann A, Horikoshi M, Chua N H, Roeder R G, Burley S K. Nature (London) 1992;360:40–46. doi: 10.1038/360040a0. [DOI] [PubMed] [Google Scholar]
- 13.Chasman D I, Flaherty K M, Sharp P A, Kornberg R D. Proc Natl Acad Sci USA. 1993;90:8174–8178. doi: 10.1073/pnas.90.17.8174. [DOI] [PMC free article] [PubMed] [Google Scholar]
- 14.Kim Y, Geiger J H, Hahn S, Sigler P B. Nature (London) 1993;365:512–520. doi: 10.1038/365512a0. [DOI] [PubMed] [Google Scholar]
- 15.Kim J L, Nikolov D B, Burley S K. Nature (London) 1993;365:520–527. doi: 10.1038/365520a0. [DOI] [PubMed] [Google Scholar]
- 16.Kim J L, Burley S K. Nat Struct Biol. 1994;1:638–653. doi: 10.1038/nsb0994-638. [DOI] [PubMed] [Google Scholar]
- 17.Nikolov D B, Burley S K. Nat Struct Biol. 1994;1:621–637. doi: 10.1038/nsb0994-621. [DOI] [PubMed] [Google Scholar]
- 18.Nikolov D B, Chen H, Halay E D, Hoffman A, Roeder R G, Burley S K. Proc Natl Acad Sci USA. 1996;93:4862–4867. doi: 10.1073/pnas.93.10.4862. [DOI] [PMC free article] [PubMed] [Google Scholar]
- 19.Juo Z S, Chiu T K, Lieberman P M, Baikalov I, Berk A J, Dickerson R E. J Mol Biol. 1996;261:239–254. doi: 10.1006/jmbi.1996.0456. [DOI] [PubMed] [Google Scholar]
- 20.Hoopes B C, LeBlanc J F, Hawley D K. J Biol Chem. 1992;267:11539–11547. [PubMed] [Google Scholar]
- 21.Petri V, Hsieh M, Brenowitz M. Biochemistry. 1995;34:9977–9984. doi: 10.1021/bi00031a020. [DOI] [PubMed] [Google Scholar]
- 22.Parkhurst K M, Brenowitz M, Parkhurst L J. Biochemistry. 1996;35:7459–7465. doi: 10.1021/bi9530301. [DOI] [PubMed] [Google Scholar]
- 23.Coleman R A, Pugh B F. J Biol Chem. 1995;270:13850–13859. doi: 10.1074/jbc.270.23.13850. [DOI] [PubMed] [Google Scholar]
- 24.Nakajima N, Horikoshi M, Roeder R G. Mol Cell Biol. 1988;8:4028–4040. doi: 10.1128/mcb.8.10.4028. [DOI] [PMC free article] [PubMed] [Google Scholar]
- 25.Parvin J D, McCormick R J, Sharp P A, Fisher D E. Nature (London) 1995;373:724–727. doi: 10.1038/373724a0. [DOI] [PubMed] [Google Scholar]
- 26.Wachsstock D H, Pollard T D. Biophys J. 1994;67:1260–1273. doi: 10.1016/S0006-3495(94)80598-3. [DOI] [PMC free article] [PubMed] [Google Scholar]
- 27.Lebrun A, Shakked Z, Lavery R. Proc Natl Acad Sci USA. 1997;94:2993–2998. doi: 10.1073/pnas.94.7.2993. [DOI] [PMC free article] [PubMed] [Google Scholar]
- 28.Inostroza J A, Mermelstein F H, Ha I, Lane W S, Reinberg D. Cell. 1992;70:477–489. doi: 10.1016/0092-8674(92)90172-9. [DOI] [PubMed] [Google Scholar]
- 29.Merino A, Madden K R, Lane W S, Champoux J J, Reinberg D. Nature (London) 1993;365:227–232. doi: 10.1038/365227a0. [DOI] [PubMed] [Google Scholar]
- 30.Auble D T, Hansen K E, Mueller C G, Lane W S, Thorner J, Hahn S. Genes Dev. 1994;8:1920–1934. doi: 10.1101/gad.8.16.1920. [DOI] [PubMed] [Google Scholar]
- 31.Kim Y J, Bjorklund S, Li Y, Sayre M H, Kornberg R D. Cell. 1994;77:599–608. doi: 10.1016/0092-8674(94)90221-6. [DOI] [PubMed] [Google Scholar]
- 32.Walker S S, Reese J C, Apone L M, Green M R. Nature (London) 1996;383:185–188. doi: 10.1038/383185a0. [DOI] [PubMed] [Google Scholar]
- 33.Moqtaderi Z, Bai Y, Poon D, Weil P A, Struhl K. Nature (London) 1996;383:188–191. doi: 10.1038/383188a0. [DOI] [PubMed] [Google Scholar]
- 34.Kuddus R, Schmidt M C. Nucleic Acids Res. 1993;21:1789–1796. doi: 10.1093/nar/21.8.1789. [DOI] [PMC free article] [PubMed] [Google Scholar]