

Abstract
p48 protein is an integral component of the multimeric interferon (IFN)-regulated transcription factor, ISGF3. We have shown earlier that this gene is regulated by a novel IFN-γ-regulated element. In addition to the IFN-regulated element, a myc–max binding site is also present in this promoter. In this investigation we have studied the role of this site in the regulation of the p48 gene. In serum-induced quiescent cells Myc up-regulated the expression of p48 mRNA. We show that the protooncogene Myc regulates the expression of p48 through the element CACGTG. Mutations in this motif abolish Myc-inducibility of the reporter genes carrying p48 promoter elements. Purified Myc and Max proteins interact with the Myc-stimulated element of the p48 promoter. We also show that cells lacking p48 expression are highly susceptible to the cytocidal action of anticancer drugs. Taken together these data suggest that p48 may function as an anti-stress cell survival factor.
Keywords: transcription, cell growth, cytotoxic drugs/resistance
Transcription factor ISGF3 plays a crucial role (1) in induction of interferon (IFN)-stimulated genes (ISGs). This factor consists of a 48-kDa DNA binding protein (p48 or ISGF3γ) and two signal transducing activator of transcription (STAT) proteins, STAT1 and STAT2. p48 belongs to a family of DNA binding proteins that includes IFN-regulatory factor (IRF) and oncoprotein myb (2, 3). Other members of this family are IRF-1, IRF-2, IRF-3, cIRF-3, IFN consensus sequence binding protein (ICSBP), Pip, and V-IRF of Kaposi sarcoma-associated herpesvirus (4–10). All these proteins possess structurally similar DNA binding domains in their N termini and nonconserved C termini (3). Despite such structural similarity, these proteins are diverse in their functions. IRF-1 induces the expression of IFN-β and certain ISGs (4, 11, 12). IRF-2 represses such induction. Cells lacking IRF-1 are readily transformed by activated oncogenes, indicating a tumor suppressor role for this protein (13). ICSBP is a negative regulator of ISG expression (14). Deletion of this gene in mice leads to a chronic myelogenous leukemia-like disease and immunodeficiency (15). Pip induces immunoglobulin gene expression but inhibits ISG expression (8, 9). Gene knock-out studies have shown that p48 plays an essential role in cellular antiviral responses (16). Thus, members of the IRF gene family are involved in regulation of various cell growth and defensive processes (3).
Oncogenic transcription factor c-myc is implicated in the control of normal cellular proliferation and induction of neoplasia (17, 18). Its oncogenicity results from constitutive expression and does not require mutations in coding sequences. An N-terminal transactivation region and a C-terminal basic helix-loop-helix leucine zipper (b-HLH-LZ) are the two major functional domains of c-myc (17). Even though Myc alone binds to its cognate sequence CACGTG at high concentrations in vitro, its functional activity in vivo is dependent on heterodimerization with another sequence specific DNA binding protein Max (19–21). The b-HLH-LZ domain of Myc is essential for the formation of complexes with Max (20). Although Max/Max dimers bind to the same sequence, they are not only transcriptionally inactive but also inhibit Myc/Max induced transcription (22). Virtually all the Myc is found in complexes with Max in most cells (17, 18). Two other related proteins, Mad and Mxi1, competitively interact with Max, thereby disrupting Myc/Max complexes (23, 24). Mad/Max complexes are not known to induce gene expression, and Mad does not interact with Myc (23, 25). Consistent with this, cell proliferative and apoptotic actions of Myc are dependent on dimerization with Max (26). Thus, heteromeric complexes of Myc, Max, and Mad regulate the outcome of cell growth (17). Myc is a short-lived protein while Max is more stable (17). Levels of Myc transiently rise upon release of quiescent cells into growth permissive medium (G0/G1 to S) and return to basal level thereafter (19). Microinjection of Myc protein into the nuclei of quiescent cells stimulates DNA synthesis and promotes G1 to S phase transition. This ability of Myc to promote the cellular G1 to S phase transition likely contributes to its strong oncogenic potential (17). Down-regulation of Myc expression and withdrawal from cell cycle occur during phorbol 12-myristate 13-acetate-induced differentiation of U937 cells (27). Because Myc is a transcriptional activator, its biological actions are mediated by gene products induced by it (17, 18). Very little is known about the target genes regulated by Myc.
The involvement of IRF proteins in cell growth control prompted us to examine the role of p48 gene expression in the control of cell growth. In this report we show that the binding of Myc/Max dimer induces gene expression via a Myc-stimulated element (MSE) in the p48 promoter. Further, we show that the growth of cells lacking the p48 gene product is inhibited more readily by cytotoxic drugs in vitro, relative to wild-type cells. Based on these observations, we suggest that p48 may be a stress-alleviating factor for cycling cells.
MATERIALS AND METHODS
Cell Culture and Reagents.
Murine macrophage RAW (RAW264.7) and L929 fibroblast cell lines were grown in RPMI 1640 medium and DMEM supplemented with 10% fetal bovine serum. Human fibrosarcoma cell lines 2fTGH, U3A (STAT1 deficient), U2A (p48 deficient), and U2AR (p48 rescued) were gifts from George Stark (Cleveland Clinic Foundation, Cleveland) (see ref. 1 for details). RAT1 and RAT1–Myc–ER cell lines were gifts from Trevor Littlewood (Imperial Cancer Research Fund Laboratories, London) (28). The latter cell line stably expresses a chimeric protein consisting of c-myc coding sequences fused in-frame to the ligand binding domain of a murine estrogen receptor (ER). Treatment with 4-hydroxy tamoxifen (OHT) turns on Myc’s functional activity in this cell line. Expression vectors for c-myc, Max, and glutathione S-transferase (GST) fusion proteins of Myc N262, Myc C94, and Max C124 were provided by Robert Eisenman (Fred Hutchinson Cancer Center, Seattle). Rabbit antibodies specific for N- and C-terminal regions of c-myc protein and those against Max were purchased from Santa Cruz Biotechnology. Cell growth inhibition assays were performed as described (29).
Gene Expression Analyses.
Northern, Western, transfection, and electrophoretic mobility shift assays (EMSA) were performed as described (30). Murine p48 promoter driven luciferase constructs were described earlier (30). MSE-Wt and MSE-Mu reporters were constructed by cloning double stranded oligonucleotides upstream of simian virus 40 (SV40) promoter. Sequences of the oligonucleotides are as follows: MSE-wt 5′-AGACCACGTGGTTT-3′ and MSE-Mu 5′-AGACCACGGAGTTT-3′. MSE in these oligonucleotides is shown in bold letters and the mutant bases are shown in italics with an underline. Deletion and point mutations were constructed (31) using a PCR-based kit (Stratagene). All constructs were confirmed by DNA sequencing.
RESULTS
Induction of p48 Gene Expression by Myc.
Because members of the IRF–myb family are involved in cellular growth control, we first examined whether p48 gene expression was modulated by changes in Myc activity. Because Myc levels rise during the early phase of cell cycle (G0/G1 to S) we first examined the induction of p48 in the murine lung fibroblast cell line L929. These cells undergo contact inhibition and stop dividing upon serum withdrawal. Near-confluent L929 cells (90%) were starved for 72 h in DMEM with low serum (0.1% fetal bovine serum). At the end of starvation cells were either grown in DMEM supplemented with low (0.1%) or high (10%) serum for 5 h. Poly(A)+ RNA was isolated, Northern blotted, and probed with a 32P-labeled human p48 cDNA. As shown in Fig. 1A, expression of p48 mRNA was induced in cells grown with medium containing high serum. Such change in mRNA expression was not observed for β-actin (Fig. 1B). We next examined whether induction of p48 mRNA was accompanied by a rise in the levels of its protein. Indeed, Western blot analysis showed an increase in p48 protein levels similar to its RNA profile (Fig. 1C). Levels of actin protein did not change under these conditions (Fig. 1D). Expression of c-myc mRNA and protein preceded that of p48 gene (data not presented and see Fig. 4). These data suggest that changes in p48 mRNA level occur as the cells enter into cycle due to mitogenic stimulus of serum.
Figure 1.

Myc-regulated expression of p48 in L929 (A–D) and RAT1 (E–H) cells. Serum starved L929 cells (72h) were grown in medium with low (0.1%; lanes S) or high (10%; lanes I) serum for 5 h. Poly(A)+ RNA (4 μg) was isolated, Northern blotted, and probed with a human p48 probe (A). These blots were also probed with human β-actin (B). (C) Western blot analysis for p48 protein using rabbit anti-p48 antibodies. Whole cell extracts were prepared after 6-h treatment as in A and 40 μg of protein from each sample was used in SDS/PAGE followed by Western blot analysis. (D) The same blot as in C was analyzed with rabbit anti-actin antibodies. (E and F) p48 induction in RAT1 cells (lanes 1 and 2) and Myc–ER cells (lanes 3 and 4). Serum starved cells were treated for 5 h with OHT (100 nM), and poly(A)+ RNA was analyzed for p48 mRNA expression as in A. Lanes: C, no treatment; T, OHT. (F) A stripped blot of E reprobed with β-actin. (G) OHT-induced expression of p48 protein in Myc ER cells. Cells were induced with OHT as in E and analyzed by Western blot as in C. (H) Western blot for actin expression in the same blot as in G.
Figure 4.

Binding of Myc to MSE. (A) A 14-bp double-stranded oligonucleotide corresponding to the MSE of p48 gene (see Fig. 3B) was labeled with 32P and incubated with nuclear extracts (4 μg) from serum starved (S) or induced (I) L929 cells in an EMSA. Serum stimulation of cells was performed for 4 h. The inducible band was indicated with an arrow. (B) Binding specificity of inducible factor to MSE. EMSA was performed as in A except that the nuclear extracts were incubated with indicated molar excesses of mutant (Mu) or wild-type (Wt) MSE prior to incubation with labeled MSE. (C) Effects of Myc- or Max-specific antibodies on the inducible factor. EMSA was similar to A except that nuclear extracts were incubated with the indicated antibodies for 40 min before the addition of radiolabeled MSE. (D) OHT-activated binding of Myc to MSE. Nuclear extracts (4 μg) from OHT-treated (100 nM) cells were incubated with labeled MSE and EMSA was performed. In lanes 3–5 nuclear extracts from OHT-treated Myc–ER cells were incubated with indicated antibodies as in C. EMSA was similar to A.
Because growth factor-induced Myc is an immediate early gene product that regulates cell cycle entry (17), we hypothesize that Myc stimulates p48 expression. Because multiple early gene products are turned on during mitogenic stimulus, it is important to demonstrate that p48 induction is due to transcriptional induction by Myc. To determine if Myc directly regulated p48, we employed the RAT1 cell line that was stably transfected with a Myc–ER fusion gene RAT1–Myc–ER (referred to as Myc–ER). Transactivating function of Myc in the chimeric Myc–ER fusion protein was stimulated by the binding of OHT to the ER domain (28). RAT1 and Myc–ER cells were starved in the phenol red-free DMEM supplemented with 1% charcoal-treated serum for 48 h before treatment with either OHT (100 nM) for 4 h or none. Under these conditions the RAT1 cells expressed a low basal level of Myc that did not alter upon OHT treatment (data not shown). Poly(A)+ RNA was prepared from various treatments and analyzed for p48 and β-actin mRNA expression in Northern blots. RAT1 cells showed no increase in p48 mRNA after OHT treatment (Fig. 1E, lanes 1 and 2). On the other hand, OHT strongly induced p48 mRNA in Myc–ER cells. Basal level of p48 mRNA remained similar to RAT1 cells. Irrespective of these treatments, the β-actin mRNA levels were unchanged (Fig. 1F). Furthermore, Western blot analysis showed that OHT treatment increased p48 protein in Myc–ER cells (Fig. 1G). Levels of actin protein did not change with OHT treatment (Fig. 1H). These observations indicated that p48 expression was directly up-regulated by Myc.
Induction of Murine p48 Gene Promoter-Driven Luciferase Reporter Gene Expression by Myc.
To further prove that transcriptional induction of p48 by myc was mediated by specific upstream regulatory elements, we employed p48 promoter-driven luciferase reporter plasmids in transfection assays (30). Transfection of c-myc expression vector along with the reporter gene A6 yielded 8- and 6.2-fold higher luciferase activity in murine RAW and L929 cells, respectively (Fig. 2A). Such induction was not observed with A8 construct which contained the −351 to +1 nt of p48 promoter. Cotransfection of Max along with these reporters did not induce gene expression (data not shown). Deletion (ΔM1) or point mutagenesis of γ-activated transcriptional element (GATE) (GATE pm) sequence in this promoter had no effect on Myc inducibility. However, site directed mutagenesis of MSE (MSE pm) abrogated Myc-induced expression. In general, Myc inducibility of the reporters was slightly higher in RAW cells than L929 cells.
Figure 2.

Induction of p48 promoter by c-Myc. Indicated p48 promoter constructs (10 μg) RAW or L929 cells were cotransfected with either control or Myc expression vector (4 μg) and analyzed for induction of luciferase activity. A β-actin promoter-driven β-galactosidase plasmid (3 μg) was also cotransfected in all cases to monitor for transfection efficiency, and luciferase activities were normalized to β-galactosidase activity. Mean luciferase activity of triplicate measurements was calculated. Fold induction was the ratio of luciferase activity observed in control to Myc expression vector transfected cells.
Myc-induced expression of p48 promoter elements was also studied with reporter plasmids in which p48 promoter elements were placed upstream of SV40 early promoter (Fig. 2B). A 4- to 5-fold induction of luciferase expression was observed with construct P1, which carried both GATE and MSE. No such induction was noted with constructs P2 and P3, which lacked the MSE. P2 was not induced by Myc despite the presence of a functional GATE. Similarly, fusion of a 14-bp MSE to SV40 promoter conferred Myc inducibility. A similar construct with a 2-bp change in MSE (see Materials and Methods) was not induced by Myc. As anticipated, a reporter plasmid regulated by GATE was not stimulated by Myc. A lower level of Myc inducibility was noted in the constructs that carried the SV40 promoter than those with the native promoter. This may be due to a promoter-specific activation of gene expression by Myc. Thus, the putative MSE identified in the p48 promoter alone is sufficient for Myc inducibility.
To further demonstrate that induction of p48 was not due to an indirect effect of Myc-induced IFN, transfection assays were performed in 2fTGH (wild-type) and U3A (STAT1 deficient, IFN-unresponsive) cells. Constructs A6, GATE pm, and P1 were induced 4- to 5-fold upon cotransfection with a Myc expression vector in both these cell lines (Table 1). As expected, Myc pm and P2 constructs were not inducible in these cells. Myc-induced transcription from p48 promoter was also studied in RAT1 and Myc–ER cells. As shown in Table 2, A6, GATE pm, and P1, but not MSE pm and P2, constructs were induced by 5- to 6-fold upon OHT treatment of Myc–ER cells. OHT did not induce these constructs in RAT1 cells. Thus, Myc was a direct regulator of p48.
Table 1.
Myc-stimulated expression of murine p48 promoter elements
| Reporter | 2fTGH | U3A |
|---|---|---|
| A6 | 4.5 | 5.0 |
| GATE pm | 4.7 | 4.9 |
| MSE pm | 1.1 | 0.9 |
| P1 | 4.1 | 4.0 |
| P2 | 1.0 | 1.0 |
Numbers indicate the fold induction of luciferase activity. Fold induction is the ratio of luciferase activity obtained in control vs. Myc expression vector cotransfections.
Table 2.
OHT-regulated myc transactivates murine p48 promoter
| Reporter | RAT1 | Myc–ER |
|---|---|---|
| A6 | 1.2 | 6.2 |
| GATE pm | 1.0 | 5.8 |
| MSE pm | 1.1 | 1.2 |
| P1 | 0.9 | 5.5 |
| P2 | 1.0 | 0.8 |
Numbers indicate the fold induction of luciferase activity. Fold induction is the ratio of activity obtained with untreated OHT-treated cells.
Previous studies showed that Myc bound to CACGTG and CATGTG sequences (17, 18). Examination of the p48 promoter sequence revealed a MSE upstream of the GATE (Fig. 3A). It shared a strong sequence homology to the consensus MSE (CM-1) both in the core and flanking regions as compared with other known natural MSEs (Fig. 3B). Interestingly, most Myc-inducible genes possess these elements downstream of the transcription initiation site in the intronic regions (18). p48 promoter appears to be unique in this regard.
Figure 3.

Analysis of MSE of murine p48 promoter. (A) Relative positions of GATE and MSE in the promoter region corresponding to −490 to −590 bases. (B) Comparison of MSEs from various cellular genes and their relationship to consensus MSE, CM-1. ODC, ornithine decarboxylase; PT, prothymosine; cdc25: CDK activating phosphatase A gene. Vertical line indicates identity with CM-1. Core MSE is shown in bold letters.
Myc Binds to its Cognate Site in p48 Promoter.
We next determined the binding of Myc to the MSE in p48 promoter by EMSA. In these experiments a 14-bp MSE corresponding to the sequence present in p48 promoter was labeled with 32P and incubated with starved or serum-induced L929 cell extracts. As shown in Fig. 4A, Myc binding to this element was strongly enhanced in serum-induced (4 h) cells vs. starved cells. A single high intensity complex was formed in these cells upon serum stimulation of starved cells. To test the binding specificity of this complex, competition assays were performed. Mutant oligonucleotide with a 2-bp change in the MSE failed to compete out the binding (Fig. 4B). Contrary to this, the wild-type oligonucleotide specifically competed out the binding of the inducible factor to MSE. This factor was identified as a Myc/Max complex because preincubation of nuclear extracts with specific antibodies against Myc and Max proteins inhibited the complex formation (Fig. 4C, lanes 2 and 3). EMSA was also performed using cell extracts from OHT-stimulated RAT1 and Myc–ER cells (Fig. 4D). A faster mobility complex was seen in RAT1 cells. A slow mobility complex was present in OHT-treated Myc–ER cells. Formation of this complex was inhibited upon preincubation of these extracts with specific antibodies against Myc and Max proteins. The complex observed with RAT1 cell extracts consisted of Max (data not shown).
To directly demonstrate the interaction of Myc/Max with the element, bacterially expressed, purified GST-fusion proteins of Myc and Max (20, 23) were incubated with the Myc binding element in EMSA (Fig. 5A). GST protein itself did not bind to the oligonucleotide Myc C92 and Myc N262 alone bound poorly to MSE (Fig. 5A). At high concentrations, purified Myc C92 itself bound to the oligonucleotide (data not shown). Max C124 formed a faster mobility complex. Co-incubation of Max C124 with Myc C92 protein led to the formation of a new, slow mobility complex. No such complex was formed when Myc N262 protein was co-incubated with Max C124 (data not shown). The faster mobility complex was recognized by anti-Max antibodies (Fig. 5B). The slow mobility complex formed by Myc/Max proteins was recognized by anti-Myc antibodies. An unrelated antibody, raised against IRF-3, had no effect on the formation of these complexes. Thus, Myc/Max complex bound to the response element identified in the p48 promoter.
Figure 5.

Interaction of bacterially expressed Myc and Max proteins with MSE. (A) GST fusion proteins described elsewhere (20, 23) were employed in an EMSA with MSE. Myc N262 and Myc C92 contained N- (transactivating) and C-terminal (DNA binding/b-HLH-LZ) domains of Myc expressed as GST fusion proteins. Max C124 contained the DNA binding domain (b-HLH-LZ) as GST fusion protein. pGEX-3T was the control vector which contained the GST domain of these proteins. EMSA with purified proteins and labeled MSE was performed as in Fig. 4. The + and − indicate presence or absence of specific protein in EMSA reactions, respectively. (B) Effects of antibodies on the DNA binding of GST fusion proteins. Specific antibodies used in preincubation reactions were indicated on the top of the panel.
Lack of Functional p48 Enhances Cellular Sensitivity to Cytotoxic Drugs.
To test the functional significance of Myc-induced expression of p48 gene, effects of cytotoxic drugs on three cell lines: 2fTGH (wild type), U2A (p48 deficient), and U2AR (rescued by expression of p48 gene) were studied. Although all the cells were sensitive to etoposide-induced growth arrest, the mutant cell line U2A exhibited exquisite sensitivity to the drug (Fig. 6). Etoposide at lower concentrations caused growth arrest in 2fTGH but was cytotoxic to U2A cells. The bar was on the negative scale in the graph, indicating a cytotoxic effect. p48-rescued cell line U2AR was less sensitive to the cytotoxic action of the drug like the parent cell line. Higher concentrations of etoposide was toxic to all the cell lines. To test whether such sensitivity of p48 mutant cells was specific to etoposide or was a general effect, a number of other anticancer drugs were tested. As shown in Table 3, although all the drugs could inhibit growth, the mutant U2A was more sensitive than the wild type. The ID50 for most drugs was 2- to 3-fold higher in 2fTGH cells compared with U2A cells (Table 3). U2AR was slightly more sensitive than 2fTGH. However, U2AR was relatively more resistant to all the drugs compared with mutant U2A. These results indicated that the rescued cells had not been completely restored to wild-type behavior in terms of relative drug resistance. Because the drugs used in our study affect disparate targets and p48 antagonizes all of them, it may indicate a general survival or growth promoting function for p48.
Figure 6.
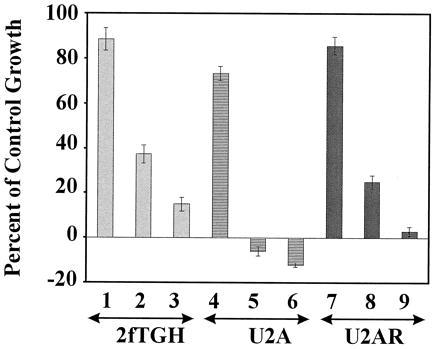
Protection from drug-induced cell growth arrest by p48. Indicated cell lines (2 × 10³ cells/well) were incubated with various concentrations of etoposide for 96 h. Etoposide concentrations: bars 1, 4, and 7, 2 ng/ml; bars 2, 5, and 8, 20 ng/ml; and bars 3, 6, and 9, 200 ng/ml. Cell number was determined by staining with sulforhodamine B in 96-well plates (29). Dye bound to the cells was eluted and quantitated in a microplate reader at 570 nm. Starting cell number was determined on the first day of the experiment. Initial A570 (iA570) was taken as 0% growth. Similarly, A570 corresponding to untreated wells at the end of the experiment was considered as 100% growth. Cytotoxicity in the treated wells was detected as A570 < iA570. Represented as percent of control growth, cytotoxicity was indicated by negative values. Each data point was the mean ± SEM of quadruplicate samples in the same experiment.
Table 3.
Effects of growth inhibitory drugs on mutant cells
| Drug | ID50, pg/ml
|
||
|---|---|---|---|
| 2fTGH | U2A | U2AR | |
| Paclitaxel | 81 | 37 | 69 |
| Vinorelbine | 73 | 28 | 55 |
| Vincristine | 9.2 | 6.3 | 7.7 |
| Doxorubicin | 350 | 109 | 262 |
| Idarubicinol | 450 | 207 | 345 |
| Idarubicin | 241 | 33 | 196 |
ID50 of drugs for each cell line was calculated using the same method as described in Fig. 6.
DISCUSSION
The IRF–myb family includes several functionally diverse transcription factors with structurally homologous DNA binding domains (3). Two such proteins, IRF-1 and p48, are not functionally equivalent, although both of them bind to ISRE and regulate gene expression (1, 2, 13, 16). While most ISGs require p48 (1), very few are dependent on IRF-1 (11, 12) for their induction by IFNs. Similarly, IRF-1 but not p48 preferentially regulates IFN genes (4), although one study suggests a role for p48 in such process in the absence of IRF-1 (32). Cells lacking IRF-1 are resistant to apoptosis and are therefore readily transformed by oncogenes (13). Mice lacking the p48 gene succumb to viral infection (16). However, its role in cell growth is not clear. ICSBP, another member of IRF family, suppresses ISG expression by inhibiting the DNA binding of p48 (5). Homozygous deletion of ICSBP leads to immunodeficiency and chronic myelogenous leukemia-like disease (15). In the light of these observations and the structural homology with IRF–myb proteins, it is likely that p48 plays a distinct role in cell growth control.
In this study Northern, Western, and transfection analyses demonstrate that protooncogene c-myc up-regulates p48 gene expression. The fact that c-myc induces A6, GATE pm, and P1 constructs both in 2fTGH and U3A cell lines to the same extent indicates no involvement of autocrine IFN in such regulation. U3A cells do not respond to IFNs because of STAT1 deficiency (33). Studies with RAT1 and Myc–ER cells show that induction of luciferase and endogenous p48 gene occur as a result of transactivation by Myc but not by the transactivating sequences of ER. More importantly, the cell line employed in our study utilizes a mutant version of Myc–ER fusion in which the previously suspected transactivation sequences of ER have been eliminated, and has 1,000-fold reduced affinity for estradiol compared with the wild-type ER (28). Despite such mutation it readily responds to the synthetic nonsteroid, OHT. Furthermore, RAT1 cells do not express a functional ER. No ER binding sites are present in p48 promoter. Therefore, neither OHT nor endogenous estrogens may directly induce p48 gene. Sequence analysis revealed a MSE identical to the consensus Myc binding element CM-1 (34). In both serum-stimulated L929 cells and Myc–ER cells, the Myc/Max complex binds to the MSE. Studies with purified bacterially expressed GST fusion proteins provide direct evidence for Myc/Max association with this site. Thus, p48 gene is a direct target for myc stimulation.
Myc-activated gene expression can lead to cell division or apoptosis (18). Recently, cyclin D, ornithine decarboxylase (ODC), prothymosine, and CDK-activating phosphatases Cdc25A and Cdc25B have been reported to serve as targets of Myc-induced cell proliferation (35–38). Like Myc, Cdc25A (37) and ODC exhibit oncogenic properties (18). Our studies with p48 mutant cell lines show that loss of p48 gene results in an enhanced susceptibility of cells to the growth inhibitory actions of several anticancer drugs. These observations have important clinical implications because, by interfering with p48 function or decreasing its levels, it may be possible to enhance the activity of anticancer drugs. The notable differences in the sensitivities of 2fTGH and U2AR to cytotoxic agents may be due to the method by which U2A has been derived. Because U2A has been obtained by random mutagenesis (39), it is likely that other p48-dependent and independent anti-stress genes are mutated. Therefore, re-expression of p48 may not fully restore anti-stress activity in the cell. Nonetheless, our data suggest that p48 serves either as an anti-growth inhibitory or anti-stress factor. Because Myc controls cell proliferation and p48 expression, it seems to fit this role for p48. Molecules like p48 may prevent growth arrest/cell death under low stress conditions as a first line defense. As the threshold of stress increases, other pro- or growth regulatory molecules may come into action. Consistent with this theory, Myc regulates both pro- and anti-growth molecules, including those involved in apoptosis, depending on physiological status of the cell (17, 18, 37, 40–42). Because both Myc and p48 are transcription factors, we predict that additional Myc-directed p48-dependent gene products may participate in this process. Therefore, it will be necessary to identify the p48-regulated anti-stress molecules. Given the role of IFNs in cell growth inhibition (43) and p48 as a mediator of their action (1, 2) it is surprising that p48 acts as a pro-growth molecule. Based on our observations we propose a bifunctional role for p48. In the IFN-directed pathway the functional activity of p48 is influenced by STATs, with which it associates (1, 2), leading to growth arrest. In the Myc-directed pathway p48 participates as a growth promoter, which we hypothesize to be independent of STATs. In an analogous manner, Pip acts as transcriptional repressor in the absence of PU.1 (8, 9). Thus, it is likely that p48 acts either alone or in association with other proteins to exert Myc’s growth promoting function.
IFNs down-regulate Myc expression in certain leukemia cell lines (44). c-myc promoter has IFN response element-like sequences (45). Thus, p48 may also participate in a post-S phase shut off of Myc synthesis. The source for stimulation of p48’s DNA binding activity may be autocrine IFN. Lastly, Myc-induced expression of the p48 gene may contribute to the basal level of p48 protein observed in most cells (46). Consistent with our results, platelet-derived growth factor and epidermal growth factor induce a p48-like signal in serum-starved HeLaM cells (47). This effect is mediated most likely by Myc. Our studies directly link p48 to the cell cycle via regulatory molecule c-myc. Therefore, study of the roles of IRF family members may yield new insights into the mechanisms of cell growth control and tumorigenesis.
Acknowledgments
We thank Drs. Robert Eisenman, Trevor Littlewood, and George Stark for providing several important reagents used in this study and the National Cancer Institute for grant support (to D.V.K.).
ABBREVIATIONS
- GATE
γ-activated transcriptional element
- ER
estrogen receptor
- EMSA
electrophoretic mobility shift assay
- IFN
interferon
- ICSBP
IFN consensus sequence binding protein
- ISRE
IFN-stimulated response element
- ISG
IFN-stimulated gene
- ISGF
ISG factor
- MSE
Myc-stimulated element
- OHT
4-hydroxy tamoxifen
- STAT
signal transducers and activators of transcription
- IRF
interferon gene regulatory factor
- b-HLH-LZ
basic helix-loop-helix leucine zipper
- GST
glutathione S-transferase
- SV40
simian virus 40
References
- 1.Darnell J E, Jr, Kerr I M, Stark G R. Science. 1994;264:1415–1421. doi: 10.1126/science.8197455. [DOI] [PubMed] [Google Scholar]
- 2.Veals S A, Schindler C, Leonard D, Fu X Y, Aebersold R, Darnell J E, Jr, Levy D E. Mol Cell Biol. 1992;12:3315–3324. doi: 10.1128/mcb.12.8.3315. [DOI] [PMC free article] [PubMed] [Google Scholar]
- 3.Taniguchi T, Harada H, Lamphier M. J Cancer Res Clin Oncol. 1995;121:516–520. doi: 10.1007/BF01197763. [DOI] [PMC free article] [PubMed] [Google Scholar]
- 4.Harada H, Fujita T, Miyamoto M, Kimura Y, Maruyama M, Furia A, Miyata T, Taniguchi T. Cell. 1989;58:729–739. doi: 10.1016/0092-8674(89)90107-4. [DOI] [PubMed] [Google Scholar]
- 5.Bovolenta C, Driggers P H, Marks M S, Medin J A, Politis A D, Vogel S N, Levy D E, Sakaguchi K, Appella E, Coligan J E, Ozato K. Proc Natl Acad Sci USA. 1994;91:5046–5050. doi: 10.1073/pnas.91.11.5046. [DOI] [PMC free article] [PubMed] [Google Scholar]
- 6.Au W C, Moore P A, Lowther W, Juang Y T, Pitha P M. Proc Natl Acad Sci USA. 1995;92:11657–11661. doi: 10.1073/pnas.92.25.11657. [DOI] [PMC free article] [PubMed] [Google Scholar]
- 7.Grant C E, Vasa M Z, Deeley R G. Nucleic Acids Res. 1995;23:2137–2146. doi: 10.1093/nar/23.12.2137. [DOI] [PMC free article] [PubMed] [Google Scholar]
- 8.Brass A L, Kehrli E, Eisenbeis C F, Storb U, Singh H. Genes Dev. 1996;10:2335–2347. doi: 10.1101/gad.10.18.2335. [DOI] [PubMed] [Google Scholar]
- 9.Yamagata T, Nishida J, Tanaka S, Sakai R, Mitani K, Yoshida M, Taniguchi T, Yazaki Y, Hirai H. Mol Cell Biol. 1996;16:1283–1294. doi: 10.1128/MCB.16.4.1283. [DOI] [PMC free article] [PubMed] [Google Scholar]
- 10.Moore P S, Boshoff C, Weiss R A, Chang Y. Science. 1996;274:1739–1744. doi: 10.1126/science.274.5293.1739. [DOI] [PubMed] [Google Scholar]
- 11.Kamijo R, Harada H, Matsuyama T, Bosland M, Gerecitano J, Shapiro D, Le J, Koh S I, Kimura T, Green S J, Mak T W, Taniguchi T, Vilcek J. Science. 1994;263:1612–1615. doi: 10.1126/science.7510419. [DOI] [PubMed] [Google Scholar]
- 12.Briken V, Ruffner H, Schultz U, Schwarz A, Reis L F, Strehlow I, Decker T, Staeheli P. Mol Cell Biol. 1995;15:975–982. doi: 10.1128/mcb.15.2.975. [DOI] [PMC free article] [PubMed] [Google Scholar]
- 13.Tanaka N, Ishihara M, Kitagawa M, Harada H, Kimura T, Matsuyama T, Lamphier M S, Aizawa S, Mak T W, Taniguchi T. Cell. 1994;77:829–839. doi: 10.1016/0092-8674(94)90132-5. [DOI] [PubMed] [Google Scholar]
- 14.Nelson N, Marks M S, Driggers P H, Ozato K. Mol Cell Biol. 1993;13:588–99. doi: 10.1128/mcb.13.1.588. [DOI] [PMC free article] [PubMed] [Google Scholar]
- 15.Holtschke T, Lohler J, Kanno Y, Fehr T, Giese N, Rosenbauer F, Lou J, Knobeloch K P, Gabriele L, Waring J, Bachmann M F, Zinkernagel R M, Morse H C, Ozato K, Horak I. Cell. 1996;87:307–317. doi: 10.1016/s0092-8674(00)81348-3. [DOI] [PubMed] [Google Scholar]
- 16.Kimura T, Kadokawa Y, Harada H, Matsumoto M, Sato M, Kashiwazaki Y, Tarutani M, Tan R S, Takasugi T, Matsuyama T, Mak T W, Noguchi S, Taniguchi T. Genes Cells. 1996;1:115–124. doi: 10.1046/j.1365-2443.1996.08008.x. [DOI] [PubMed] [Google Scholar]
- 17.Henriksson M, Luscher B. Adv Cancer Res. 1996;68:109–182. doi: 10.1016/s0065-230x(08)60353-x. [DOI] [PubMed] [Google Scholar]
- 18.Packham G, Cleveland J L. Biochim Biophys Acta. 1995;1242:11–28. doi: 10.1016/0304-419x(94)00015-t. [DOI] [PubMed] [Google Scholar]
- 19.Blackwood E M, Eisenman R N. Science. 1991;251:1211–1217. doi: 10.1126/science.2006410. [DOI] [PubMed] [Google Scholar]
- 20.Blackwood E M, Luscher B, Eisenman R N. Genes Dev. 1992;6:71–80. doi: 10.1101/gad.6.1.71. [DOI] [PubMed] [Google Scholar]
- 21.Prendergast G C, Hopewell R, Gorham B J, Ziff E B. Genes Dev. 1992;6:2429–2439. doi: 10.1101/gad.6.12a.2429. [DOI] [PubMed] [Google Scholar]
- 22.Kretzner L, Blackwood E M, Eisenman R N. Nature (London) 1992;359:426–429. doi: 10.1038/359426a0. [DOI] [PubMed] [Google Scholar]
- 23.Ayer D E, Kretzner L, Eisenman R N. Cell. 1993;72:211–222. doi: 10.1016/0092-8674(93)90661-9. [DOI] [PubMed] [Google Scholar]
- 24.Zervos A S, Gyuris J, Brent R. Cell. 1993;72:223–232. doi: 10.1016/0092-8674(93)90662-a. [DOI] [PubMed] [Google Scholar]
- 25.Ayer D E, Laherty C D, Lawrence Q A, Armstrong A P, Eisenman R N. Mol Cell Biol. 1996;16:5772–5781. doi: 10.1128/mcb.16.10.5772. [DOI] [PMC free article] [PubMed] [Google Scholar]
- 26.Amati B, Littlewood T D, Evan G I, Land H. EMBO J. 1993;12:5083–5087. doi: 10.1002/j.1460-2075.1993.tb06202.x. [DOI] [PMC free article] [PubMed] [Google Scholar]
- 27.Meinhardt G, Hass R. Leukemia Res. 1995;19:699–705. doi: 10.1016/0145-2126(95)00040-u. [DOI] [PubMed] [Google Scholar]
- 28.Littlewood T D, Hancock D C, Danielian P S, Parker M G, Evan G I. Nucleic Acids Res. 1995;23:1686–1690. doi: 10.1093/nar/23.10.1686. [DOI] [PMC free article] [PubMed] [Google Scholar]
- 29.Skehan P, Storeng R, Scudiero D, Monks A, McMahon J, Vistica D, Warren J T, Bokesch H, Kenney S, Boyd M R. J Natl Cancer Inst. 1990;82:1107–1112. doi: 10.1093/jnci/82.13.1107. [DOI] [PubMed] [Google Scholar]
- 30.Weihua X, Kolla V, Kalvakolanu D V. Proc Natl Acad Sci USA. 1997;94:103–108. doi: 10.1073/pnas.94.1.103. [DOI] [PMC free article] [PubMed] [Google Scholar]
- 31.Weiner M P, Costa G L, Schoettlin W, Cline J, Mathur E, Bauer J C. Gene. 1994;151:119–123. doi: 10.1016/0378-1119(94)90641-6. [DOI] [PubMed] [Google Scholar]
- 32.Kawakami T, Matsumoto M, Sato M, Harada H, Taniguchi T, Kitagawa M. FEBS Lett. 1995;358:225–229. doi: 10.1016/0014-5793(94)01426-2. [DOI] [PubMed] [Google Scholar]
- 33.Muller M, Laxton C, Briscoe J, Schindler C, Improta T, Darnell J E, Jr, Stark G R, Kerr I M. EMBO J. 1993;12:4221–4228. doi: 10.1002/j.1460-2075.1993.tb06106.x. [DOI] [PMC free article] [PubMed] [Google Scholar]
- 34.Blackwell T K, Kretzner L, Blackwood E M, Eisenman R N, Weintraub H. Science. 1990;250:1149–1151. doi: 10.1126/science.2251503. [DOI] [PubMed] [Google Scholar]
- 35.Daksis J I, Lu R Y, Facchini L M, Marhin W W, Penn L J. Oncogene. 1994;9:3635–3645. [PubMed] [Google Scholar]
- 36.Bello-Fernandez C, Packham G, Cleveland J L. Proc Natl Acad Sci USA. 1993;90:7804–7808. doi: 10.1073/pnas.90.16.7804. [DOI] [PMC free article] [PubMed] [Google Scholar]
- 37.Galaktionov K, Chen X, Beach D. Nature (London) 1996;382:511–517. doi: 10.1038/382511a0. [DOI] [PubMed] [Google Scholar]
- 38.Gaubatz S, Meichle A, Eilers M. Mol Cell Biol. 1994;14:3853–3862. doi: 10.1128/mcb.14.6.3853. [DOI] [PMC free article] [PubMed] [Google Scholar]
- 39.McKendry R, John J, Flavell D, Muller M, Kerr I M, Stark G R. Proc Natl Acad Sci USA. 1991;88:11455–11459. doi: 10.1073/pnas.88.24.11455. [DOI] [PMC free article] [PubMed] [Google Scholar]
- 40.Hermeking H, Eick D. Science. 1994;265:2091–2093. doi: 10.1126/science.8091232. [DOI] [PubMed] [Google Scholar]
- 41.Wagner A J, Kokontis J M, Hay N. Genes Dev. 1994;8:2817–2830. doi: 10.1101/gad.8.23.2817. [DOI] [PubMed] [Google Scholar]
- 42.Packham G, Cleveland J L. Mol Cell Biol. 1994;14:5741–5747. doi: 10.1128/mcb.14.9.5741. [DOI] [PMC free article] [PubMed] [Google Scholar]
- 43.Kalvakolanu D V, Borden E C. Cancer Invest. 1996;14:25–53. doi: 10.3109/07357909609018435. [DOI] [PubMed] [Google Scholar]
- 44.Raveh T, Hovanessian A G, Meurs E F, Sonenberg N, Kimchi A. J Biol Chem. 1996;271:25479–25484. doi: 10.1074/jbc.271.41.25479. [DOI] [PubMed] [Google Scholar]
- 45.Alexandrova N M, Itkes A V, Imamova L R, Chernov B K, Tulchinsky E M, Ulyanov N B, Kisselev L L. FEBS Lett. 1990;265:67–70. doi: 10.1016/0014-5793(90)80885-m. [DOI] [PubMed] [Google Scholar]
- 46.Levy D E, Lew D J, Decker T, Kessler D S, Darnell J E., Jr EMBO J. 1990;9:1105–1111. doi: 10.1002/j.1460-2075.1990.tb08216.x. [DOI] [PMC free article] [PubMed] [Google Scholar]
- 47.Tiwari R K, Kusari J, Sen G C. EMBO J. 1987;6:3373–3378. doi: 10.1002/j.1460-2075.1987.tb02659.x. [DOI] [PMC free article] [PubMed] [Google Scholar]