

Abstract
E2F transcription activity is composed of a family of heterodimers encoded by distinct genes. Through the overproduction of each of the five known E2F proteins in mammalian cells, we demonstrate that a large number of genes encoding proteins important for cell cycle regulation and DNA replication can be activated by the E2F proteins and that there are distinct specificities in the activation of these genes by individual E2F family members. Coexpression of each E2F protein with the DP1 heterodimeric partner does not significantly alter this specificity. We also find that only E2F1 overexpression induces cells to undergo apoptosis, despite the fact that at least two other E2F family members, E2F2 and E2F3, are equally capable of inducing S phase. The ability of E2F1 to induce apoptosis appears to result from the specific induction of an apoptosis-promoting activity rather than the lack of induction of a survival activity, because co-expression of E2F2 and E2F3 does not rescue cells from E2F1-mediated apoptosis. We conclude that E2F family members play distinct roles in cell cycle control and that E2F1 may function as a specific signal for the initiation of an apoptosis pathway that must normally be blocked for a productive proliferation event.
Various studies have led to the delineation of a pathway controlling the progression of cells from quiescence, through G1, and into S phase that involves the activation of G1 cyclin-dependent kinases (cdk), inactivation of Rb and related proteins, and accumulation of E2F transcription factor activity (for reviews see refs. 1–7). It is also now clear that the disruption of components of this control pathway, either the activation of positive acting components such as the G1 cyclins or the inactivation of negative components such as p53, Rb, and the cyclin-dependent kinase inhibitors (CKI), can lead to the loss of cell growth control underlying the development of various forms of human cancer (7, 8).
Like many other signal transduction activities, E2F consists of a family of related proteins that include five distinct E2F members and at least two heterodimer partners, DP1 and DP2. The complexity of the E2F activity, as generated by the formation of a variety of heterodimeric protein complexes, suggests a complexity of function whereby the individual family members might play distinct roles in cellular growth control. For instance, the individual E2F family members might integrate distinct signaling pathways within the cell to facilitate the orderly progression through the growth cycle. That is, individual E2F genes might respond to different components of a growth signaling process, either distinct extracellular growth factors or simply distinct signal transduction pathways that integrate a complex growth response. Additionally, but not exclusive of the first instance, the individual E2F proteins could activate distinct target genes, the total of which constitutes the range of activities necessary for cells to progress into and through S phase. Finally, the complexity of E2F activity might also contribute to cell type-specific activation of genes controlling cell fate in different tissues.
We have shown previously that E2F1 can activate a number of suspected endogenous E2F target genes, coincident with the ability of E2F1 to alter cell growth control (9). We have now constructed recombinant viruses encoding each member of the E2F family to compare the abilities of these related proteins to affect cell cycle control. By using these viruses, we demonstrate that there are distinct differences in the ability of E2F family members to induce S phase. In particular, it appears that E2F1, E2F2, and E2F3 share the capacity to achieve an efficient induction of S phase. In contrast, E2F4 and E2F5 only weakly induce S phase. Perhaps most striking is the finding that the previously described E2F1-mediated induction of apoptosis (10–13) is an activity that is unique to the E2F1 product, suggesting a role for this E2F protein as a signal for activating a specific cell fate pathway.
MATERIALS AND METHODS
Cells and Viruses.
Viral stocks were created as described previously (14), and the virus was purified by CsCl density gradient centrifugation as described (15). Viral titers were determined by an indirect immunofluorescent assay specific for the viral 72-kDa E2 gene product as described (9) and defined as focus forming units (ffu) per ml. The construction of the recombinant viruses Ad-E2F1 and Ad-Con (a control virus, previously termed AdMb or Ad-CMV, lacking a cDNA insert) have been described (14, 16). Ad-E2F2 was constructed by ligation of the BglII fragment from pCMV-E2F2 (17) into the BamHI-digested pcDNA3 (Invitrogen). The resulting construct (E2F2-pcDNA3) was digested with HindIII–NotI, and the resulting 1401-bp E2F2 fragment was ligated into the HindIII–NotI-digested pGEM-CMV. Ad-E2F3 was constructed by ligation of the EcoRI fragment containing E2F3 from pBSK-E2F3 (18) into EcoRI-digested pcDNA3. The 1570-bp HindIII–NotI fragment from the resulting clone (E2F3-pcDNA3) was then ligated into the HindIII–NotI-digested pGEM-CMV. Ad-E2F4 was constructed by ligation of the KpnI–XbaI fragment from pcDNA3-E2F4 (19) into the KpnI–XbaI-digested pGEM-CMV. Ad-E2F5 was constructed by ligation of the BamHI–XbaI fragment from pcDNA3-E2F5 (19) into the BamHI–XbaI-digested pGEM-CMV. Ad-DP1 was constructed by ligation of the HindIII–NotI fragment from pRcCMV-T7DP1 (20) into the HindIII–NotI-digested pGEM-CMV.
REF52 cells were grown in DMEM containing 10% serum (5% fetal bovine serum and 5% calf serum). To bring cells to quiescence, REF52 cells were plated at approximately 3,500 cells/cm2 and incubated overnight. On the next day, the cells were washed once with DMEM, and the culture medium was replaced with DMEM containing 0.25% serum. Cells were further incubated for 48 hr prior to virus infection or serum stimulation by replacement with culture medium containing 10% serum. Cells on plates were infected in DMEM with 20 mM Hepes (pH 7.2) for 75 min at 37°C at a cell to volume ratio of 0.5 × 10⁶ cells/ml (0.5 ml for a 35-mm plate, 2 ml for a 100-mm plate, or 5 ml for a 150-mm plate). Following infection, 4 volumes of 0.25% serum/DMEM were added to each plate, and the cells were incubated at 37°C. Where indicated, the cells were subsequently serum-stimulated by replacement with culture media containing 10% serum. BrdUrd incorporation was determined as described previously (9).
Flow Cytometry.
REF52 cells on 100-mm dishes were stained with propidium iodide and processed for flow cytometry as described (21).
E2F DNA Binding Assays.
E2F assays were performed as described previously (22). Supershifts with anti-DP1 antibodies were performed with 1 μl per reaction of polyclonal serum provided by J. Horowitz (Duke University).
Northern Blot Analysis.
Northern blot analysis was performed as described (9) except total RNA was isolated using the Trizol method (GIBCO/BRL). The cDNA used as probes for Northern blot analysis have been described previously (9, 23), except for the murine p15INK4B, p16INK4A, p18INK4C, p19INK4D, and p19ARF cDNAs, which were kindly provided by C. Sherr (St. Jude), and the murine cyclin E cDNA kindly provided by P. Jansen-Durr (DKF2, Heidelberg). Exon 1 specific fragments were used as probes for p15INK4B (NheI–XmnI), p16INK4A (XhoI–XmnI), and p19ARF (HinfI–HinfI) cDNAs.
Western Blot Analysis.
Cell lysates containing 40 μg of protein were subjected to SDS/PAGE on 10% polyacrylamide gels. Proteins were transferred onto poly(vinylidene difluoride) membrane as described previously (22). The poly(vinylidene difluoride) membrane was blocked in TBS (25 mM Tris, pH 7.4/137 mM NaCl/2.7 mM KCl) containing 10% skim milk for 2 hr. Blots were then incubated with primary antibodies in TBS containing 5% skim milk overnight at 4°C and subsequently washed in TBS containing 0.1% Tween 20 for 30 min. Blots were then incubated in TBS containing 5% skim milk and secondary antibodies for 1 hr at room temperature and then washed for 30 min. Blots were processed with ECL system (Amersham) as described by the manufacturer. Antibodies against E2F1 (SC-251), E2F2 (SC-633), E2F4 (SC-1082), and E2F5 (SC-1083) were from Santa Cruz Biotechnology, and anti-E2F3 mAb was a gift from J. Lees (Massachusetts Institute of Technology).
RESULTS
Differential Ability of Individual E2F Family Members to Induce S Phase and Cellular DNA Replication.
We generated a series of recombinant adenoviruses encoding each of the E2F family members to compare the ability of each protein to stimulate cell cycle progression following expression of the E2F proteins in quiescent cells (Fig. 1A). Previous studies have indicated that the heterodimeric DP1 partner appears to be in sufficient excess to allow for the overexpression of these activities without added DP1 expression. Indeed, infection of quiescent REF52 fibroblasts with each of the E2F-expressing viruses resulted in the generation of E2F-specific DNA binding activity with distinct mobilities characteristic of each individual E2F species (Fig. 1B). Importantly, these induced activities were recognized by DP1-specific antibodies, thereby demonstrating the formation of authentic E2F/DP1 heterodimers and thus the fact that DP1 was initially in excess. Less E2F3-specific DNA binding complex was detected relative to the other E2Fs, despite the use of a higher multiplicity of infection (moi) for this virus and its obvious overexpression at the protein level (Fig. 1A). Similar relative binding properties have also been observed using an E2 site containing DNA fragment (data not shown). Although we do not understand the relatively inefficient detection of E2F3 by gel shift assays, E2F3 activity was clearly present as seen by both the induction of S phase and activation of certain target genes (shown below).
Figure 1.
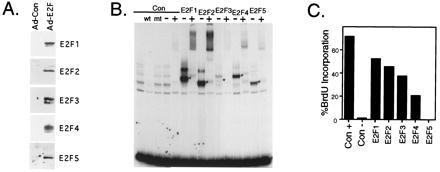
Induction of S phase by E2F family members. (A) Overexpression of each of the E2F family members in REF52 cells. REF52 cells were deprived of serum for 48 hr (0.25% serum) and then infected with either the control recombinant adenovirus (Ad-Con) or with a recombinant expressing the indicated E2F family member (E2F1, E2F2, E2F3, E2F4, or E2F5) at an moi of 75 ffu/ml for each virus. A virus expressing the DP1 protein, Ad-DP1, was coinfected (moi of 75 ffu/ml) with each E2F expressing virus. Following infection, the cells were returned to 0.25% serum media. The cells were harvested 15 hr postinfection for Western blot analysis using the corresponding antibody specific for the indicated E2F family member. (B) Production of E2F activity following infection with recombinant adenoviruses. Starved REF52 cells were infected with either the control recombinant adenovirus (Con) or with a recombinant expressing the indicated E2F family member at the following mois: Ad-Con, Ad-E2F1, Ad-E2F2, Ad-E2F4, and Ad-E2F5 at 400 ffu/ml, or Ad-E2F3 at 800 ffu/ml. Even at the elevated moi used for Ad-E2F3, less activity was produced than for the other E2Fs. Five hours postinfection, the cells were stimulated with 10% serum and then harvested 15 hr later for an electrophoretic mobility shift assay using a DHFR E2F binding site as a probe. Complexes specific for each overexpressed E2F are indicated with an asterisk. Where indicated, a polyclonal antibody against the DP1 protein (+) or control rabbit immunoglobulin (−) was added to the binding reaction after 20 min, and the reaction continued for an additional 20 min. Lanes 2 and 3 depict competition with either wildtype (wt) or mutant (mt) binding sites. (C) E2F family members induce S phase in quiescent cells. Serum starved REF52 cells were infected as described in Fig. 1B. Following infection, the cells were returned to either 10% serum media (Con+, left bar) or 0.25% serum media (other bars). Cells were labeled with BrdUrd from 12 to 30 hr, and BrdUrd incorporation was determined by indirect immunofluorescence. At least 200 nuclei were scored for BrdUrd incorporation.
The ability to express each of the E2F activities in otherwise quiescent cells allows a determination of the specific roles of the individual E2F proteins in controlling cell cycle progression. It is important to note that although we are forcing the expression of a particular E2F protein in an otherwise quiescent cell, this generates a condition not unlike that which would occur following a growth stimulation, at least for the E2F1, E2F2, and E2F3 activities, but with only one of the family members induced to accumulate. As shown in Fig. 1C, E2F1, E2F2, and E2F3, and to a lesser extent E2F4, were clearly capable of inducing S phase, as assayed by BrdUrd incorporation. In contrast, E2F5 failed to induce S phase. This is despite the fact that significant E2F5 binding activity (that contains the DP1 protein) could be detected in the infected cells (Fig. 1B). These results thus demonstrate a potential distinction in the activities of the E2F proteins with respect to the control of cell cycle progression.
Activation of Target Genes by E2F Family Members.
We have also examined the ability of the E2F proteins to transactivate endogenous target genes. A particular advantage of the use of adenovirus vectors lies in their ability to infect the entire cell population, regardless of the growth state, allowing a detailed biochemical analysis including the assessment of suspected E2F target gene expression. REF52 cells were brought to quiescence, infected with the various E2F-expressing adenoviruses, and then harvested 21 hr later for Northern blot analysis. As seen in Fig. 2A, some genes such as DNA polymerase α and cyclin E were activated by each of the E2F products, except E2F5, whereas other genes exhibited a clear differential response to the individual E2F proteins. For instance, thymidine kinase and dihydrofolate reductase (DHFR) were preferentially activated by E2F2, whereas E2F3 was the primary activator of cdk2. In contrast, ribonucleotide reductase 2, cyclin A, and cdc2 were stimulated by both E2F1 and E2F2 but only marginally by the other E2F proteins. Thus, E2F1 efficiently activates cyclin A but not cdk2, but the reverse is true for E2F3.
Figure 2.
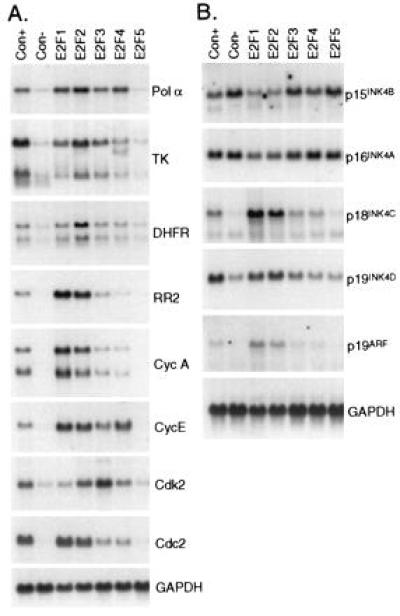
Specificity in the activation of target genes by E2F family members. (A) Activation of DNA synthesis and cell cycle regulatory genes by E2F proteins. REF52 cells were deprived of serum for 48 hr and then infected with the indicated recombinant viruses as described in Fig. 1B. Con+ was stimulated by the addition of 10% serum, and the others remained in 0.25% serum. The cells were harvested at either 18 hr (Con+) or 21 hr (others) postinfection, and poly(A)+ RNA was isolated. Poly(A)+ RNA (derived from 330 μg of total RNA per lane) was then separated by agarose gel electrophoresis, transferred to nylon membrane, and probed with the indicated cDNAs. Equivalent loading of RNA was confirmed by probing with the GAPDH cDNA. The hybridizing species in the thymidine kinase blot unique to the E2F4 sample represents cross-hybridization with a viral specific RNA. (B) Induction of CKI genes. REF52 cells were infected and harvested as described in A. Poly(A)+ RNA (derived from 400 μg of total RNA per lane) was then separated by agarose gel electrophoresis, transferred to nylon membrane, and probed with the indicated cDNAs. Exon I-specific fragments were used as probes for p15INK4B, p16INK4A, and p19ARF.
In addition to the genes that have been identified previously as E2F targets, our recent experiments have shown that E2F1 expression leads to the activation of a p16INK4a-related transcript, although not p16INK4a itself (24). The INK4 family of CKI, which includes p15INK4B, p16INK4A, p18INK4C, and p19INK4D, has been shown to bind to and inhibit cyclin D-associated cdks (25–30). A novel CKI, p19ARF, which is translated from an alternative reading frame spanning exons 2 and 3 of p16INK4A, appears to inhibit cdk activity indirectly (31). Expression of two of the INK4 family members, p15INK4B and p16INK4A, was not affected by any of the E2Fs. In contrast, E2F1 and E2F2 led to a marked increase in the levels of the p18INK4C and p19ARF transcripts and to a lesser increase of p19INK4D, correlating with the induction of these CKIs following serum stimulation (Fig. 2B). These genes were also activated by the expression of an E2F1/VP16 chimera that lacks the capacity to bind Rb (32), indicating that activation is not simply due to Rb sequestration (data not shown).
Although the expression of the E2Fs without DP1 accurately reflects the individual contributions that each E2F makes as it accumulates in late G1, other studies have indicated that the efficient generation of E2F4 and E2F5 activity depends on the coexpression of DP1 (33–35). Coexpression of DP1, again using a recombinant adenovirus, enhanced the level of each E2F activity, particularly that of E2F3, E2F4, and E2F5 as measured by gel shift assays (Fig. 3A). In addition, a substantial overexpression of each E2F protein was detected in the nucleus following cell fractionation (data not shown). Nevertheless, the coexpression of DP1 did not substantially affect the relative ability of the different E2Fs to induce S phase in quiescent fibroblasts, with E2F1, E2F2, and E2F3 activating S phase more efficiently than E2F4 and E2F5 (Fig. 3B). Moreover, coexpression of DP1 did not alter the gene activation properties of the E2F proteins (data not shown).
Figure 3.
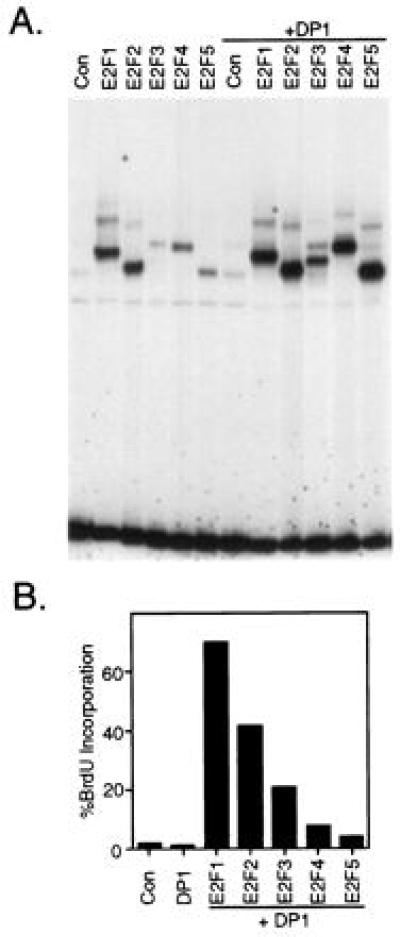
Coexpression of DP1 does not alter E2F function. (A) Coexpression of DP1 enhances the production of E2F DNA binding activity. Serum starved REF52 cells were infected as described in Fig. 1B, except where indicated. Ad-DP1 was coinfected at an moi of 400 ffu/cell together with the indicated E2F expressing virus or control (Con) virus. At 5 hr postinfection, the cells were stimulated with 10% serum and then harvested 15 hr later for an electrophoretic mobility shift assay using a DHFR E2F binding site as a probe. (B) Induction of S phase by E2F family members when coexpressed with DP1. Starved REF52 cells were infected with the indicated recombinant viruses at the following mois: Ad-E2F1, Ad-E2F2, Ad-E2F3, Ad-E2F4, Ad-E2F5 at 100 ffu/cell, Ad-DP1 at 50 ffu/cell, and Ad-Con at 150 ffu/cell. Following infection, the cells were returned to 0.25% serum. Cells were labeled with BrdUrd from 12 to 30 hr, and BrdUrd incorporation was determined as described in Fig. 1B.
We conclude from these results that E2F transcription activity plays a central role in regulating the expression of a large number of genes important for cell cycle progression and DNA replication. Moreover, our results suggest that the individual E2F activities possess distinct specificities for target gene activation and that the normal G1/S induction of this group of genes may result from the combined specificities of the individual E2F activities. Nonetheless, the ability of the different E2F proteins to contribute to target gene activation may well be influenced by factors that vary depending on either cell state or cell type.
A Unique Ability of E2F1 to Induce Apoptosis.
Previous experiments have shown that the ability of E2F1 to induce S phase is accompanied by the p53-dependent induction of apoptosis (10–13). The underlying basis for this effect is not clear, but two general possibilities seem plausible. First, the E2F-mediated induction of DNA replication may in some way be aberrant, resulting in the generation of DNA products that are recognized as abnormal by the p53 pathway. If so, we might expect that the overproduction of either E2F1, E2F2, or E2F3, and possibly E2F4 would lead to apoptosis. Alternatively, the action of E2F1 may represent a specific signal for apoptosis. As an approach to this question, we compared the ability of each E2F family member to induce apoptosis.
Quiescent REF52 cells were infected with the various E2F-expressing viruses, and apoptosis was determined by quantitating the percentage of cells with a less than G1 DNA content using flow cytometry. As seen in previous experiments, E2F1 expression induced apoptosis as indicated by the appearance of cells with a sub-G1 DNA content (Fig. 4A). In contrast, there was no induction of apoptosis in cells expressing E2F2, E2F3, E2F4, or E2F5, despite the fact that E2F2 and, to a lesser degree, E2F3 were as competent as E2F1 in inducing DNA replication.
Figure 4.
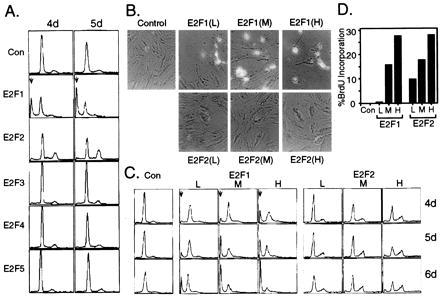
The unique capacity of E2F1 to induce apoptosis (A) E2F1, but not the other E2F family members, induces apoptosis. REF52 cells were deprived of serum for 48 hr, and then infected with the indicated recombinant viruses at an moi of 200 ffu/cell. Following infection, the cells were returned to 0.25% serum media and harvested at either 4 or 5 days postinfection for analysis by flow cytometry. The horizontal axis reflects relative DNA content, and the vertical axis represents cell number. The position of cells with less than a G1 DNA content, indicative of apoptosis, is shown by an arrow. (B) A comparison of the relative abilities of E2F1 and E2F2 to induce apoptosis. REF52 cells were deprived of serum for 48 hr and then infected with Ad-E2F1 or Ad-E2F2 at either a low (50 ffu/cell), medium (100 ffu/cell), or high (200 ffu/cell) moi. Alternatively, cells were infected with Ad-Con at 100 ffu/cell. Following infection, the cells were returned to 0.25% serum media and harvested at either 4, 5, or 6 days postinfection for analysis by flow cytometry. (C) E2F1, but not E2F2, expressing cells exhibit morphological characteristics of apoptosis. Cells from Fig. 4B were photographed at 5 days postinfection, and representative photographs are shown. (D) Both E2F1 and E2F2 induce S phase. Cells from Fig. 4B were also labeled with BrdUrd from 10 to 40 hr postinfection, and BrdUrd incorporation was determined as described in Fig. 1B.
Because E2F1 and E2F2 are equally effective in target gene activation and induction of S phase, we have undertaken a more detailed comparison of their abilities to induce apoptosis. E2F1 and E2F2 were expressed using three different mois in REF52 cells. As seen in Fig. 4B, E2F1 induced apoptosis at all three mois. In sharp contrast, E2F2 did not induce apoptosis at any moi The E2F1-, but not E2F2-, expressing cells exhibited morphological characteristics of apoptosis, including cell blebbing and chromatin condensation, and most cells had detached from the surface of the plates by 5 days postinfection (Fig. 4C). The E2F1 and E2F2 products were overexpressed at equivalent levels as measured by gel shift analysis; both proteins activated endogenous target genes to a similar extent (data not shown), and both E2F1 and E2F2 were similarly effective at inducing DNA synthesis (Fig. 4D). We conclude from these results that E2F1 can specifically induce apoptosis.
The fact that the E2F1, E2F2, and E2F3 all possess the ability to induce S phase (yet only E2F1 expression results in the induction of apoptosis) strongly suggests that this is not simply a consequence of cells replicating DNA inappropriately but rather a specific function of E2F1. To determine whether E2F1 induces a signal promoting apoptosis or whether E2F1-induced apoptosis is the result of a lack of a signal promoting cell survival that would be induced by the other E2F members, we have examined the effects of overproduction of E2F1 together with each of the other E2F activities and analyzed the cells for the induction of apoptosis by flow cytometry. As shown in Fig. 5, E2F1 induced apoptosis equally well when expressed alone or in combination with the E2F2 and/or E2F3 proteins. In contrast, coexpression of E2F2, E2F3, or both E2F2 and E2F3 proteins failed to induce apoptosis. The expression of each E2F protein in this experiment, as measured by gel shift assay, was not affected by coexpression of other E2Fs (data not shown). We thus conclude that E2F1 specifically induces apoptosis, independent of the other E2F activities.
Figure 5.
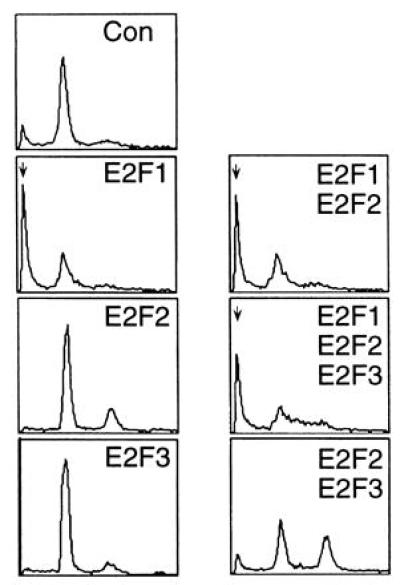
E2F1 induces apoptosis in the presence of each of the E2F activities. REF52 cells were deprived of serum for 48 hr and then were infected with the indicated E2F expressing recombinant viruses at an moi of 100 ffu/cell for each virus. Alternatively, cells were infected with Ad-Con at 100 ffu/cell. Following infection, the cells were returned to 0.25% serum media and harvested at 5 days postinfection for analysis by flow cytometry. The horizontal axis reflects relative DNA content, and the vertical axis represents cell number. The position of cells with less than a G1 DNA content, indicative of apoptosis, is shown by an arrow.
DISCUSSION
We find that the individual E2F activities display distinct effects on cell proliferation and survival, coincident with differential abilities to activate a large array of endogenous genes that encode proteins important for DNA replication and cell cycle. This finding, together with data showing an ability of E2F to stimulate cell cycle progression, argues strongly for a central and critical role for this transcription activity in promoting cell growth. Moreover, the fact that E2Fs also activate a variety of genes encoding proteins that regulate cell cycle progression, including the INK4 family members, suggests that E2F activity may play a critical role in regulating cell cycle progression.
Based on the work described here, together with other studies, it is clear that the E2F family members possess distinct activities and functions in cell growth. In particular, E2F1, E2F2, and E2F3 can efficiently activate DNA synthesis in quiescent fibroblasts, E2F4 does so only poorly and E2F5 has little or no activity in S phase induction. This distinction in roles for E2F family members, separating E2F1–3 from E2F4 and E2F5, is reflected in various other properties of the E2F proteins. E2F4 and E2F5 specifically interact with the p130 and p107 Rb family proteins (19, 34–36) and although the function of the p107-containing complex, which also includes the cyclin A protein and the cdk2 kinase (37–40), is yet to be defined, it is likely that the E2F4-p130 and E2F5-p130 complexes function as transcriptional repressors in quiescent cells (22, 41, 42). In contrast to E2F4 and E2F5, E2F1, E2F2, and E2F3 are not expressed in quiescent cells and only accumulate as cells enter G1 (ref. 41; R. Sears, K. Ohtani, G.L., J.D., and J.R.N., unpublished data).
These observations, taken together with the results presented in this study, suggest a cascade of E2F control that distinguishes roles for the E2F family members in the regulation of cell cycle progression (Fig. 6). In this model, G1 cdk mediated phosphorylation of p130 leads to the dissolution of the E2F4-p130 and E2F5-p130 repressor complexes, resulting in the derepression of various genes involved in cell growth control including the E2F1 and E2F2 genes. This derepression allows an accumulation of E2F1 and E2F2 activity (and possibly E2F3) which function in a positive manner to allow activation of genes important for DNA replication. These include the cyclin E and cdk2 genes, thereby generating additional G1 cdk activity that facilitates E2F accumulation and also kinase activity that appears to play a direct role in starting DNA replication. Finally, in addition to the activation of genes that provide positive activities for cell cycle progression, E2F1 and E2F2 uniquely activate the expression of G1 cdk inhibitory activities that include p18INK4C, p19INK4D, and p19ARF. These activities, which are normally induced in late G1 and likely contribute to the down-regulation of G1 cdk activity, may be important in allowing further cell cycle progression. The capacity of E2F to regulate activities that are important for promoting and inhibiting cell cycle progression underscores its role in transcriptional regulation of the cell cycle.
Figure 6.
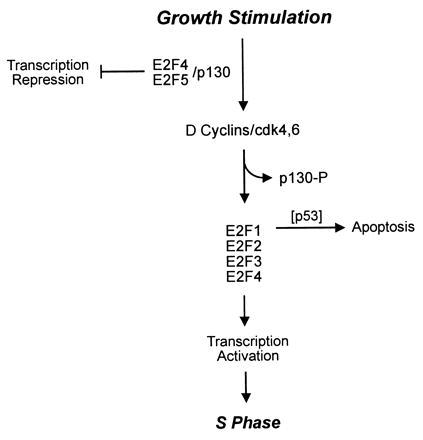
Distinct roles for E2F proteins in cell growth and apoptosis.
Our finding that the induction of apoptosis is a property unique to the E2F1 product suggests that E2F-dependent transcription and S phase induction, functions provided by E2F2 to an extent equal to E2F1, can be unlinked from apoptosis. As such, these results would suggest that E2F1-induced apoptosis is not simply the consequence of the induction of an abnormal S phase entry but rather may represent an intrinsic property of E2F1. In addition, the E2F1 induction of apoptosis is not due simply to an imbalance of total E2F activity as seen by the ability of E2F1 to induce cell death whether other E2F proteins are produced or not.
Given the fact that the various E2F gene products do display some specificity with respect to target gene activation, it is possible that E2F1 has the unique ability to activate a gene or genes that initiate the cell death program. It is also possible that the unique ability of E2F1 to induce apoptosis could reflect differential interactions, either direct or indirect, with proteins known to participate in the apoptosis pathway, including p53 (43). Indeed, our recent experiments suggest an ability of E2F1, but not E2F2, to induce an accumulation of p53 (T. Kowalik, J.D., G.L., and J.R.N., unpublished data). Perhaps p53 monitors the E2F pathway, specifically through the accumulation of E2F1, as a means to assess the initiation of a cell growth signal transduction pathway that may or may not be accompanied by the other necessary signal transduction pathways essential for a normal proliferative process. In this view, E2F1 would serve as a signal to start an apoptosis pathway that would be blocked under conditions of proliferation by the action of other pathways associated with normal cell proliferation (Fig. 6).
Finally, two recent studies describing the consequences of the disruption of the E2F1 gene in the mouse (44, 45) suggest a role for E2F1 in the induction of apoptosis in a physiological context of thymocyte maturation. The E2F1 deficiency results in both an excess of mature T cells due to a maturation stage-specific defect in thymocyte apoptosis as well as the genesis of a diverse range of tumors in older adults. The latter phenotype could be due to either the failure of cells to undergo apoptosis or to the loss of proliferation control. Although it has been suggested that E2F1 might function as a tumor suppressor in conjunction with Rb (44) (as a consequence of the transcriptional repression of growth regulatory genes) we would suggest that the unique ability of E2F1 to induce apoptosis could contribute to the increased incidence of tumors observed in the E2F1 mutant mice. These results, coupled with the observation that E2F1 uniquely induces apoptosis, strongly suggest that E2F1 may play a role in cell death determinations in normal, physiologically important contexts. One possibility, in keeping with paradigms seen from the DNA tumor viruses, is a role for other targets of signal transduction pathways associated with normal, productive proliferative events in countering the action of the E2F1 protein. For instance, E1A-mediated apoptosis is countered in adenovirus infections by the action of the 55-kDa and 19-kDa E1B proteins that target the p53 protein and the Bax protein, respectively. Cellular counterparts to these viral anti-apoptotic proteins, which could include the Mdm2 protein and Bcl2, may represent important signaling molecules activated during a normal growth response. In the absence of such balancing activities, the action of E2F1 would lead to the initiation of a cell death pathway. In this view, E2F1 provides a constant signal for apoptosis that must always be blocked by a cell survival event. As such, this might represent one mechanism to insure that a normal and complete proliferative process was underway.
Acknowledgments
We thank Mike Cook and Alan Fisher of the Duke Comprehensive Cancer Center Flow Cytometry Facility for the flow cytometric analysis; Charles Sherr, Pidder Jansen-Durr, Jacqueline Lees, Jonathan Horowitz, and Robert Weinberg for the generous gift of reagents; Kaye Culler for assistance in the preparation of the manuscript; and Rachel Rempel for providing critical comments. J.D. is supported by a National Institutes of Health postdoctoral fellowship and the Howard Hughes Medical Institute. A.M. is supported by a National Institutes of Health training grant. G.L. is supported by a fellowship from the Medical Research Council of Canada and the Alberta Heritage Foundation for Medical Research.
ABBREVIATIONS
- cdk
cyclin-dependent kinase
- ffu
focus-forming unit
- DHFR
dihydrofolate reductase
- moi
multiplicity of infection
- CKI
cyclin-dependent kinase inhibitors
References
- 1.Sherr C J. Cell. 1993;73:1059–1065. doi: 10.1016/0092-8674(93)90636-5. [DOI] [PubMed] [Google Scholar]
- 2.Hunter T. Cell. 1993;75:839–841. doi: 10.1016/0092-8674(93)90528-x. [DOI] [PubMed] [Google Scholar]
- 3.Nevins J R. Science. 1992;258:424–429. doi: 10.1126/science.1411535. [DOI] [PubMed] [Google Scholar]
- 4.Helin K, Harlow E. Trends Cell Biol. 1993;3:43–46. doi: 10.1016/0962-8924(93)90150-y. [DOI] [PubMed] [Google Scholar]
- 5.La Thangue N B. Trends Biochem Sci. 1994;19:108–114. doi: 10.1016/0968-0004(94)90202-x. [DOI] [PubMed] [Google Scholar]
- 6.Sherr C J, Roberts J M. Genes Dev. 1995;9:1149–1163. doi: 10.1101/gad.9.10.1149. [DOI] [PubMed] [Google Scholar]
- 7.Weinberg R A. Cell. 1995;81:323–330. doi: 10.1016/0092-8674(95)90385-2. [DOI] [PubMed] [Google Scholar]
- 8.Hunter T, Pines J. Cell. 1994;79:573–582. doi: 10.1016/0092-8674(94)90543-6. [DOI] [PubMed] [Google Scholar]
- 9.DeGregori J, Kowalik T, Nevins J R. Mol Cell Biol. 1995;15:4215–4224. doi: 10.1128/mcb.15.8.4215. [DOI] [PMC free article] [PubMed] [Google Scholar]
- 10.Kowalik T F, DeGregori J, Schwarz J K, Nevins J R. J Virol. 1995;69:2491–2500. doi: 10.1128/jvi.69.4.2491-2500.1995. [DOI] [PMC free article] [PubMed] [Google Scholar]
- 11.Wu X, Levine A J. Proc Natl Acad Sci USA. 1994;91:3602–3606. doi: 10.1073/pnas.91.9.3602. [DOI] [PMC free article] [PubMed] [Google Scholar]
- 12.Qin X-Q, Livingston D M, Kaelin W G, Adams P D. Proc Natl Acad Sci USA. 1994;91:10918–10922. doi: 10.1073/pnas.91.23.10918. [DOI] [PMC free article] [PubMed] [Google Scholar]
- 13.Shan B, Lee W. Mol Cell Biol. 1994;14:8166–8173. doi: 10.1128/mcb.14.12.8166. [DOI] [PMC free article] [PubMed] [Google Scholar]
- 14.Schwarz J K, Bassing C H, Kovesdi I, Datto M B, Blazing M, George S, Wang X, Nevins J R. Proc Natl Acad Sci USA. 1995;92:483–487. doi: 10.1073/pnas.92.2.483. [DOI] [PMC free article] [PubMed] [Google Scholar]
- 15.Nevins J R. Methods Enzymol. 1980;65:768–785. doi: 10.1016/s0076-6879(80)65072-1. [DOI] [PubMed] [Google Scholar]
- 16.DeGregori J, Leone G, Ohtani K, Miron A, Nevins J R. Genes Dev. 1995;9:2873–2887. doi: 10.1101/gad.9.23.2873. [DOI] [PubMed] [Google Scholar]
- 17.Ivey-Hoyle M, Conroy R, Huber H E, Goodhart P J, Oliff A, Heimbrook D C. Mol Cell Biol. 1993;13:7802–7812. doi: 10.1128/mcb.13.12.7802. [DOI] [PMC free article] [PubMed] [Google Scholar]
- 18.Lees J A, Saito M, Valentine M, Look T, Harlow E, Dyson N, Helin K. Mol Cell Biol. 1993;13:7813–7825. doi: 10.1128/mcb.13.12.7813. [DOI] [PMC free article] [PubMed] [Google Scholar]
- 19.Sardet C, Vidal M, Cobrinik D, Geng Y, Onufryk C, Chen A, Weinberg R A. Proc Natl Acad Sci USA. 1995;92:2403–2407. doi: 10.1073/pnas.92.6.2403. [DOI] [PMC free article] [PubMed] [Google Scholar]
- 20.Krek W, Xu G, Livingston D M. Cell. 1995;83:1149–1158. doi: 10.1016/0092-8674(95)90141-8. [DOI] [PubMed] [Google Scholar]
- 21.Smith E J, Leone G, DeGregori J, Jakoi L, Nevins J R. Mol Cell Biol. 1996;16:6965–6976. doi: 10.1128/mcb.16.12.6965. [DOI] [PMC free article] [PubMed] [Google Scholar]
- 22.Ikeda M-A, Jakoi L, Nevins J R. Proc Natl Acad Sci USA. 1996;93:3215–3220. doi: 10.1073/pnas.93.8.3215. [DOI] [PMC free article] [PubMed] [Google Scholar]
- 23.Ohtani K, DeGregori J, Leone G, Herendeen D R, Kelly T J, Nevins J R. Mol Cell Biol. 1996;16:6977–6984. doi: 10.1128/mcb.16.12.6977. [DOI] [PMC free article] [PubMed] [Google Scholar]
- 24.Khleif S N, DeGregori J, Yee C L, Otterson G A, Kaye F J, Nevins J R, Howley P M. Proc Natl Acad Sci USA. 1996;93:4350–4354. doi: 10.1073/pnas.93.9.4350. [DOI] [PMC free article] [PubMed] [Google Scholar]
- 25.Chan F K M, Zhang J, Cheng L, Shapiro D N, Winoto A. Mol Cell Biol. 1995;15:2682–2688. doi: 10.1128/mcb.15.5.2682. [DOI] [PMC free article] [PubMed] [Google Scholar]
- 26.Serrano M, Hannon G J, Beach D. Nature (London) 1993;366:704–707. doi: 10.1038/366704a0. [DOI] [PubMed] [Google Scholar]
- 27.Hannon G J, Beach D. Nature (London) 1994;371:257–261. doi: 10.1038/371257a0. [DOI] [PubMed] [Google Scholar]
- 28.Guan K-L, Jenkins C W, Li Y, Nichols M A, Wu X, O’Keefe C L, Matera A G, Xiong Y. Genes Dev. 1994;8:2939–2952. doi: 10.1101/gad.8.24.2939. [DOI] [PubMed] [Google Scholar]
- 29.Hirai H, Roussel M F, Kato J-Y, Ashmun R A, Sherr C J. Mol Cell Biol. 1995;15:2672–2681. doi: 10.1128/mcb.15.5.2672. [DOI] [PMC free article] [PubMed] [Google Scholar]
- 30.Quelle D E, Ashmun R A, Hannon G J, Rehberger P A, Trono D, Richter H, Walker C, Beach D, Sherr C J, Serrano M. Oncogene. 1995;11:635–645. [PubMed] [Google Scholar]
- 31.Quelle D E, Zindy F, Ashmun R A, Sherr C J. Cell. 1995;83:993–1000. doi: 10.1016/0092-8674(95)90214-7. [DOI] [PubMed] [Google Scholar]
- 32.Johnson D G, Cress W D, Jakoi L, Nevins J R. Proc Natl Acad Sci USA. 1994;91:12823–12827. doi: 10.1073/pnas.91.26.12823. [DOI] [PMC free article] [PubMed] [Google Scholar]
- 33.Ginsberg D, Vairo G, Chittenden T, Xiao Z, Xu G, Wydner K L, DeCaprio J A, Lawrence J B, Livingston D. Genes Dev. 1994;8:2665–2679. doi: 10.1101/gad.8.22.2665. [DOI] [PubMed] [Google Scholar]
- 34.Beijersbergen R L, Kerkhoven R M, Zhu L, Carlee L, Voorhoeve P M, Bernards R. Genes Dev. 1994;8:2680–2690. doi: 10.1101/gad.8.22.2680. [DOI] [PubMed] [Google Scholar]
- 35.Hijmans E M, Voorhoeve P M, Beijersbergen R L, van’T Veer L J, Bernards R. Mol Cell Biol. 1995;15:3082–3089. doi: 10.1128/mcb.15.6.3082. [DOI] [PMC free article] [PubMed] [Google Scholar]
- 36.Vairo G, Livingston D M, Ginsberg D. Genes Dev. 1995;9:869–881. doi: 10.1101/gad.9.7.869. [DOI] [PubMed] [Google Scholar]
- 37.Devoto S H, Mudryj M, Pines J, Hunter T, Nevins J R. Cell. 1992;68:167–176. doi: 10.1016/0092-8674(92)90215-x. [DOI] [PubMed] [Google Scholar]
- 38.Cao L, Faha B, Dembski M, Tsai L H, Harlow E, Dyson N. Nature (London) 1992;355:176–179. doi: 10.1038/355176a0. [DOI] [PubMed] [Google Scholar]
- 39.Pagano M, Draetta G, Jansen-Durr P. Science. 1992;255:1144–1147. doi: 10.1126/science.1312258. [DOI] [PubMed] [Google Scholar]
- 40.Shirodkar S, Ewen M, DeCaprio J A, Morgan J, Livingston D M, Chittenden T. Cell. 1992;68:157–166. doi: 10.1016/0092-8674(92)90214-w. [DOI] [PubMed] [Google Scholar]
- 41.Moberg K, Starz M A, Lees J A. Mol Cell Biol. 1996;16:1436–1449. doi: 10.1128/mcb.16.4.1436. [DOI] [PMC free article] [PubMed] [Google Scholar]
- 42.Johnson D G. Oncogene. 1995;11:1685–1692. [PubMed] [Google Scholar]
- 43.O’Connor D J, Lam E W-F, Griffin S, Zhong S, Leighton L C, Burbidge S A, Lu X. EMBO J. 1995;14:6184–6192. doi: 10.1002/j.1460-2075.1995.tb00309.x. [DOI] [PMC free article] [PubMed] [Google Scholar]
- 44.Yamasaki L, Jacks T, Bronson R, Goillot E, Harlow E, Dyson N J. Cell. 1996;85:537–548. doi: 10.1016/s0092-8674(00)81254-4. [DOI] [PubMed] [Google Scholar]
- 45.Field S J, Tsai F-Y, Kuo F, Zubiaga A M, Kaelin W G, Jr, Livingston D M, Orkin S H, Greenberg M E. Cell. 1996;85:549–561. doi: 10.1016/s0092-8674(00)81255-6. [DOI] [PubMed] [Google Scholar]