

Abstract
Bacterial chemotaxis is widely studied because of its accessibility and because it incorporates processes that are important in a number of sensory systems: signal transduction, excitation, adaptation, and a change in behavior, all in response to stimuli. Quantitative data on the change in behavior are available for this system, and the major biochemical steps in the signal transduction/processing pathway have been identified. We have incorporated recent biochemical data into a mathematical model that can reproduce many of the major features of the intracellular response, including the change in the level of chemotactic proteins to step and ramp stimuli such as those used in experimental protocols. The interaction of the chemotactic proteins with the motor is not modeled, but we can estimate the degree of cooperativity needed to produce the observed gain under the assumption that the chemotactic proteins interact directly with the motor proteins.
Chemotaxis (or more accurately, chemokinesis), the process by which a cell alters its speed or frequency of turning in response to an extracellular chemical signal, has been most thoroughly studied in the peritrichous bacterium Escherichia coli. E. coli exhibits sophisticated responses to many beneficial or harmful chemicals. In isotropic environments the cell swims about in a random walk produced by alternating episodes of counterclockwise (CCW) and clockwise (CW) flagellar rotation. CCW rotation pushes the cell forward in a fairly straight “run,” CW rotation triggers a random “tumble” that reorients the cell. The durations of both runs and tumbles are exponentially distributed, with means of 1.0 s and 0.1 s, respectively (1). In a chemoeffector gradient, the cell carries out chemotactic migration by extending runs that happen to carry it in favorable directions. Using specific chemoreceptors to monitor its chemical environment, E. coli perceives spatial gradients as temporal changes in attractant or repellent concentration. The cell in effect compares its environment during the past second with the previous 3–4 s and responds accordingly. Attractant increases and repellent decreases transiently raise the probability of CCW rotation, or “bias,” and then a sensory adaptation process returns the bias to baseline, enabling the cell to detect and respond to further concentration changes. The response to a small step change in chemoeffector concentration in a spatially uniform environment occurs over a 2- to 4-s time span (2). Saturating changes in chemoeffector concentration can increase the response time to several minutes (3).
Many bacterial chemoreceptors belong to a family of transmembrane methyl-accepting chemotaxis proteins (MCPs) (reviewed in ref. 4). Among the best-studied MCPs is Tar, the E. coli receptor for the attractant aspartate. Tar has a periplasmic binding domain and a cytoplasmic signaling domain that communicates with the flagellar motors via a phosphorelay sequence involving the CheA, CheY, and CheZ proteins (see Fig. 1). CheA, a histidine kinase, first autophosphorylates and then transfers its phosphoryl group to CheY.
Figure 1.

Signaling components and pathways for E. coli chemotaxis. Chemoreceptors (MCPs) span the cytoplasmic membrane (hatched lines), with a ligand-binding domain deployed on the periplasmic side and a signaling domain on the cytoplasmic side. The cytoplasmic Che signaling proteins are identified by single letters—e.g., A = CheA. MCPs form stable ternary complexes with the CheA and CheW proteins to generate signals that control the direction of rotation of the flagellar motors. The signaling currency is in the form of phosphoryl groups (∼P), made available to the CheY and CheB effector proteins through autophosphorylation of CheA. CheYp initiates flagellar responses by interacting with the motor to enhance the probability of clockwise rotation. CheBp is part of a sensory adaptation circuit that terminates motor responses. MCP complexes have two alternative signaling states. In the attractant-bound form, the receptor inhibits CheA autokinase activity; in the unliganded form, the receptor stimulates CheA activity. The overall flux of phosphoryl groups to CheB and CheY reflects the proportion of signaling complexes in the inhibited and stimulated states. Changes in attractant concentration shift this distribution, triggering a flagellar response. The ensuing changes in CheB phosphorylation state alter its methylesterase activity, producing a net change in MCP methylation state that cancels the stimulus signal (see ref. 4 for a review).
Phospho–CheY interacts with switch proteins in the flagellar motors to augment CW rotation, CCW being the default state in the absence of Phospho–CheY. CheZ assists in dissipating CW signals by enhancing the dephosphorylation of CheY. Tar controls the flux of phosphate through this circuit by forming a stable ternary complex (Tar/CheW/CheA) that modulates CheA autophosphorylation in response to changes in ligand occupancy or methylation state. CheA phosphorylates more slowly when the receptor is occupied than when it is not.
Changes in MCP methylation state are responsible for sensory adaptation. Tar has four residues that are reversibly methylated by a methyltransferase, CheR, and demethylated by a methylesterase, CheB. CheR activity is unregulated, whereas CheB, like CheY, is activated by phosphorylation via CheA. Thus, receptor methylation level is regulated by feedback signals from the signaling complex, which can probably shift between two conformational states having different rates of CheA autophosphorylation. Attractant binding and demethylation shift the equilibrium toward a low CheA activity state; attractant release and methylation shift the equilibrium toward a high CheA activity state. A receptor complex that is bound to attractant but not highly methylated can be thought of as a “sequestered” state (5) which is unable to autophosphorylate at a significant rate.
E. coli can sense and adapt to ligand concentrations that range over five orders of magnitude (5). In addition, the machinery for detection and transduction is exquisitely sensitive to chemical stimuli. The cell can respond to exponential increases (“ramps”) in attractant levels that correspond to rates of change in fractional occupancy of only 0.1% per second. Consequently, the cell can respond even if only a small fraction of its receptors have changed occupancy state during a typical sampling period.
These experimental observations raise several questions. First, how does the cell achieve the extreme sensitivity that is observed? Second, why are there multiple methylation states of the receptor? In this paper we describe a mathematical model based on known kinetic properties of Tar and the phosphorelay signaling components that accounts for this exquisite sensitivity. In the model, excitation results from the reduction in the autophosphorylation rate of CheA when Tar is bound to a ligand, and adaptation arises from methylation of the receptor. The disparity in the time scales of these processes produces a “derivative-” or “temporal-sensing” mechanism with respect to the ligand concentration. The model makes essential use of the multiple methylation states to achieve adaptation, and can be used to derive quantitative relations between certain key rates and the behavioral responses to experimental protocols, and to predict the cooperativity needed to achieve the observed gain.
A Qualitative Description of the Response to Different Stimuli
We assume that Tar is the only receptor type, that the Tar–CheA–CheW complex does not dissociate, and that Tar, CheA, and CheW are found only in this complex. We also assume that methylation of the multiple sites occurs in a specified order (6, 7). Our primary objective is to model the response to attractant, which probably involves only increases in the average methylation level above the unstimulated level of about 1.5–2 methyl esters per transducer (8). For this reason and for simplicity, we consider only the three highest methylation states of Tar. In the model we postulate that only the phosphorylated form of CheB (CheBp) has demethylation activity. We assume that the phosphorylation state of CheA does not affect the ligand-binding reactions of the receptor with which it forms a complex, and does not affect the activities of CheR or CheBp. We further assume that the formation of a complex between Tar and CheR does not affect the ligand-binding properties of Tar, and that it does not affect the autophosphorylation rate of the attached CheA until the transition to the more highly methylated state (and dissociation of the complex) occurs. We assume that CheZ activity is unmodulated, although it has been suggested (9) that an as-yet-unidentified mechanism for modulating CheZ activity could account for the observed gain. Later we consider the case of modulated CheZ activity. Finally, we assume that the rates of the phosphotransfer reactions between CheA and CheY or CheB are not affected by the occupancy or methylation state of the receptor.
In Fig. 2 we illustrate the receptor states and the network of transitions between them that are used in the model. Details of the phosphotransfer reactions are shown in Fig. 3, together with the dephosphorylation reactions for CheB and CheY. The details of the reactions in these figures are given in Table 1. Before we introduce the equations we present a qualitative description of how the system works.
Figure 2.

The ligand-binding, phosphorylation, and methylation reactions of the Tar–CheA–CheW complex, denoted by T. LT indicates a ligand-bound complex. Vertical transitions involve ligand binding and release, horizontal transitions involve methylation and demethylation, and front-to-rear transitions involve phosphorylation and the reverse involve dephosphorylation. The details of the phosphotransfer steps are depicted in Fig. 3. Numerical subscripts indicate the number of methylated sites on Tar, and a subscript p indicates that CheA is phosphorylated. The rates for the labeled reaction pairs are given in Table 3.
Figure 3.
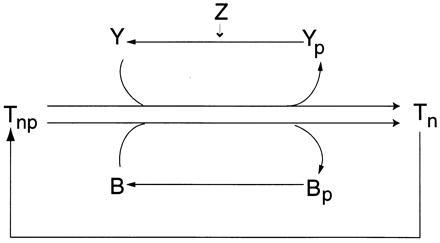
Detail of the phosphotransfer reactions corresponding to the labels 8–13 in Fig. 2.
Table 1.
| Description | Reaction labels | Kinetics and rate labels | |
|---|---|---|---|
| Methylation (first order kinetics) | 1–4 |
|
|
| Methylation (Michaelis– Menten kinetics) | 1–4 |
|
|
| Demethylation | 1–4 |
|
|
| Ligand binding | 5–7 |
|
|
| Autophosphorylation | 8–13 |
|
|
| Phosphotransfer | 8–13 |
|
|
|
|||
| Dephosphorylation |
|
||
|


First consider the response of the network to a step increase in attractant. The ligand-binding reactions are the fastest, so the first component of the response is a shift in the distribution of states toward the ligand-bound states (i.e., from states at the top to those at the bottom in Fig. 2). This increases the fraction of receptors in the sequestered states (LT2, LT2p, and possibly LT3, LT3p), and because these states have the same phosphotransfer rates but much lower autophosphorylation rates than the corresponding ligand-free states, the distribution subsequently shifts toward states containing unphosphorylated CheA. This in turn leads to a reduction in CheYp, a decreased rate of tumbling, and an increase in the run length. This constitutes the excitation response of the system.
Next methylation and demethylation, which are the slowest reactions, begin to exert an effect. CheR methylates ligand-bound receptors more rapidly than unbound receptors, and the decrease in CheAp that results from excitation causes a decrease in the level of CheBp, thereby reducing the rate of demethylation. As a result, the distribution shifts toward higher methylation states. However, autophosphorylation of CheA is faster, the higher the methylation state of the Tar–CheA–CheW complex, and therefore in the last phase of the response there is a shift toward the states containing CheAp via transitions along the right face of the network. Consequently, the net effect of an increase in attractant is to shift the distribution of receptor states toward those which are ligand-bound and more highly methylated, but the total level of receptor complex containing CheAp (the sum of the states at the rear face of the network) returns to baseline. As a result, the total phosphotransfer rate from CheAp species to CheY returns to the prestimulus level, which means that CheYp returns to its prestimulus level. Under the assumption that only CheYp and CheY interact with the motor complex, this in turn implies that the bias returns to its prestimulus level. Thus the cell can respond to an increase in ligand by a transient decrease in tumbling, but it adapts to a constant background level of ligand and retains sensitivity to further changes in the ligand concentration. Of course this qualitative description must be supplemented by numerical results which demonstrate that the model can also produce quantitatively correct results using experimentally based rate coefficients. This is done in the following section.
In ref. 10 we examine the response of a simplified model that incorporates just two methylation states to step changes and to a slow exponential ramp. The results of this analysis impose different conditions on the methylation and demethylation rates, because a significant ramp response results only when these rates are considerably slower than those which reproduce observed adaptation times to small steps. To capture both of these responses a model must contain at least three methylation states, and the transitions between the lowest and intermediate methylation states must be considerably faster than the transitions between the intermediate and highest states. In such a scheme the adaptation time to small steps is controlled by the transitions between the doubly and triply methylated states in Fig. 2, and the ramp response is controlled by the slower transitions between the triply and fully methylated states. The three-methylation-state model described in the following section also captures the correct time scale for the adaptation response to saturating levels of attractant.
A Three-State Model Captures the Ramp, Step, and Saturation Responses
A minimal model must have three methylation states, and we assume faster methylation and demethylation rates for transitions between the two lowest methylation states, and slower transition rates between the two highest methylation states. We use Michaelis–Menten methylation kinetics, since CheR activity is thought to be saturated under normal conditions (11). This precludes an analytical derivation of the relationships between kinetic parameters which guarantee perfect adaptation, by which we mean that the bias returns precisely to baseline in the face of any constant attractant level below saturation, (10). Instead we have tuned the rate constants of the full system by trial and error so that it adapts well over a large range of ligand concentrations.
The mathematical description of the model is based on mass action kinetics for all the steps except methylation. Because the equations that govern the evolution of the amounts in the various states of the receptor complex are similar and easy to derive, we only display one of them, and we indicate the process contributing to the rate of change beneath the corresponding rate expression.
 |
1 |
 |
We write the equations for CheYp and CheBp as
 |
2 |
 |
3 |
where P ≡ T2p + LT2p + T3p + LT3p + T4p + LT4p is the total amount of phosphorylated receptor complex. In addition, the total amounts of T, Y, B, and R are conserved. These four conditions can be used to eliminate four variables, which was done for Y and B in Eqs. 2 and 3, and the resulting system can be integrated numerically, using the parameter values given in the tables. As we remarked earlier, we assume that the motor interacts only with CheYp and possibly CheY, and in view of the small number of motor complexes in a cell, we further assume that the motor does not affect the budgets of these species. It then follows from the conservation of Y that perfect adaptation of the bias only requires perfect adaptation of CheYp.
The responses obtained from this three-methylation-state model are shown in Fig. 4A–C and the concentrations and rates used are listed and compared with measured values in Tables 2 and 3. The system exhibits both a significant response to a slow ramp and an appropriate adaptation time for a small step. It also exhibits the correct adaptation time to a saturating step in ligand concentration.
Figure 4.

Response of the system depicted in Fig. 2 to various chemoattractant (aspartate) stimulus protocols: a ramp of rate 0.015 s−1 (Left), a step at t = 10 s from zero concentration to a concentration (0.11 μM) that is 11% of the Kd for ligand binding (Center), and a step at t = 100 s from zero concentration to a concentration (1 mM) that is 1,000 times the Kd for ligand binding (Right). Time series in the top row of figures are for Che Yp (solid line), CheBp (short dashes), and aspartate (long dashes). The concentrations and rates used are listed and compared to measured values in Tables 2 and 3. The maximum change in [Che Yp] from baseline for both the ramp and small step responses is 9%. Time series in the bottom row are the corresponding bias responses, using a Hill coefficient of 11 for binding of both Che Yp and the competitive inhibitor Che Y to the motor. (Compare the left trace to figure 4A in ref. 12; the center trace to figure 4 in ref. 2, figure 2 in ref. 14, and figure 8 in ref. 13; and the right trace to figure 8 in ref.3.
Table 2.
Conserved quantities used in the model (see ref. 3)
| Species | T | R | B | Y | Z |
|---|---|---|---|---|---|
| Concentration, μM | 8 | 0.3 | 1.7 | 20 | 40 |
Table 3.
Rates used in the model, and corresponding values from the literature
| Reaction | Rate constant | Value | Literature value | Ref. |
|---|---|---|---|---|
| T2R → T3 + R | k1c | 0.17 s−1 | 0.17 s−1 | 12 |
| T3R → T4 + R | k2c | 0.1k1c | >0.02k1c* | 13 |
| LT2R → LT3 + R | k3c | 30k1c | 15k1c − 30k1c† | 13 |
| LT3R → LT4 + R | k4c | 30k2c | 15k2c − 30k2c† | 13 |
| Tn + R ⇌ TnR | k1b/k1a, … , k4b/k4a | 1.7 μM | 1.7 μM | 12 |
| T3 + Bp → T2 + Bp | k−1 | 4 × 10⁵ M−1⋅s−1 | 3 × 10⁴ M−1⋅s−1 | 11 |
| T4 + Bp → T3 + Bp | k−2 | 3 × 10⁴ M−1⋅s−1 | >3.0k−1‡ | 13 |
| LT3 + Bp → LT2 + Bp | k−3 | k−1 | k−1§ | 13 |
| LT4 + Bp → LT3 + Bp | k−4 | k−2 | k−2§ | 13 |
| L + T → LT | k5, k6, k7 | 7 × 10⁷ M−1⋅s−1 | 7 × 10⁷ M−1⋅s−1 | 3¶ |
| LT → L + T | k−5, k−6, k−7 | 70 s−1 | 70 s−1 | 3¶ |
| T2 → T2p | k8 | 15 s−1 | 17 s−1 | 14 |
| T3 → T3p | k9 | 3k8 | ||
| T4 → T4p | k10 | 3.2k8 | ||
| LT2 → LT2p | k11 | 0 | ||
| LT3 → LT3p | k12 | 1.1k8 | ||
| LT4 → LT4p | k13 | 0.72k10 | k10 | 15 |
| B + Tnp → Bp + Tn | kb | 8 × 10⁵ M−1⋅s−1 | 8 × 10⁵ M−1⋅s−1 | 11‖ |
| Y + Tnp → Yp + Tn | ky | 3 × 10⁷ M−1⋅s−1 | 3 × 10⁷ M−1⋅s−1 | 14 |
| Bp → B | k−b | 0.35 s−1 | 0.35 s−1 | 14 |
| Yp + Z → Y + Z | k−y | 5 × 10⁵ M−1⋅s−1 | 5 × 10⁵ M−1⋅s−1 | 14 |
Methylation rates of different methylation sites vary by a factor of up to 50.
Ligand binding increases methylation rates of different methylation sites by a factor of 15–30.
Demethylation rates of different methylation sites vary by a factor of up to 3.
Ligand binding has little effect on demethylation rate.
Estimated from figure 10 in ref. 3.
Estimated from figure 3 in ref. 11.
Analysis of the Gain
In the preceding figures we have chosen the step size so that the maximum deviations of the CheYp concentration from baseline are equal in Fig. 4A and B, and thus the maximum change in bias in response to the corresponding ramp (0.015 s−1) and step (11% change in receptor occupancy) will be the same. Experimentally it is found that the maximum change in bias in response to this ramp is about 0.3 (figure 4A in ref. 16), and so our model, coupled with a scheme for the interaction of CheYp with the motor, would produce a maximum gain of about 0.3/0.11 = 2.73 in response to the step used in Fig. 4B. This is consistent with the finding (17) that the maximum gain is about 6, though not with the much higher gain of 55 reported (18). The model thus demonstrates that ramp experiment results are consistent with the lower estimates regarding the gain for small steps. However the source of the gain remains undetermined, because even though the deviations of CheYp concentration from baseline are significant (≈9%), they are small compared with the reported change (0.3) in bias for this ramp stimulus (16). Thus one or more mechanisms to amplify the internal CheYp signal must be involved, and the major possibilities are cooperative effects in the interaction of CheY species with the motor and modulation of CheZ activity.
To explore these possibilities, we define the gain as
 |
4 |
where b is the bias, or probability that a flagellum will be rotating CCW, and p ≡ kyP is the pseudo-first order rate constant for phosphorylation of CheY. We have chosen this definition of gain for mathematical convenience, but it can be shown (10) that for small steps this definition of g is consistent with the definition of gain given in ref. 17, namely, the change in bias per percent change in receptor occupancy.
When the phosphorylation reactions are at pseudo-equilibrium, one can show that
 |
5 |
where y ≡ Yp/Y0 ∈ [0,1] is the dimensionless amount of CheY in phosphorylated form, and p and z ≡ k-y Z are the production and loss coefficients, respectively, of y. We note that
 |
6 |
Thus without modulation of CheZ activity, the fractional change in CheYp levels must be less than the change in receptor occupancy, so that no signal amplification is possible upstream of the interaction of CheY and CheYp with the motor.
To examine the effect on the gain of cooperative interactions of CheY species at the motor and modulation of CheZ activity, we expand Eq. 4, using Eq. 5, to obtain
 |
7 |
Here v ≡ −y(1 − y)db/dy is the gain due only to cooperative interaction of CheY with the motor, and w ≡ −dlnz/dlnp is, for small steps at least, the fractional change in CheZ activity per fractional change in receptor occupancy (10). We have assumed here that CheZ does not interact directly with the motor (19), and acts only by dephosphorylating CheY. This expression makes it clear that the two possible sources of cooperativity act multiplicatively.
To determine the gain achievable, consider first the factor v. We assume that CheY species interact with the motor by binding to the flagellar switch, and we allow for the possibility that both CheYp and unphosphorylated CheY may bind (19). Interaction with the motor may involve cooperativity, either via cooperative binding, or possibly via some cooperative interaction among subunits of the switch which bind individually to CheY molecules. Here we consider the first possibility (the second is treated in ref. 10), and we assume that a motor unit binds either Che Y or Che Yp according to
 |
8 |
 |
9 |
Here j and k are the number of molecules of CheYp and CheY, respectively, which bind to the motor, M represents motor unbound to either CheY species, M(Yp)j represents motor in complex with Yp , and M(Y)k represents motor in complex with Y. We assume that the binding reactions Eqs. 8 and 9 equilibrate rapidly, and study only the steady-state quantities
 |
10 |
 |
11 |
 |
12 |
Here M0 is the total concentration of motor, and Aj and Ak are the ratios of the association and dissociation constants for CheYp and unphosphorylated CheY, respectively.
We assume that the unbound motor M exists in CCW mode with probability one (19), and that the Mj and Mk states have probabilities fj and fk, respectively, of being in CCW mode. Then the bias is given by
 |
13 |
One can show that the optimal values of fj and fk are 0 and 1, respectively (10), and using these v is given by
 |
14 |
where ak = Ak(1 −
y)k and  is the baseline
CheYp concentration. Because this expression is
monotonically increasing in ak,
v(ȳ) is maximized with respect to
ak when ak is as large as
possible, indicating that both CheY species should have strong binding
affinities for the flagellar switch. In the limit as
ak → ∞, Eq. 14 becomes
is the baseline
CheYp concentration. Because this expression is
monotonically increasing in ak,
v(ȳ) is maximized with respect to
ak when ak is as large as
possible, indicating that both CheY species should have strong binding
affinities for the flagellar switch. In the limit as
ak → ∞, Eq. 14 becomes
 |
15 |
Finally, maximizing Eq. 15 with respect to ȳ (subject to ȳ ∈ [0, 1]) shows that the maximum possible gain at the flagellar switch is
 |
16 |
Thus, a gain of 2.7 requires a Hill coefficient of at least 11 if the only cooperativity is in the interaction of CheY species with the switch. In Fig. 4 D–F we show the bias resulting from the CheYp response in Fig. 4 A–C using a Hill coefficient of 11 for both CheY species (j = k = 11).
The full expression for the gain now becomes
 |
17 |
and so the fractional change in CheZ activity relative to the fractional change in receptor occupancy is
 |
18 |
Thus, without cooperative effects at the switch, we must have w ≥ 10, and for moderate cooperativity at the switch, for example n = 6 (20), we must have w ≥ 0.8. A gain of 6 (17) requires w ≥ 23 and w ≥ 3 in these respective cases.
Finally, we note that an additional cooperative step probably occurs in the interactions between flagella, since the bias of an individual flagellum in the absence of stimulation [≃0.64 (2)] is less than that of a swimming cell [≃0.9, assuming mean run and tumble durations of 1.1 s and 0.14 s, respectively (21)]. We can estimate what the threshold number of flagella might be for this cooperative interaction if we adopt the “voting hypothesis” (21, 22), whereby the biases of the individual flagella are identical and independent, and the probability that the flagella will form a bundle is one when the number of flagella turning CCW equals or exceeds a threshold θ and zero otherwise. Then the bias B of the cell is given by
 |
19 |
(not B = ∑j=θN bj(1 − b)N−j, as claimed by Weis and Koshland (22)], where N is the total number of flagella and b is the bias of an individual flagellum. For b = 0.64 and either n = 6 or n = 8 (23), we find that B ≃ 0.9 when θ = N/2, and thus a simple majority rules.
Discussion
In our model of aspartate signal transduction via Tar, excitation is the result of the reduced autophosphorylation rate of the ligand-bound state of the receptor, which reduces the level of CheAp and CheYp, thereby reducing the tumbling rate. Adaptation results from the enhanced rate of methylation of bound states and the fact that methylation increases the rate of autophosphorylation, which returns CheAp and CheYp to their prestimulus levels. The results we present demonstrate that the model can reproduce the experimentally observed responses to both step increases and slow ramps using experimentally determined values for most of the parameters. The disparity between the time scale of excitation, which is fast, and that of adaptation, which is slow, implies that the transduction system can function as a “derivative sensor” with respect to the ligand concentration: the DC component of a signal is ultimately ignored if it is not too large. This provides a bacterium with a temporal sensing mechanism without the need for any type of memory beyond that embodied in the disparity in time scales between excitation and adaptation.
In ref. 10 we show that, as is seen experimentally (16), the magnitude of the response to a slow ramp is an increasing function of ramp rate, and so we may understand the ramp response as the result of a difference between the rate at which receptors enter the sequestered state via increases in receptor occupancy, and the rate at which they exit via transitions between methylation states. Steeper ramps result in larger differences between the entrance and exit rates, and thus in larger responses. The threshold ramp response (16) occurs when these rates are equal. In response to a ramp, the deviation from baseline of the level of sequestered receptor is an approximately linear function of ramp rate. If the downstream steps in the transduction pathway operate in a linear range, then the bias response will in turn be approximately linear in the ramp rate, consistent with the finding of Block et al. (16).
Three methylation states were necessary to accurately reproduce the responses to both step and ramp stimuli, because these responses place competing restrictions on the effective methylation and demethylation rates. For step stimuli given at a baseline attractant concentration of zero (17, 18), adaptation is dominated by the fast transitions between the two lowest methylation states, which provide a sufficiently fast adaptation response. At the higher attractant concentrations of ramp experiments (16, 18), receptors are on average more highly methylated, and so the slower transitions between the two highest methylation states are more prominent, providing a significant ramp response.
The sensitivity, or gain, of the signal transduction system is found experimentally to be quite high, but the source of this sensitivity is unknown. We have shown that the sensitivity observed in response to ramp stimuli (16, 18) is consistent with the moderate estimate of 6 for the maximum gain of the system (17) obtained from step experiments, but that cooperativity equivalent to a Hill coefficient on the order of 11 is necessary to produce the desired gain. There are several potential sources of cooperativity. Binding of CheYp to the flagellar switch is thought to be cooperative (20), and we have shown that competitive inhibition by unphosphorylated CheY can enhance the sensitivity. Because the motor contains 26 or 27 subunits of switch protein FliF (19), it is conceivable that high cooperativity occurs either in binding to the switch or else in interactions among switch subunits bound individually to CheYp. CheZ phosphatase activity may also be modulated in a manner that exhibits cooperativity. The system gain could be significant if CheZ activity were positively correlated with the level of sequestered CheA, because small fractional changes in receptor occupancy can correspond to large fractional changes in sequestered CheA. As an example, the cells possess a short form of CheA (CheAs) which may bind several molecules of CheZ (24). If it does so when the associated transducer is unbound to attractant or highly methylated, and releases these molecules into the cytoplasm upon attractant binding, the effective concentration of CheZ will be raised following the latter event. Alternatively, the CheAs–CheZ complex may amplify CheZ phosphatase activity [Wang (1996) cited in ref. 25], which could produce high gain if the complex were to form upon attractant binding. Polymerization of CheZ in the presence of CheYp is another potential mechanism for signal amplification, though it is more likely that this reaction instead enhances the adaptation response (25). A further source of gain might be found in cooperative interactions among receptors in close proximity to one another, a possibility raised by the existence of a ‘nose spot’ of elevated receptor density (26).
We have shown that the effects of cooperativity at different locations in the signal transduction pathway are likely to be multiplicative, and thus the total system gain may be the result of moderate cooperativity occurring at two or more of the above-mentioned locations. For example, a Hill coefficient of 6 at the flagellar switch (20) and a moderate degree of CheZ modulation are sufficient to produce the desired gain.
Although the model analyzed herein is specific to signal transduction in bacterial chemotaxis, the structure of the network in Fig. 2 is very similar to those of other signal transduction processes, such as those modeled in refs. 27–29. This suggests that the type of analysis done here will have applicability to other systems. A more complete discussion of aspects of adaptation not treated here, including an evaluation of general models of adaptation, is given in ref. 10.
Acknowledgments
This work was supported in part by National Institutes of Health Grant GM29123 to H.G.O. and National Institutes of Health Grant GM19559 to J.S.P.
ABBREVIATIONS
- CCW
counterclockwise
- CW
clockwise
- MCP
methyl-accepting chemotaxis protein
References
- 1.Berg H C. Cold Spring Harbor Symp Quant Biol. 1990;55:539–545. doi: 10.1101/sqb.1990.055.01.052. [DOI] [PubMed] [Google Scholar]
- 2.Block S M, Segall J E, Berg H C. Cell. 1982;31:215–226. doi: 10.1016/0092-8674(82)90421-4. [DOI] [PubMed] [Google Scholar]
- 3.Stock J B. In: Regulation of Cellular Signal Transduction Pathways by Desensitization and Amplification. Sibley D R, Houslay M D, editors. New York: Wiley; 1994. pp. 3–24. [Google Scholar]
- 4.Stock J B, Surette M G. Escherichia coli and Salmonella: Cellular and Molecular Biology. Washington, DC: Am. Soc. Microbiol.; 1996. [Google Scholar]
- 5.Bourret R B, Borkovich K A, Simon M I. Annu Rev Biochem. 1991;60:401–441. doi: 10.1146/annurev.bi.60.070191.002153. [DOI] [PubMed] [Google Scholar]
- 6.Engström P, Hazelbauer G L. Cell. 1980;20:165–171. doi: 10.1016/0092-8674(80)90244-5. [DOI] [PubMed] [Google Scholar]
- 7.Springer M S, Zanolari B, Pierzchala P A. J Biol Chem. 1982;257:6861–6866. [PubMed] [Google Scholar]
- 8.Boyd A, Simon M I. J Bacteriol. 1980;143:809–815. doi: 10.1128/jb.143.2.809-815.1980. [DOI] [PMC free article] [PubMed] [Google Scholar]
- 9.Bray D, Bourret R B, Simon M I. Mol Biol Cell. 1993;4:469–482. doi: 10.1091/mbc.4.5.469. [DOI] [PMC free article] [PubMed] [Google Scholar]
- 10.Spiro, P. A. (1997) Ph.D. dissertation (Univ. of Utah, Salt Lake City).
- 11.Lupas A, Stock J B. J Biol Chem. 1989;264:17337–17342. [PubMed] [Google Scholar]
- 12.Simms S A, Stock A M, Stock J B. J Biol Chem. 1987;262:8537–8543. [PubMed] [Google Scholar]
- 13.Terwilliger T C, Wang J Y, Koshland D E. J Biol Chem. 1986;261:10814–10820. [PubMed] [Google Scholar]
- 14.Bray D, Bourret R B. Mol Biol Cell. 1995;6:1367–1380. doi: 10.1091/mbc.6.10.1367. [DOI] [PMC free article] [PubMed] [Google Scholar]
- 15.Borkovich K A, Alex L A, Simon M I. Proc Natl Acad Sci USA. 1992;89:6756–6760. doi: 10.1073/pnas.89.15.6756. [DOI] [PMC free article] [PubMed] [Google Scholar]
- 16.Block S M, Segall J E, Berg H C. J Bacteriol. 1983;154:312–323. doi: 10.1128/jb.154.1.312-323.1983. [DOI] [PMC free article] [PubMed] [Google Scholar]
- 17.Khan S, Castellano F, Spudich J, McCray J, Goody R, Reid G, Trentham D. Biophys J. 1993;65:2368–2382. doi: 10.1016/S0006-3495(93)81317-1. [DOI] [PMC free article] [PubMed] [Google Scholar]
- 18.Segall J E, Block S M, Berg H C. Proc Natl Acad Sci USA. 1986;83:8987–8991. doi: 10.1073/pnas.83.23.8987. [DOI] [PMC free article] [PubMed] [Google Scholar]
- 19.Macnab R M. In: Two-Component Signal Transduction. Hoch J A, Silhavy T J, editors. Washington, DC: Am. Soc. Microbiol.; 1995. pp. 181–199. [Google Scholar]
- 20.Kuo S C, Koshland D E. J Bacteriol. 1989;171:6279–6287. doi: 10.1128/jb.171.11.6279-6287.1989. [DOI] [PMC free article] [PubMed] [Google Scholar]
- 21.Ishihara A, Segall J E, Block S M, Berg H C. J Bacteriol. 1983;155:228–237. doi: 10.1128/jb.155.1.228-237.1983. [DOI] [PMC free article] [PubMed] [Google Scholar]
- 22.Weis R M, Koshland D E. J Bacteriol. 1990;172:1099–1105. doi: 10.1128/jb.172.2.1099-1105.1990. [DOI] [PMC free article] [PubMed] [Google Scholar]
- 23.Stewart R C, Dahlquist F W. Chem Rev. 1987;87:997–1025. [Google Scholar]
- 24.Amsler C D, Matsumura P. In: Two-Component Signal Transduction. Hoch J A, Silhavy T J, editors. Washington, DC: Am. Soc. Microbiol.; 1995. pp. 89–103. [Google Scholar]
- 25.Blat Y, Eisenbach M. J Biol Chem. 1996;271:1232–1236. doi: 10.1074/jbc.271.2.1232. [DOI] [PubMed] [Google Scholar]
- 26.Parkinson J S, Blair D F. Science. 1993;259:1701–1702. doi: 10.1126/science.8456297. [DOI] [PubMed] [Google Scholar]
- 27.Katz B, Thesleff S. J Physiol (London) 1957;138:63–80. doi: 10.1113/jphysiol.1957.sp005838. [DOI] [PMC free article] [PubMed] [Google Scholar]
- 28.Knox B E, Devreotes P N, Goldbeter A, Segel L A. Proc Natl Acad Sci USA. 1986;83:2345–2349. doi: 10.1073/pnas.83.8.2345. [DOI] [PMC free article] [PubMed] [Google Scholar]
- 29.De Young G, Keizer J. Proc Natl Acad Sci USA. 1992;89:9895–9899. doi: 10.1073/pnas.89.20.9895. [DOI] [PMC free article] [PubMed] [Google Scholar]