

Abstract
The Fas receptor is one of a number of important physiological inducers of programmed cell death (apoptosis). Current models for regulation of this process involve rapid conversion of sphingomyelin to ceramide by cellular sphingomyelinases. Induced changes in cellular levels of such sphingosine-based ceramides are normally extrapolated from measurements of sphingomyelinase activity or following their conversion to ceramide phosphate by treatment of cellular lipid extracts with bacterial diacylglycerol kinase (DAGK). To allow direct study of cellular sphingosine- and sphinganine-based ceramide levels, we developed a mass spectrometric technique capable of determining inducible changes in both overall ceramide levels and species distribution in cellular lipid preparations. Contrary to current models, we detected no changes in cellular ceramide levels up to 2 hr poststimulation of Jurkat T cells with an anti-Fas IgM, although this treatment did induce apoptosis. We also determined in the same system that, when utilizing the DAGK assay, increased phosphorylation of substrates that comigrated with ceramide standards was apparent but that this effect was due to an enhancement of DAGK activity rather than increases in levels of cellular ceramides as substrates per se. Thus, the first direct measurement of ceramides present in cells undergoing apoptosis indicates that, insofar as it can be measured, the induction of apoptosis does not involve the generation of sphingosine-based ceramides, contrary to many published accounts.
Sphingosine-based ceramides have been strongly implicated in the process of apoptosis induced (among other methods) through stimulation of the Fas (1–8) and tumor necrosis factor (TNF) receptors (7, 9–11), by UV (3, 7, 12) and x-ray irradiation (12, 13), or through treatment with certain chemotherapy drugs (refs. 14 and 15 and for a recent review see ref. 16). These have often been associated with reported increases in cellular ceramide levels, as assessed by both diacylglycerol kinase (DAGK) (1, 2, 4, 5, 12–14, 17) and sphingomyelinase assays (4, 10, 15). Furthermore, the addition of synthetic ceramides themselves has also been shown to induce apoptosis in various cell types (1–3, 5, 8, 11, 13, 14, 18). T cells express high levels of TNF and Fas receptors. Indeed, Jurkat T cells have been shown to undergo both TNF- and Fas-induced apoptosis (5, 6, 8, 9), with increases in cellular ceramide levels having been implicated similarly in these processes (5, 8, 9).
We utilized an electrospray ionization mass spectrometry (MS)- based technique recently developed in our laboratory (19) to quantitatively study the effect of anti-Fas stimulation of Jurkat cells on cellular ceramide levels. By using an artificial internal standard in conjunction with a scanning mode known as precursor ion scanning (PIS), we were able to simultaneously determine potential changes in both overall ceramide levels and species distribution due to the characteristic fragments that were produced following collision-induced dissociation (CID). We found that (contrary to previous reports) although anti-Fas treatment did induce apoptosis, we were unable to detect any changes in cellular ceramide levels or species distribution in lipid preparations from the cells at times ranging from 15 sec to 2 hr (at which point the cells were highly apoptotic). Furthermore, when we performed a conventional DAGK assay on similar preparations, we observed the reported increase of DAGK-generated phospholipid(s) with the same mobility as C16:0 ceramide phosphate following silica gel TLC (which has always been interpreted as indicative of the quantity of ceramide present in the initial lipid preparation). However, when we again included the artificial internal standard in the DAGK assay, a similar increase in the phosphorylation of this substrate was observed. We interpret these results to indicate that there were factors present in these extracts that increased the activity of the DAGK within the assay itself, whereas the levels of endogenous ceramides were not altered.
EXPERIMENTAL PROCEDURES
Jurkat Cell Culture and Stimulation.
All culture reagents were from GIBCO/BRL. Jurkat cells were maintained at 37°C in RPMI medium 1640 supplemented with 10% fetal calf serum, 2 mM l-glutamine, and 55 μM 2-mercaptoethanol, according to standard procedures. Stimulations were done at 37°C in serum-free RPMI medium 1640 with the CH-11 anti-Fas IgM monoclonal antibody (Upstate Biotechnology, Lake Placid, NY). Cell densities and CH-11 concentrations used in individual experiments are given in the figure legends. For stimulation time courses up to 2 hr, control stimulations were performed exactly as for the 2 hr time point, except for the omission of the CH-11.
Evaluation of Cellular DNA Content.
Cells were spun down, transferred to ice, and washed twice with cold PBS. Cells were resuspended in 0.5 ml of cold PBS (GIBCO/BRL). Five ml of ice-cold 80% ethanol were added slowly while mixing, and cells were fixed overnight at 4°C. Cells were then washed twice in 1% BSA in PBS and resuspended in 0.8 ml of the same mixture. A total of 0.1 ml of 500 μg/ml propidium iodide (20), 38 mM sodium citrate (pH 7) was added, followed by 2 μl of 10 mg/ml boiled RNase A and incubation for 30 min at 37°C. DNA content was then assessed by FACS analysis.
Anti-CPP32 Immunoblotting.
Cells were spun down and lysed by sonication in 500 μl of ice-cold 10 mM Hepes (pH 8), 1.5 mM MgCl2, 10 mM KCl, 1 mM DTT, 1 mM phenylmethylsulfonyl fluoride, 10 μg/ml aprotinin, 10 μg/ml leupeptin, 10 μg/ml of soybean trypsin inhibitor at 4°C. Insoluble matter was removed by centrifugation at 4°C. Aliquots were run on SDS/polyacrylamide gels, followed by electroblotting to nitrocellulose membranes. Blots were probed with an antibody specific for the human CPP32 protease (Transduction Laboratories, Lexington, KY), and were visualized by enhanced chemiluminescence.
Lipid Extraction and MS Analyses.
A more detailed description of MS and PIS analyses of ceramides and cellular lipids is given elsewhere (19). In brief, cells were spun down and resuspended and sonicated in 1 ml of CH3OH/H2O/12 M HCl (95:5:0.5; vol/vol), and 0.6 ml of ice-cold water was added. Lipids were prepared by partitioning them into 1 ml of CHCl3, and the organic phases were recovered and dried in glass tubes. For short time points (≤10 min), stimulation was done in 1 ml of serum-free medium and terminated by the addition of 2 ml of CH3OH/H2O/12 M HCl (95:5:0.5; vol/vol) and by immediate sonication. Lipids were then prepared by partitioning into 2 ml of CHCl3. Polar lipids were removed by small-scale silica gel chromatography as described (19), and a single fraction spanning the known elution positions for ceramides varying from C2:0 to C24:1 was collected and dried. Lipids were resuspended in 5 mM ammonium acetate in CH3OH with C2:0 ceramide (Calbiochem) added to 200 fmol/μl as an internal standard. They were then infused into a TSQ 7000 mass spectrometer (Finnigan-MAT, San Jose, CA) by a Harvard Apparatus at a flow rate of 1 μl/min. For cellular lipids, samples were resuspended at concentrations known to give a good C2:0 signal and to give linear signal response with respect to sample concentration ≈5 × 10⁴ cells/μl (19). Mass analysis was performed at a heated capillary tube temperature of 200°C, an electrospray potential of 4.5 kV, and a sheath gas pressure of 45 psi. A collision gas (argon) pressure of 1 mtorr (1 torr = 133.3 Pa) was used when scanning in CID or PIS modes. Spectra for cellular and standard lipids were averaged over either 1 or 5 min as indicated in the figure legends. C16:0 ceramide standard was obtained from Sigma.
DAGK Assay.
Cellular lipids were prepared as above but without the silica gel column step. An Escherichia coli DAGK reaction was performed exactly as described (5, 21) except that the ATP-specific activity used was 250 dpm/pmol. DAGK was from Boehringer Mannheim, and commercially available C2:0 (200 nmols), C16:0 (200 nmols) and Type III ceramides [30 μg (Sigma)] were included as standards where indicated in the figure legends. Alternatively, 200 nmol of the synthetic C2:0 ceramide was added to identically prepared cellular lipid preparations prior to commencement of the DAGK assay. Silica gel TLC analysis of reaction products was performed exactly as described (1, 5, 21). Visualization and quantitation were performed on a Molecular Dynamics PhosphorImager using imagequant software.
RESULTS AND DISCUSSION
Initial experiments were performed to confirm reports that anti-Fas treatment of Jurkat cells did indeed induce apoptosis. This we did visually, observing severe membrane blebbing in ≈95% of cells 2 hr poststimulation (data not shown). Further confirmation of Fas-induced apoptosis was obtained by FACS analysis following propidium iodide staining (20), where ≈60% of the cells were defined as apoptotic within 90-min poststimulation, as assessed by determination of hypodiploid DNA content (Fig. 1A). As expected (22, 23), anti-Fas treatment led to cleavage and hence activation of the CPP32 apoptotic protease [recently renamed caspase-3 (24)] within 30 min of stimulation (Fig. 1B).
Figure 1.
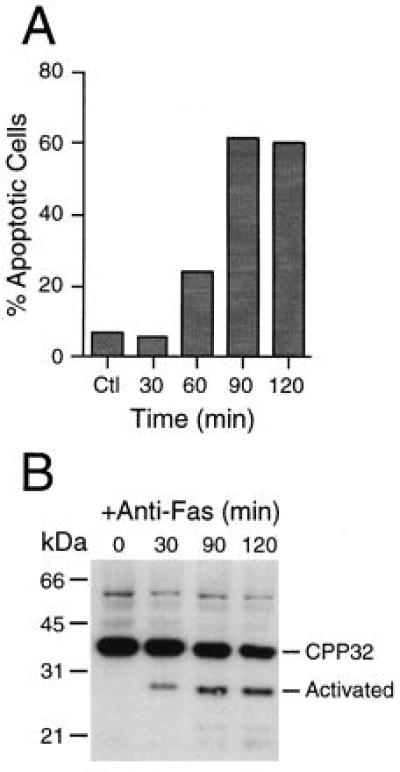
Fas induction of apoptosis in Jurkat T cells. (A) Cells (5 × 10⁶) were stimulated at 1 × 10⁶/ml and at 100 ng/ml CH-11 anti-Fas IgM for the indicated times. Cells were washed, fixed, and stained with propidium iodide (20). Apoptotic cells were identified as those exhibiting hypodiploid DNA content, as measured by FACS analysis. Data shown are the median values obtained from three individual measurements. (B) Cells (5 × 10⁶) were stimulated at 5 × 10⁵/ml and at 100 ng/ml CH-11 anti-Fas IgM for indicated times. Lysates were electroblotted, probed with anti-CPP32 [caspase-3 (24)], and visualized by enhanced chemiluminescence. The activated form of the protease appears as a lower molecular weight cleavage product.
We next applied our recently developed MS-based technique to the analysis of Jurkat cellular ceramide levels. This method is capable of evaluating variations in overall levels and species distribution of both sphingosine- and sphinganine-based ceramides (19). Following stimulation, cellular lipids were extracted in chloroform/methanol/water. The organic phases were dried, and then run on a silica gel column for separation of polar from nonpolar lipids. C2:0 ceramide was added as an internal standard prior to analysis to facilitate quantitation. The C2:0 was chosen since it is not a naturally occurring molecule, and it was found to fragment identically to the longer chain length, physiological ceramides under the ionization conditions used (19). Indeed, PIS analyses of a variety of human lymphocyte cell lines (Jurkat, U937, and HL-60) without the addition of C2:0 demonstrated its complete absence within these cell lines, with the shortest chain length detected in any of them being the C14:0, which was present at very low levels indeed (ref. 19 and data not shown).
The full mass spectrum initially revealed that such Jurkat cell lipid preparations are complex mixtures of highly abundant molecules (Fig. 2A). PIS was used to identify sphingosine-based ceramides in the mixture by their common generation of a characteristic CID-fragment ion at a mass-to-charge ratio (m/z) of 264, which was derived from the sphingosine portion of the molecule (ref. 19) (Fig. 2B). The predominant species was the C16:0 form (m/z = 538.5). Dehydro forms of the same molecule were also detected (m/z = 520.4 and 502.2). The C2:0 standard, barely detectable in the full spectrum (Fig. 2A), appeared at m/z = 342.1, with dehydro forms at m/z = 324.1 and 306.1. Intact and dehydro C24:0 (m/z = 650.7 and 632.5), C24:1 (m/z = 648.6 and 630.5), and C22:0 (m/z = 622.6 and 604.6) were also detected (Fig. 2C). CID analysis on the m/z = 538.5 peak in Fig. 2A, further confirmed its C16:0 content by comparison with a purified C16:0 standard (Fig. 2 D and E, respectively), both giving peaks at m/z ≈ 252, 264, and 282, and all being characteristic for sphingosine-based ceramides (19). The species distribution of sphinganine-based ceramides [determined by PIS for m/z = 266 (19)], while present at lower levels, mirrored that of the sphingosine-based ceramides (data not shown).
Figure 2.
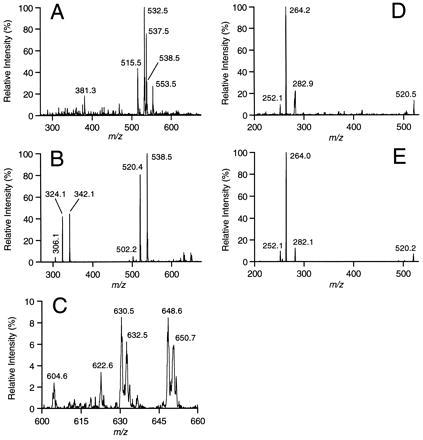
MS determination of sphingosine-based ceramide content and distribution in Jurkat T cells and comparison with standard ceramide. Lipid extractions and MS analyses were performed as described in Experimental Procedures. A synthetic C2:0 ceramide was added to the sample (and dilution) buffer to a concentration of 200 fmol/μl as an internal standard prior to all analyses of cellular lipids. (A) Full MS analysis of Jurkat cellular lipids in the range m/z = 270–675 averaged over 1 min. (B) Precursor ion scan (for m/z = 264) in the range m/z = 270–675 of same sample in A averaged over 5 min. Ceramide peaks labeled are from the C2:0 internal standard (m/z = 306.1, 324.1, and 342.1) and C16:0 (m/z = 502.2, 520.4, and 538.5). (C) Expansion of B showing the m/z = 600–660 range, to reveal minor ceramide components and demonstrate the high resolution and sensitivity obtained. Ceramide peaks labeled are from the C24:0 (m/z = 650.7 and 632.5), C24:1 (m/z = 648.6 and 630.5), and C22:0 (m/z = 622.6 and 604.6). (D) CID analysis of the 538.5 signal present in A, averaged over 5 min, and producing fragment ions at m/z = 252.1, 264.2, and 282.9 characteristic for sphingosine-based ceramides (19). (E) CID analysis of a C16:0 ceramide standard (at 8 pmol/μl) for comparison with D, averaged over 1 min.
A comparison of signal intensities at the C2:0 and C16:0 positions (m/z = 342.1 and 538.5) in Fig. 2 A and B indicate that a substantial amount of the 538.5 peak in Fig. 2A is non-ceramide derived. A significant signal at 538.5 remained following CID. However, CID of the C16:0 standard resulted in complete dissociation under these conditions (data not shown). Thus, the non-ceramide molecules comprising the 538.5 peak did not contribute to the signal in Fig. 2B since additional fragmentation ions were not observed in Fig. 2D. Also, no contribution to the 538.5 signal was detected during PIS from isotope variants of the major 537.5 peak in Fig. 2A since that peak also did not fragment (data not shown). CID analyses of peaks at m/z = 502.2, 520.4, 630.5, 632.5, 648.6, and 650.7 (Fig. 2 B and C) confirmed the generation of only sphingosine-based ceramide fragmentation patterns, ruling out the possibility of signal contribution from other sources during PIS (data not shown).
Jurkat cells were stimulated with anti-Fas over time courses ranging from 0 to 5 min and 0 to 120 min, and cellular lipids were prepared as before. PIS was performed, and the total signal obtained for each species detected was calculated by summing the intact and dehydroceramide signal intensities. Changes in the level of each species are then displayed graphically by calculating signal ratios with respect to the standard (19) and are shown as scatter plots for each set of samples from both time course anti-Fas inductions (Fig. 3 A and B). This method for the relative quantitation of cellular ceramide levels is known to produce a linear signal response when the quantity of cellular lipids are varied with respect to a constant level of C2:0, and vice versa (19). Unexpectedly, the sphingosine-based ceramide levels did not change in either time course, despite the induction of apoptosis (Fig. 1). Statistical analysis of means revealed no significant difference (95% confidence) between adjacent time points. PIS for m/z = 266 revealed that cellular levels of sphinganine-based ceramides also remained unchanged (data not shown). For sphingosine-based ceramide levels to double (or more) as reported previously, we would expect to have seen double the C16:0 signal (resulting in a doubling of the C2:0 to C16:0 ratio), because it comprises >90% of this class of lipids in Jurkat cells (Fig. 2B). Alternatively, we would expect a significant increase in the levels of one or more of the minor species present. Neither occurred, nor was there generation of a new ceramide species, because such changes would be easily detected (Figs. 2 and 3, data not shown, and ref. 19). Thus, the use of a direct MS-based assay, which is highly selective and sensitive, clearly demonstrated that in vivo generation of sphingosine-based ceramides does not occur during Fas-induced apoptosis, contrary to the many published reports mentioned above.
Figure 3.
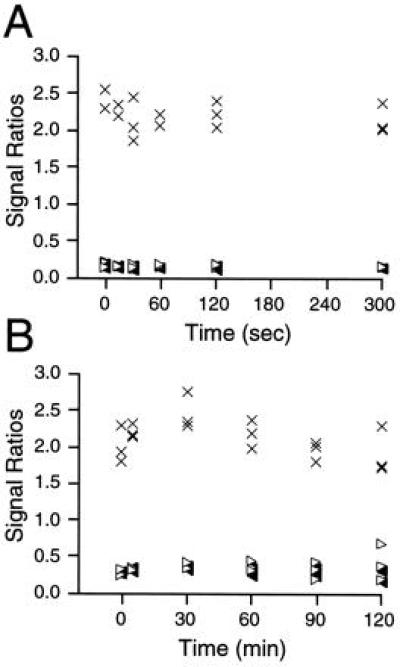
MS analyses of cellular sphingosine-based ceramide levels in Jurkat T cells following anti-Fas stimulation. PIS was performed on Jurkat cell lipids (see Fig. 2B) following stimulation with anti-Fas IgM for the indicated times. Stimulations were either performed (A) from 0 to 5 min at 2 × 10⁷ cells/ml and 250 ng/ml CH-11 anti-Fas IgM in 1 ml, or (B) from 0 to 2 hr at 4 × 10⁶ cells/ml and 50 ng/ml CH-11 in 5 ml. Lipid extractions and MS analyses were performed as described in Experimental Procedures. Samples were prepared in triplicate (except for A at 0, 15, and 60 sec points, which were duplicates). Signal intensities for C16:0 (crosses), C24:0 (open triangles), and C24:1 (filled triangles) were calculated by summing peaks indicated in Fig. 2 B and C, and ratios were obtained relative to the summed intensities of the C2:0-derived signals (internal standard) indicated in Fig. 2B. Data are presented as scatter plots to indicate the range of values obtained at each time point.
We next performed the conventional, enzymatic DAGK assay (5, 21) on similarly prepared lipids in an attempt to resolve this apparent contradiction. In agreement with previous reports of ceramide levels in Fas-stimulated cells (1, 4, 5), we observed a rapid increase in several phospholipid bands (Fig. 4A). Among them was a compound with similar mobility to C16:0 ceramide phosphate (the major ceramide species present in Jurkat cells being the C16:0, see Fig. 2B), which increased in intensity within 1 min of stimulation, and returned to baseline within 30 min of stimulation. A striking feature of this experiment was that we observed two other major unidentified phospholipid bands being generated (labeled upper and lower) that increased and decreased in level with the same time course and in similar magnitudes to the band attributed to the C16:0 (Fig. 2B). This observation is consistent with fluctuations in the activity of the DAGK itself. This would suggest a flaw in the assay, since it is assumed that the activity of the DAGK stays constant when the data are interpreted. We therefore repeated the experiment with the inclusion of the artificial C2:0 ceramide as an internal standard for DAGK activity. We found that although not being a particularly good substrate for DAGK, its phosphorylation (along with the C16:0 band) was similarly increased and then decreased following anti-Fas stimulation (Fig. 4C). This confirmed that increases in ceramide phosphate levels observed by the DAGK assay were due to changes in the activity of the DAGK rather than changes in the levels of ceramides as substrates within the assay. Indeed, these data strongly suggest that there are one or more molecules present in the lipid preparations that activate the E. coli-derived DAGK (compare C2:0 phosphate in Fig. 4C, C2:0 control and 0 min +anti-Fas, both containing 200 nmol C2:0). It remains to be determined whether these molecules function to regulate the activity of endogenous DAGK.
Figure 4.
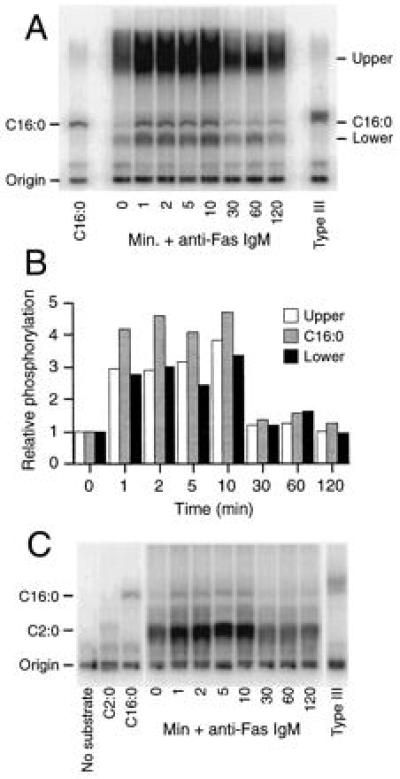
Evaluation of the DAGK assay for determination of cellular ceramide levels. Cellular lipids were generated, and the DAGK assay was performed as described in Experimental Procedures. For A and C, stimulations were either performed at 1 × 10⁷ cells/ml and 250 ng/ml CH-11 in 1 ml for 1, 2, 5, and 10 min time points or at 2 × 10⁶/ml and 100 ng/ml CH-11 in 5 ml for 30, 60, and 120 min time points. Phospholipids were visualized by TLC and phosphorimaging following the DAGK assay, which was performed in the absence (A) or presence (C) of 200 nmol C2:0 ceramide as an internal standard. C2:0 (200 nmol), C16:0 (200 nmol), and Type III (30 μg) ceramides were included as controls where indicated, along with one in the absence of any added substrate in C. (B) Quantitative analysis of the three major generated phospholipid species (bands labeled C16:0, Upper and Lower) observed in A was performed on a PhosphorImager. Data presented are mean values for three separate quantitations made of the same exposure to reduce variations introduced due to differences in the precise regions selected for integration. Standard deviations in all cases were <20% of values shown (data not shown).
Current models for the induction of apoptosis involve a rapid generation of ceramides within the cells. These have been extrapolated from data derived from the addition of high concentrations of ceramides to cell culture suspensions, or by the inferred measurement of cellular ceramides, typically by a DAGK assay, leading to the postulation that ceramides act as second messengers in the induction of apoptosis. The data presented here clearly call into question such models. In particular, they call into question the many conclusions previously drawn from results generated by the DAGK assay, which we have shown to be inherently flawed. Although there appears to be another molecule present in the cells that affects DAGK activity and, presumably, changes in level following anti-Fas treatment, it is not clear what the nature of this molecule is or whether in fact it plays any functional role in the induction of apoptosis. Clearly, however, these data show that there is no induced generation of ceramides during Fas-induced apoptosis. Whereas the role of ceramides has recently been called into question, mainly on the basis of inconsistent results (16), our MS-based approach to monitoring cellular ceramide levels provides the first direct and positive evidence of their failure to be produced in a cell system undergoing apoptosis. Thus, our studies not only indicate a serious need to reexamine the early events contributing to the induction of apoptosis, but they also indicate a clear need to utilize the more direct and selective analytical techniques afforded by MS-based methodologies over the traditional biochemical assays in any future investigation into ceramide involvement in cell signaling pathways.
Acknowledgments
We thank D. Coder (Department of Immunology, University of Washington) for assistance with FACS analyses and software and Robert Franza and Daniel Figeys (Department of Molecular Biotechnology, University of Washington) for critical reading of this manuscript and for useful scientific discussions, respectively. This work was supported in part by the National Science Foundation Science and Technology Center for Molecular Biotechnology.
ABBREVIATIONS
- TNF
Tumor necrosis factor
- MS
mass spectrometry
- PIS
precursor ion scanning
- CID
collision-induced dissociation
- DAGK
diacylglycerol kinase
References
- 1.Cifone M G, De Maria R, Roncaioli P, Rippo M R, Azuma M, Lanier L L, Santoni A, Testi R. J Exp Med. 1994;180:1547–1552. doi: 10.1084/jem.180.4.1547. [DOI] [PMC free article] [PubMed] [Google Scholar]
- 2.Tepper C G, Jayadev S, Liu B, Bielawska A, Wolff R, Yonehara S, Hannun Y A, Seldin M F. Proc Natl Acad Sci USA. 1995;92:8443–8447. doi: 10.1073/pnas.92.18.8443. [DOI] [PMC free article] [PubMed] [Google Scholar]
- 3.Martin S J, Newmeyer D D, Mathias S, Farschon D M, Wang H G, Reed J C, Kolesnick R N, Green D R. EMBO J. 1995;14:5191–5200. doi: 10.1002/j.1460-2075.1995.tb00203.x. [DOI] [PMC free article] [PubMed] [Google Scholar]
- 4.Cifone M G, Roncaioli P, De Maria R, Camarda G, Santoni A, Ruberti G, Testi R. EMBO J. 1995;14:5859–5868. doi: 10.1002/j.1460-2075.1995.tb00274.x. [DOI] [PMC free article] [PubMed] [Google Scholar]
- 5.Gulbins E, Bissonnette R, Mahboubi A, Martin S, Nishioka W, Brunner T, Baier G, Baier-Bitterlich G, Byrd C, Lang F, Kolesnick R, Altman A, Green D. Immunity. 1995;2:341–351. doi: 10.1016/1074-7613(95)90142-6. [DOI] [PubMed] [Google Scholar]
- 6.Weis M, Schlegel J, Kass G E, Holmstrom T H, Peters I, Eriksson J, Orrenius S, Chow S C. Exp Cell Res. 1995;219:699–708. doi: 10.1006/excr.1995.1281. [DOI] [PubMed] [Google Scholar]
- 7.Wright S C, Zheng H, Zhong J. FASEB J. 1996;10:325–332. doi: 10.1096/fasebj.10.2.8641566. [DOI] [PubMed] [Google Scholar]
- 8.Gottlieb R A, Nordberg J, Skowronski E, Babior B M. Proc Natl Acad Sci USA. 1996;93:654–658. doi: 10.1073/pnas.93.2.654. [DOI] [PMC free article] [PubMed] [Google Scholar]
- 9.Dbaibo G S, Obeid L M, Hannun Y A. J Biol Chem. 1993;268:17762–17766. [PubMed] [Google Scholar]
- 10.Wiegmann K, Schütze S, Machleidt T, Witte D, Krönke M. Cell. 1994;78:1005–1015. doi: 10.1016/0092-8674(94)90275-5. [DOI] [PubMed] [Google Scholar]
- 11.Jarvis W D, Kolesnick R N, Fornari F A, Traylor R S, Gewirtz D A, Grant S. Proc Natl Acad Sci USA. 1994;91:73–77. doi: 10.1073/pnas.91.1.73. [DOI] [PMC free article] [PubMed] [Google Scholar]
- 12.Verheij M, Bose R, Lin X H, Yao B, Jarvis W D, Grant S, Birrer M J, Szabo E, Zon L I, Kyriakis J M, Haimovitz-Friedman A, Fuks Z, Kolesnick R N. Nature (London) 1996;380:75–79. doi: 10.1038/380075a0. [DOI] [PubMed] [Google Scholar]
- 13.Haimovitz-Friedman A, Kan C-C, Ehleiter D, Persaud R S, McLoughlin M, Fuks Z, Kolesnick R N. J Exp Med. 1994;180:525–535. doi: 10.1084/jem.180.2.525. [DOI] [PMC free article] [PubMed] [Google Scholar]
- 14.Bose R, Verheij M, Haimovitz-Friedman A, Scotto K, Fuks Z, Kolesnick R. Cell. 1995;82:405–414. doi: 10.1016/0092-8674(95)90429-8. [DOI] [PubMed] [Google Scholar]
- 15.Jaffrézou J-P, Levade T, Bettaïeb A, Andrieu N, Bezombes C, Maestre N, Vermeersch S, Rousse A, Laurent G. EMBO J. 1996;15:2417–2424. [PMC free article] [PubMed] [Google Scholar]
- 16.Hannun Y A. Science. 1996;274:1855–1859. doi: 10.1126/science.274.5294.1855. [DOI] [PubMed] [Google Scholar]
- 17.Dressler K A, Mathias S, Kolesnick R N. Science. 1992;255:1715–1718. doi: 10.1126/science.1313189. [DOI] [PubMed] [Google Scholar]
- 18.Obeid L M, Linardic C M, Karolak L M, Hannun Y A. Science. 1993;259:1769–1771. doi: 10.1126/science.8456305. [DOI] [PubMed] [Google Scholar]
- 19.Gu M, Kerwin J L, Watts J D, Aebersold R. Anal Biochem. 1997;244:347–356. doi: 10.1006/abio.1996.9915. [DOI] [PubMed] [Google Scholar]
- 20.Crissman H A, Steinkamp J A. J Cell Biol. 1973;59:766–771. doi: 10.1083/jcb.59.3.766. [DOI] [PMC free article] [PubMed] [Google Scholar]
- 21.Younes A, Khan D W, Besterman J M, Bittman R, Byun H S, Kolesnick R N. J Biol Chem. 1992;267:842–847. [PubMed] [Google Scholar]
- 22.Enari M, Talanian R V, Wong W W, Nagata S. Nature (London) 1996;380:723–726. doi: 10.1038/380723a0. [DOI] [PubMed] [Google Scholar]
- 23.Schlegel J, Peters I, Orrenius S, Miller D K, Thornberry N A, Yamin T T, Nicholson D W. J Biol Chem. 1996;271:1841–1844. doi: 10.1074/jbc.271.4.1841. [DOI] [PubMed] [Google Scholar]
- 24.Alnemri E S, Livingston D J, Nicholson D W, Salveson G, Thornberry N A, Wong W W, Yuan J. Cell. 1996;87:171. doi: 10.1016/s0092-8674(00)81334-3. [DOI] [PubMed] [Google Scholar]