

Abstract
The plastid genomes of some nonphotosynthetic parasitic plants have experienced an extreme reduction in gene content and an increase in evolutionary rate of remaining genes. Nothing is known of the dynamics of these events or whether either is a direct outcome of the loss of photosynthesis. The parasitic Scrophulariaceae and Orobanchaceae, representing a continuum of heterotrophic ability ranging from photosynthetic hemiparasites to nonphotosynthetic holoparasites, are used to investigate these issues. We present a phylogenetic hypothesis for parasitic Scrophulariaceae and Orobanchaceae based on sequences of the plastid gene rps2, encoding the S2 subunit of the plastid ribosome. Parasitic Scrophulariaceae and Orobanchaceae form a monophyletic group in which parasitism can be inferred to have evolved once. Holoparasitism has evolved independently at least five times, with certain holoparasitic lineages representing single species, genera, and collections of nonphotosynthetic genera. Evolutionary loss of the photosynthetic gene rbcL is limited to a subset of holoparasitic lineages, with several holoparasites retaining a full length rbcL sequence. In contrast, the translational gene rps2 is retained in all plants investigated but has experienced rate accelerations in several hemi- as well as holoparasitic lineages, suggesting that there may be substantial molecular evolutionary changes to the plastid genome of parasites before the loss of photosynthesis. Independent patterns of synonymous and nonsynonymous rate acceleration in rps2 point to distinct mechanisms underlying rate variation in different lineages. Parasitic Scrophulariaceae (including the traditional Orobanchaceae) provide a rich platform for the investigation of molecular evolutionary process, gene function, and the evolution of parasitism.
Keywords: molecular evolution, relative rates test, rbcL pseudogene, parallel bootstrap
Among the most remarkable features of flowering plants, including aquatic and carnivorous plants, epiphytes, and plants tolerant of extreme desiccation, is their many adaptations to varied physical and biotic environments. One extraordinary plant adaptation is parasitism, in which modified roots (haustoria) are used to transfer water, minerals, and a diverse collection of carbon compounds from a host plant to the parasite (1, 2). The evolution of parasitism has probably occurred at least eight times within the angiosperms (1). On several occasions this has proceeded to an extreme form known as holoparasitism, in which the parasite obtains virtually all of its reduced carbon from its host. In addition to the loss of photosynthesis and associated pigments (2), holoparasites exhibit reduction or loss of leaves and loss of nonhaustorial roots, and, in one extreme group (Rafflesiaceae) (1), vegetative tissues have been reduced to a mycelium-like mass of feeding cells that reside solely within the photosynthetic host plant.
Despite the profound morphological and physiological changes associated with the parasitic lifestyle, all parasitic plants examined to date retain plastids (3, 4) and plastid genomes (5–9, reviewed in ref. 10). Parasites, therefore, provide an outstanding opportunity to learn about gene and genome evolution and function in the absence of the plastid genome’s primary physiological function, photosynthesis (10). For example, the holoparasite Epifagus [Orobanchaceae (11)] has a greatly reduced plastid genome lacking photosynthetic and purported chlororespiratory genes (8), RNA polymerase genes, and some components of the plastid translation apparatus (12, 13). Conopholis, another Orobanchaceae, shares many of these plastid gene deletions (6, 7, 10) and has additionally lost one copy of the inverted repeat (ref. 7 and C.W.D., S. R. Downie, and J. D. Palmer, unpublished data). Despite the loss of plastid-encoded transcriptional genes, the Epifagus and Conopholis plastid DNAs are transcribed (8, 14, 15), and normal plastid intron processing and RNA editing have been demonstrated in Epifagus (15). These observations and compelling evolutionary arguments (16) have suggested strongly that the Epifagus plastid genome is functional and serves to express a small number of retained genes of nonphotosynthetic function (8, 16). It is intriguing that nearly all of the remaining plastid genes in Epifagus appear to have evolved at an accelerated pace compared with tobacco, a related photosynthetic plant (12, 13).
These observations demonstrate that the normally conservative plastid genome has the potential for rapid structural evolution when coding requirements are decreased; these observations also have other important implications for plastid gene evolution and function (reviewed in ref. 10). However, we know nothing about the dynamics of the events that led to the extraordinary plastid DNAs seen in parasitic plants. For example, is there some predictable order to the genetic changes associated with the loss of photosynthesis? Have the profound alterations to the plastid genome seen in Epifagus and Conopholis all followed the loss of photosynthesis, or might some have begun before its loss? Are the similarities between the plastid genomes of these plants due to convergence or to shared ancestry? How rapidly do the structural and other changes to the plastid genome come about in parasitic plants?
The parasitic Scrophulariaceae/Orobanchaceae is uniquely suited to investigate these issues. Within this group are facultative as well as obligate parasites, hemiparasites of widely varying photosynthetic ability, and a diverse collection of fully heterotrophic holoparasites (1, 2, 17–19). No other group of parasitic plants displays this continuum of parasitic abilities. Comparative analysis of the plastid genomes of these plants should provide a powerful tool for the interpretation of molecular evolution relative to photosynthetic ability (10); however, no explicit phylogeny has been proposed.
In this paper, we develop a phylogenetic framework for the study of evolutionary changes associated with parasitism using rps2, a plastid gene new to plant phylogenetic analysis. rps2, encoding ribosomal protein CS2, is one of the more rapidly evolving plastid genes known to be retained in all parasitic Scrophulariaceae/Orobanchaceae (refs. 12 and 16 and C.W.D., unpublished data), so sequences provide many characters for phylogenetic analysis. First, we show that parasitism has evolved just once in Scrophulariaceae and Orobanchaceae, but we trace the loss of photosynthesis to a minimum of five independent lineages within this group. The phylogeny is then used to demonstrate that the photosynthetic gene rbcL is often retained in nonphotosynthetic lineages, sometimes long after the loss of photosynthesis. In addition, the translational gene rps2 had experienced rate accelerations in several hemi- as well as holoparasitic lineages. These patterns suggest that substantial evolutionary changes occur to the plastid genome of parasites before as well as after the loss of photosynthesis and provide a means of interpreting a growing database on gene and genome evolution in parasitic Scrophulariaceae and Orobanchaceae.
MATERIALS AND METHODS
Taxa.
A total of 35 species, including 25 parasitic species and 10 nonparasitic species, was sampled. This included six species from four genera of traditional Orobanchaceae (20) and each of the four so-called “transition genera” (Buchnera, Harveya, Hyobanche, Lathraea), which have been alternatively classified with the parasitic Scrophulariaceae or Orobanchaceae (1). Fourteen additional species of parasitic Scrophulariaceae were included, representing both tribes (Buchnereae [= Gerardieae] Benth. and Rhinantheae Benth.) of parasites (21). Nonparasitic taxa included seven genera of Scrophulariaceae, plus Kigelia (Bignoniaceae), and outgroups Ligustrum (Oleaceae) and Nicotiana (Solanaceae) (22).
DNA Isolation, rps2 Amplification, and Sequencing.
Total DNAs were isolated (23) from fresh, frozen, or silica-gel dried tissue. DNA was usually prepared from one plant per species, but if plants were very small, tissue from 3–5 nearby plants was pooled for DNA isolation. No evidence of sequence polymorphism has been observed in sequences from these pooled samples.
Plastid rps2 gene sequence was PCR amplified using 1X Taq polymerase buffer (Promega), 0.2 mM each dATP, dCTP, dGTP, and dTTP (Pharmacia), 2.0 mM MgCl2, 3.0 μM each primer [rps2-661R (5′-ACCCTCACAAATAGCGAATACCAA) and either rps2-18F (5′-GGRKARAAATGACAAGAAGATATTGG) or rps2-47F (5′-CTCGTTTTTTATCTGAAGCCTG)], 0.25 units of Taq DNA polymerase (Promega), and ≈500 ng of total DNA in a 50-μl total volume. Amplification began with 30 s at 94°C, then 35 cycles of 94°C for 1 min, 30 s, 50°C for 2 min, and 72°C for 2 min and 5 s per cycle, and a final 10 min at 72°C.
PCR products were purified for sequencing by electrophoresis through 1% agarose gels onto DEAE cellulose membrane (Schleicher & Schuell SS45). Purified PCR product (250–1000 ng) was used as template for manual 35S-dideoxy sequencing (24) using Sequenase (United States Biochemical). Both strands were sequenced using the amplification primers plus additional internal primers (sequences available from the authors).
Phylogenetic Analysis.
Parsimony analyses used paup 3.1.1 (25) on an Apple Quadra 950. Options were 500 random taxon addition sequences, tree-bisection reconnection branch swapping, mulpars, and steepest descent. Bootstrap analyses (26) were performed in parallel on 28 Apple Quadra 650 computers with different random number seeds. Settings were identical to above except that 10 random taxon input orders were used for each of 400 bootstrap replicates. Bremer support analyses (27) were carried out for all trees up to two steps longer than the most parsimonious trees. Bremer support values (27) for remaining nodes were estimated using inverse constraints (28).
Maximum likelihood (ML) phylogenetic analyses (29) were performed using phylip 3.5 (30) and fastdnaml 1.0.6 (31) run on a Sun Microsystems SparcStation 10. Ten random input orders were run using empirical base frequencies and a transition/transversion ratio of 2.0.
rbcL Gene Assays.
PCR and Southern blot assays (8) were used to provide complementary information about the presence or absence of rbcL in each plant. PCR amplifications used primers RH1 (5′-ATGTCACCACAAACAGAAACTAAAGC) and Z1352R (5′-CTTCACAAGCAGCAGCTAGGTCAGGACTCC). Amplifications were as for rps2, except a 50-μl reaction used 0.32 μM for each primer and annealing was at 48°C. Because failure to amplify might be due only to small differences in the primer binding site, we also hybridized genomic DNAs with cloned tobacco rbcL (8) or tobacco rbcL PCR products.
Rate Analyses.
Two analyses were performed to detect variation in rps2 evolutionary rates and to determine whether accelerated rates were restricted to holoparasitic lineages. First, a likelihood ratio test (30) tested for statistically significant rate variation across the entire data set. The likelihood of the most likely tree was compared with that of the same topology under the assumption that rates of evolution were constant. This test assumes that the most likely tree topology (also one of the most parsimonious trees in our analysis) is correct.
Relative rates tests were conducted using the ML method developed by Muse and Weir (32) and Muse and Gaut (33) and were implemented in a computer program (codrates) distributed by Muse. Tests compared putatively long branches to those of minimally parasitic species (Agalinis, Castilleja) that have branch lengths similar to nonparasitic relatives using a near outgroup as reference taxon (Table 1). The power of the test depends on the closeness of the reference taxon (32), so Verbascum was used as the reference taxon for the parasites and Ligustrum for nonparasites.
Table 1.
Relative rates tests for rate variation vs. hemiparasite Agalinis
| Test taxon | Sample χ2, HSYN | Sample χ2, HNONSYN |
|---|---|---|
| Epifagus virginiana | 18.12*** | 13.32*** |
| Conopholis americana | 7.357** | 17.55*** |
| Orobanche ramosa | 2.462 | 24.44*** |
| Striga gesnerioides | 0.2559 | 23.77*** |
| Striga asiatica | 0.2386 | 23.74*** |
| Buchnera florida | 0.5332 | 12.23*** |
| Cycnium racemosum | 0.4435 | 9.658*** |
| Orobanche corymbosa | 2.075 | 4.653* |
| Euphrasia sp. | 7.240** | 1.129 |
| Parentucellia viscosa | 6.013* | 0.9960 |
| Rhinanthus cristatus | 0.0027 | 2.302 |
| Sopubia cana | 1.538 | 1.094 |
| Harveya purpurea | 1.665 | 0.07733 |
| Hyobanche sanguinea | 0.2669 | 1.127 |
| Tozzia alpina | 1.845 | 1.124 |
| Lathraea clandestina | 1.930 | 0.5728 |
| Boschniakia hookeri | 0.2447 | 0.7681 |
| Boschniakia strobilacea | 0.1091 | 0.1285 |
Two hypotheses are tested: (i) HSYN, synonymous rates do not differ and (ii) HNONSYN, nonsynonymous rates do not differ. χ2 tests(1 df) indicated rejection of the hypotheses as follows: *, α = 0.05; **, α = 0.01; and ***, α = 0.005. Because multiple tests were performed, tests were considered significant when χ2 exceeded test statistic at α = 0.01 (**). Species are arranged in order of total branch length, largest to smallest (Fig. 3).
RESULTS
rps2 Amplification and Sequences.
There were 613 bp available for analysis corresponding to Nicotiana positions 16279–16891 (34). Each sequence could be translated into a continuous ORF. One length mutation corresponding to the insertion of a single lysine codon was observed in Buchnera (AAG) and Cycnium (AAA) ≈231 bp downstream from the rps2 start codon. Exact placement of the insertion within this adenine rich region cannot be inferred.
Comparison of 613 aligned positions revealed 237 (39%) variable sites. Of these, 138 (23%) were potentially informative for parsimony analysis. Mean sequence divergence among all taxa was 6.5%; mean divergence among parasites was 6.1%. No significant heterogeneity in base use among plants was detected relative to the overall mean of A (32.0%), C (17.7%), G (22.1%), and T (28.1%) (χ2 = 11.3; df = 102; P ≫ 0.05).
Phylogenetic Analysis.
With all 35 species in the analysis and the insertion in Buchnera and Cycnium treated as a binary presence–absence character, Wagner parsimony analysis found 12 shortest trees at 499 steps. If the insertion was removed from the analysis, six 498-step trees were found, resolving Buchnera and Striga as sister taxa. Ingroup relationships were not altered by exclusion of one or both designated outgroups, and the overall picture of relationships is consistent with that obtained with larger numbers of parasitic and nonparasitic taxa (N.D.Y., K. Steiner, and C.W.D., unpublished work).
Each of the 12 maximum parsimony trees identifies a monophyletic parasitic clade [found in 84% of bootstrap replicates; Bremer support (27) of four steps] containing all of the parasitic species (Fig. 1). Thus, all parasites associated with the Orobanchaceae and/or the Scrophulariaceae are part of a single evolutionary origin of parasitism. Five primary lineages are identified within this parasitic clade. Three mainly hemiparasitic groups include: (i) portions of the tribe Rhinantheae (Bartsia to Rhinanthus), (ii) portions of the tribe Buchnereae (Alectra to Hyobanche), and (iii) a group with other members of each tribe (Pedicularis and Castilleja, Rhinantheae; Agalinis, Buchnereae) (21). Two lineages contain the traditional Orobanchaceae taxa. Equally parsimonious and slightly less parsimonious trees (up to 2 two steps longer) allow any arrangement of the five basal lineages within the parasite clade. Trees just one step longer (500 steps) include some with a monophyletic Orobanchaceae.
Figure 1.
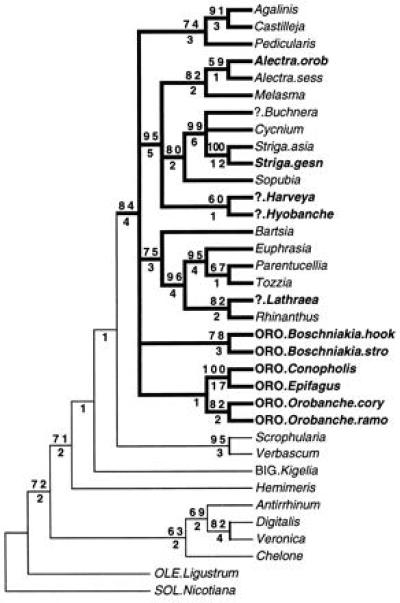
Molecular phylogeny of parasitic Scrophulariaceae, Orobanchaceae, and selected nonparasitic relatives based on parsimony analysis of chloroplast rps2 sequence. Strict consensus shown of 12 trees at 499 steps. Bootstrap values ≥50% are above node, and Bremer support values (27) are below node. Parasitic lineages have thicker branch lines, and holoparasitic taxa are drawn in boldface. All taxa are traditional Scrophulariaceae (21) except: ?, Scrophulariaceae/Orobanchaceae “transition genera” (1); ORO, Orobanchaceae; BIG, Bignoniaceae; OLE, Oleaceae; and SOL, Solanaceae (11). Species names: orob, orobanchoides; sess, sessiliflora; hook, hookeri; stro, strobilacea; cory, corymbosa; and ramo, ramosa.
Bootstrap and decay analyses showed that, despite the lack of resolution for the earliest branching events within the parasites (Fig. 1), the rps2 data set provides good support for critical branching events surrounding the origins of holoparasitism. A topological constraint analysis (25) requiring all holoparasites to be monophyletic resulted in shortest trees of 544 steps (9.1% longer than the maximum parsimony trees). Independent origins are clearly indicated for the holoparasites Striga gesnerioides, Alectra orobanchoides, and Lathraea. Harveya and Hyobanche are weakly grouped together but represent at least one additional holoparasitic origin. Depending on the actual arrangement of Orobanchaceae taxa, these holoparasites must represent at least one, and possibly two or more, independent loss of photosynthesis. Thus, depending on the eventual resolution of the initial parasitic radiation, the holoparasitic condition has originated within this group on at least five and up to eight times.
The ML tree (likelihood of −3724.52) was found in three of 10 random addition sequences and corresponds to one of the 12 parsimony trees above (Figs. 2 and 3). One ML analysis, with an only slightly poorer likelihood (−3725.53), grouped all Orobanchaceae together (results not shown). ML solutions obtained after other random additions were either nearly identical in topology and likelihood to the tree shown in Fig. 3 or had much poorer likelihoods.
Figure 2.
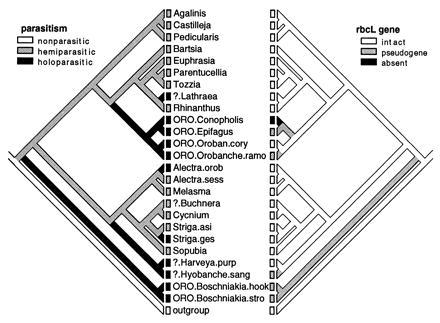
Evolution of parasitism and rbcL gene based on single rps2 tree of 499 steps congruent with ML solution. Taxon legends as in Fig. 1. Character transformations are ordered as follows and treated as irreversible (35), aiding in the interpretation of some ancestral states: nonparasite → hemiparasite → holoparasite; rbcL present → rbcL pseudogene → rbcL absent.
Figure 3.
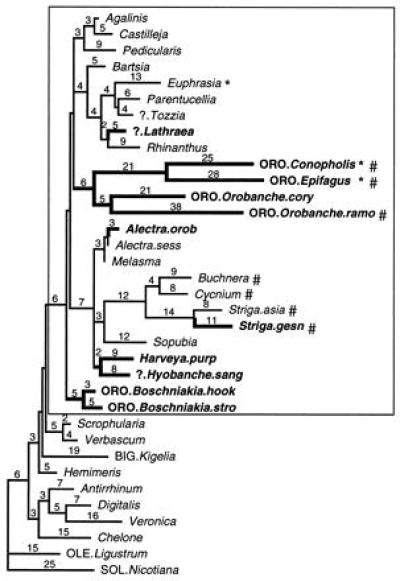
Branch lengths inferred by parsimony for rps2 evolution. Same tree topology as Fig. 2, but zero length branches are collapsed. Taxon legends as in Fig. 1. Branch lengths calculated by paup 3.1.1 (25) using acctran transformation; deltran gives essentially the same picture. Taxa with significant relative rate tests (Table 1) indicated with * (synonymous) or # (nonsynonymous). Holoparasites are shown in bold.
rbcL Assays.
PCR gave a strong amplification signal for rbcL from most plants (Fig. 2). A truncated product was obtained from Epifagus, confirming the deletion of a large portion of the rbcL gene (8, 16), and no product was obtained from Conopholis, consistent with the total loss of rbcL from the plastid genome of this species (7). Apparently full length amplification products were obtained from all other species in the study except Orobanche ramosa, which yielded an obviously truncated product. Hybridization of 32P-labeled tobacco rbcL to Southern blots with genomic DNA of each species gave strong hybridization to each plant with the following exceptions: Epifagus [very light (8)], Conopholis [no hybridization (7)], Orobanche ramosa (light), Boschniakia species (very light), Hyobanche (very light), suggesting that the rbcL sequence was particularly diverged in these species. Sequences of the PCR products from each of the holoparasites except Epifagus (16) and most of the hemiparasitic plants (ref. 46 and A.D.W. and C.W.D., unpublished work) confirmed that all represent full length rbcL sequences except Orobanche ramosa and Boschniakia species and Hyobanche, which have multiple length mutations resulting in rbcL pseudogenes.
rps2 Rate Analyses.
When trees are drawn with branch lengths proportional to mutations inferred by parsimony (Fig. 3), a complex pattern of rate variation is indicated. Long branches lead to the holoparasites Epifagus and Conopholis, reflecting the accelerated evolutionary rate for all translational genes in Epifagus (12, 13). However, not all holoparasites (e.g., Boschniakia, Lathraea) have long branches, and certain hemiparasites (Striga, Buchnera) appear to have accelerated rates of rps2 evolution. The likelihood calculated for this tree under the assumption of a strict molecular clock was −6651.10, significantly lower than that obtained without the assumption of a molecular clock [L = −3724.51; df = 33; P ≪ 0.05, by likelihood ratio test (30)]. Therefore, over the entire tree, these patterns of rate variation were significantly heterogeneous.
Relative rate tests using Verbascum as an outgroup and each of the parasitic taxa compared with Agalinis (Table 1; Fig. 3) indicated significant increases for taxa representing three clades: (i) synonymous sites are accelerated in Euphrasia; (ii) nonsynonymous sites are accelerated in Buchnera–Striga–Cycnium; and (iii) one or both are accelerated in Conopholis–Epifagus–Orobanche ramosa. Of these, only the latter group is nonphotosynthetic. No significant rate heterogeneity was detected for other parasites (Table 1 and other species not shown) although nonsignificant increases are seen in Parentucellia (synonymous) and Orobanche corymbosa (nonsynonymous). Essentially identical patterns of rate variation are detected when parasites are compared with Castilleja, another hemiparasite (results not shown). Additional tests, using Ligustrum as outgroup and comparing Agalinis or Castilleja to nonparasites Veronica, Kigelia, Chelone, or Verbascum, detected no significant rate variation (results not shown).
DISCUSSION
Phylogeny and the Evolution of Holoparasitism.
Phylogenetic analysis of rps2 sequence variation (Figs. 1 and 2) traces several key features of parasitic evolution in the Scrophulariaceae and Orobanchaceae. Following a single origin of parasitism, parasites underwent an initial radiation into four or more major lineages. These include three groups of predominantly hemiparasitic plants and one or more distinct lineages of nonphotosynthetic holoparasites traditionally recognized as Orobanchaceae (1).
The initial radiation probably was rapid, based on the very short, inferred branch lengths supporting the arrangement of the five most basal lineages within the parasite clade (Fig. 3). ML analyses found that none of these branches differs significantly from zero length whereas the major groups themselves are supported by significant nonzero branches (results not shown). A rapid establishment of these same major lineages (based on somewhat different taxon sampling) also is supported by phylogenetic analysis of rbcL sequence data (A.D.W. and C.W.D., unpublished data) and restriction fragment length polymorphism data from the inverted repeat of the plastid genome (C.W.D., C. Morden, and J. Palmer, unpublished data).
In contrast to the singular origin of parasitism, hemiparasitic plants clearly have given way to holoparasites on many occasions. Although the exact number of holoparasitic origins awaits fuller resolution of the phylogeny, these data indicate that holoparasites have evolved on at least five, and as many as eight, times within this group. This observation sheds light on long standing questions regarding classification in the Scrophulariaceae and Orobanchaceae. The so-called “transitional genera,” which have been classified alternatively in Scrophulariaceae based on floral and placentation morphology or in Orobanchaceae based on advanced parasitic ability (1), are clearly placed on the rps2 tree with other parasitic Scrophulariaceae. The loss of photosynthesis, a defining characteristic of the traditional Orobanchaceae (11), is clearly not a reliable synapomorphy for this group. The systematic implications of these findings will be considered in detail elsewhere; however, the rps2 tree does suggest that there is no compelling reason to maintain Orobanchaceae as a distinct family unless it is expanded to include the hemiparasitic Scrophulariaceae. In either case, all of the parasites may be viewed as members of a uniquely diverse parasitic group with members of widely varying parasitic dependence.
Alectra orobanchoides and Striga gesnerioides are the sole holoparasitic species in otherwise hemiparasitic genera. Both species retain rudimentary leaves and very low levels of chlorophyll despite having no net carbon gain under high light conditions (17, 36). These observations suggest that these “borderline” holoparasitic lineages may be of relatively recent origin. In contrast, other holoparasitic lineages define entire genera (Lathraea) or collections of genera (Orobanche plus Epifagus and Conopholis; Harveya plus Hyobanche). The precise inference of relative ages for the different holoparasitic lineages is not possible due to the heterogeneity in rps2 evolutionary rates.
Molecular Evolution.
The diversity of parasitic abilities in the Scrophulariaceae and Orobanchaceae and the identification of independent holoparasitic lineages make it possible to examine the molecular evolutionary events surrounding the loss of photosynthesis. Based on the present analysis, it is clear that the many similarities between the plastid genomes of Epifagus and Conopholis (7, 10) are characteristics they share because of close common ancestry. The additional loss of one copy of the inverted repeat from Conopholis (7) probably represents a more recent event, taking place since the divergence of Epifagus and Conopholis from their most recent common ancestor (10), assuming that this loss is irreversible. On the other hand, the loss of a functional photosynthetic gene from these holoparasites plus Hyobanche and Boschniakia (Fig. 2) may be viewed as parallel losses, given the probable evolutionary independence of these events. Continued study of plastid genome structure and sequence should make it possible to identify the degree to which parallel and/or convergent molecular events have taken place in these independent lineages of holoparasites (10).
These data also have revealed contrasting evolutionary dynamics for the chloroplast photosynthetic gene (rbcL) and a translational gene (rps2), relative to parasitic ability. Thalouarn and colleagues (9, 37, 38) have reported the retention of rbcL sequences in the plastid genomes of two holoparasites, Lathraea clandestina and Orobanche hederae, based on positive PCR amplifications and Southern blot hybridizations and, for Lathraea, DNA sequence (37). We confirm these findings for Lathraea clandestina and different species of Orobanche (O. corymbosa and O. fasiculata; ref. 46) and extend them significantly with additional parasitic taxa and a phylogenetic context for their interpretation. Holoparasites such as Lathraea and Alectra orobanchoides whose rbcL genes have have diverged little from their most recent photosynthetic ancestor might occasionally retain an intact rbcL by chance, even if selection is not acting to maintain a functional gene product (3, 5, 46). Alternatively, the evolution of photosynthetic pseudogenes in Epifagus, Orobanche ramosa, and other holoparasites and the eventual elimination of any recognizable rbcL sequence from the plastid genome of Conopholis (7) represent the expected end point for photosynthetic genes in nonphotosynthetic plants. Significantly, retention of rbcL sequences and pseudogenes in various stages of deletion suggests that the rate of organismal diversification of parasitic plants is more rapid than the process of pseudogene formation and loss (5).
The translational gene rps2 is retained intact in all of the species regardless of photosynthetic ability but has experienced accelerated rates of evolution in several hemiparasitic as well as holoparasitic groups (Fig. 3). This challenges earlier conclusions that enhanced rates of molecular evolution may be characteristic of holoparasitic lineages (10) based on observations of accelerated evolutionary rates in plastid genes of Epifagus (12, 13) and Cuscuta (5) and small subunit RNA genes in parasitic Viscaceae, Rafflesiaceae, Balanophoraceae, Hydnoraceae (39, 40), and other holoparasitic taxa (7). Surprisingly, although the greatest rates for rps2 are observed in a holoparasitic lineage (Epifagus and Conopholis), there is no clear relationship between holoparasitism and evolutionary rate. Several holoparasites, including Boschniakia and Lathraea, do not show any evidence of acceleration. Subtle rate variations in this data set could go undetected by the limited power of the statistical test when using relatively short DNA sequences (32, 33), but these seem unlikely for Boschniakia or Lathraea, which show no evidence of acceleration either with the relative rates tests (Table 1) or by inspection of the patterns of branch length variation (Fig. 3).
Distinct patterns of rate acceleration are seen at synonymous and nonsynonymous sites, indicating that at least two mechanisms are probably acting independently to generate the rate variations we observe. Enhanced rates of nonsynonymous substitutions, especially in lineages without increased synonymous rates, probably are due to a lessening of functional constraint on the S2 protein. We have hypothesized previously (12, 13) that the plastid translation apparatus of holoparasitic plants may be subject to less stringent selection when requirements for translation of highly abundant photosynthetic proteins have been dropped. These results suggest that any relaxation of selective constraints may be lineage-specific and apply to at least one lineage of hemiparasitic plants (Striga, Buchnera, Alectra).
Many factors could potentially influence rates of molecular evolution at synonymous sites (10, 40, 41), including shifts in base composition and/or codon usage, altered rates of mutation or repair of mutations, or the long term effects of population size or generation time. Several of these probably do not play much role in establishing the variable rates observed in parasitic Scrophulariaceae/Orobanchaceae. For example, base composition is nearly identical across all taxa in the data set, being within a few percentage points of the overall mean frequencies (see Results). Similarly, differences in codon bias across taxa in our data set are very small (data not shown).
Organisms with shorter generation times will diverge more rapidly because of the larger number of mutation-generating reproductive events (42). This generation-time hypothesis may account for a significant portion of the variation in evolutionary rate in rbcL among major groups of monocots (41). However, within the parasitic Scrophulariaceae/Orobanchaceae, there have been frequent shifts between perennial and annual lifestyle, and many genera include both annuals and perennials. For example, although Epifagus is an annual, Conopholis is a perennial (1). Orobanche has both perennial and annual species (20), and many other genera including Striga, Buchnera, and Alectra are also variable (1). Given the labile nature of generation time in the parasitic Scrophulariaceae/Orobanchaceae, it is unlikely that the substantial differences in rps2 evolutionary rate can be accounted for by this factor.
For these reasons, we conclude that substantial differences among parasitic lineages in synonymous substitution rates are most likely due to variation in fundamental mutation or repair rates. Our results suggest that, on at least two independent occasions (1-Euphrasia, 2-Epifagus and relatives), one or more of the components of plastid DNA replication or repair (43) experienced mutations that affected net rates of replication accuracy. The result has been an enhanced rate of sequence evolution evident at synonymous sites in plastid rps2 in these plants and in all other plastid-encoded protein genes in Epifagus (13). This conclusion is supported by the observation that nuclear small subunit RNA does not appear to have evolved at a significantly accelerated rate in Epifagus or several other Orobanchaceae (7). Because these genomes have distinct genetic machineries for DNA replication and repair (43), mutations to a plastid component should affect all plastid genes similarly but should not directly influence replication in any other cellular compartment.
Our analysis of plastid rps2 has revealed much about the organismal and molecular context for the evolution of holoparasitism. In addition to providing the first explicit phylogenetic hypotheses for parasitic Scrophulariaceae and Orobanchaceae, we have found that holoparasites have evolved from hemiparasites on a surprisingly large number of occasions in what previously was considered to be one holoparasitic lineage (1, 2, 11). This suggests that other groups of holoparasites, if amenable to molecular phylogenetic analysis (40, 44), may be found to have similarly complex evolutionary histories. In addition, our data illustrate that the dynamics of plastid genes depend on factors that differentially affect individual genes and individual lineages and on factors that should influence the evolution of multiple genes within a genome (41). By contrasting the varied evolutionary dynamics of rps2 in different lineages and the distinct patterns of rbcL retention and loss in these same lineages, it is clear that molecular events associated with the the loss of photosynthesis add another layer of diversity to this already unique group of parasitic plants. Thus, although it is true that the plastid genome is a single linkage unit that traces a single evolutionary history (45), the dynamics of different plastid genes may be even more varied than those of individual base positions within a gene sequence.
Acknowledgments
We thank Mr. J. Alison, Mrs. A. Batten, Ms. M. Weatherwax, and Drs. K. Steiner, L. Musselman, W. Wetschnig, G. Sallé, C. Morden, J. Palmer, and the late Drs. L. Heckard and T. I. Chuang for plants or DNAs used in this study; we also thank Mr. T. Atkinson, Mr. G. Winnier, and Mr. S. Valieka for technical assistance; Mr. A. Strand and Drs. K. Barfinger, W. Elisens, J. Leebens-Mack, B. Milligan, J. Palmer, K. Steiner, and B. Swalla for discussion or comments on the manuscript; and Dr. D. Swofford for advice on the bootstrap analyses. This work was supported by National Science Foundation Grant DEB-9120258, Vanderbilt URC and Natural Sciences Committee grants to C.W.D., and National Science Foundation Postdoctoral Fellowship BIR-9303630 to A.D.W.
ABBREVIATION
- ML
maximum likelihood
Footnotes
References
- 1.Kuijt J. The Biology of Parasitic Flowering Plants. Berkeley: Univ. of Calif. Press; 1969. [Google Scholar]
- 2.Press M C, Graves J D, editors. Parasitic Plants. London: Chapman & Hall; 1995. [Google Scholar]
- 3.Machado M A, Zetsche K. Planta. 1990;181:91–96. doi: 10.1007/BF00202329. [DOI] [PubMed] [Google Scholar]
- 4.Walsh M A, Rechel E A, Popovich T M. Am J Bot. 1980;67:833–837. [Google Scholar]
- 5.Haberhausen G, Valentin K, Zetsche K. Mol Gen Genet. 1992;232:154–161. doi: 10.1007/BF00299148. [DOI] [PubMed] [Google Scholar]
- 6.Wimpee C F, Morgan R, Wrobel R L. Curr Genet. 1992;21:417–422. doi: 10.1007/BF00351704. [DOI] [PubMed] [Google Scholar]
- 7.Colwell, A. (1994) in Genome Evolution in a Non-Photosynthetic Plant, Conopholis americana, Ph.D. dissertation (Washington University, St. Louis).
- 8.dePamphilis C W, Palmer J D. Nature (London) 1990;348:337–339. doi: 10.1038/348337a0. [DOI] [PubMed] [Google Scholar]
- 9.Thalouarn P, Theodet C, Russo N, Delavault P. Plant Physiol Biochem. 1994;32:233–242. [Google Scholar]
- 10.dePamphilis C W. In: Parasitic Plants. Press M C, Graves J D, editors. London: Chapman & Hall; 1995. pp. 177–205. [Google Scholar]
- 11.Cronquist A. The Evolution and Classification of Flowering Plants. Lawrence, KA: Allen Press; 1988. [Google Scholar]
- 12.Morden C W, Wolfe K H, dePamphilis C W, Palmer J D. EMBO J. 1991;10:3281–3288. doi: 10.1002/j.1460-2075.1991.tb04892.x. [DOI] [PMC free article] [PubMed] [Google Scholar]
- 13.Wolfe K H, Morden C W, Ems S C, Palmer J D. J Mol Evol. 1992;35:304–317. doi: 10.1007/BF00161168. [DOI] [PubMed] [Google Scholar]
- 14.Wimpee C F, Wrobel R L, Garvin D K. Plant Mol Biol. 1991;17:161–166. doi: 10.1007/BF00036822. [DOI] [PubMed] [Google Scholar]
- 15.Emms, S. C., Morden, C. W., Dixon, C. K., dePamphilis, C. W. & Palmer, J. D. (1995) Plant Mol. Biol.. [DOI] [PubMed]
- 16.Wolfe K H, Morden C W, Palmer J D. Proc Natl Acad Sci USA. 1992;89:10648–10652. doi: 10.1073/pnas.89.22.10648. [DOI] [PMC free article] [PubMed] [Google Scholar]
- 17.de la Harpe A C, Visser J H, Grobbelaar N. Z Pflanzenphysiol. 1981;103:265–276. [Google Scholar]
- 18.Stewart G R, Press M C. Annu Rev Plant Physiol. 1990;41:127–51. [Google Scholar]
- 19.Musselman L J. Annu Rev Phytopathol. 1980;18:463–489. [Google Scholar]
- 20.Beck vonMannagetta G. In: Orobanchaceae. Engler A, editor. Vol. 96. Weinheim, Germany: H. R. Engelmann; 1930. pp. 1–348. [Google Scholar]
- 21.Wettstein R. In: Scrophulariaceae. Engler A, Prantl K L, editors. 1897. [Google Scholar]
- 22.Olmstead R G, Bremer B, Scott K M, Palmer J D. Ann Mo Bot Gard. 1993;80:700–722. [Google Scholar]
- 23.Doyle J J, Doyle J L. Phytochem Bull. 1987;19:11–15. [Google Scholar]
- 24.Casanova J W, Pannetier C, Jaulin C, Kourilsky P. Nucleic Acids Res. 1990;18:4028. doi: 10.1093/nar/18.13.4028. [DOI] [PMC free article] [PubMed] [Google Scholar]
- 25.Swofford D L. paup: Phyogenetic Analysis Using Parsimony. Champaign, IL: Illinois Natural History Survey; 1993. , Ver. 3.1.1. [Google Scholar]
- 26.Felsenstein J. Evolution. 1985;39:783–791. doi: 10.1111/j.1558-5646.1985.tb00420.x. [DOI] [PubMed] [Google Scholar]
- 27.Bremer K. Evolution. 1988;42:795–803. doi: 10.1111/j.1558-5646.1988.tb02497.x. [DOI] [PubMed] [Google Scholar]
- 28.Johnson L A, Soltis D E. Syst Bot. 1994;19:143–156. [Google Scholar]
- 29.Felsenstein J. J Mol Evol. 1981;17:368–376. doi: 10.1007/BF01734359. [DOI] [PubMed] [Google Scholar]
- 30.Felsenstein J. phylip: Phylogeny Inference Package. Seattle: Univ. of Washington; 1993. [Google Scholar]
- 31.Olsen G J, Matsuda H, Hagstrom R, Overbeek R. Comput Appl Biosci. 1994;10:41–48. doi: 10.1093/bioinformatics/10.1.41. [DOI] [PubMed] [Google Scholar]
- 32.Muse S V, Weir B S. Genetics. 1992;132:269–276. doi: 10.1093/genetics/132.1.269. [DOI] [PMC free article] [PubMed] [Google Scholar]
- 33.Muse S V, Gaut B S. Mol Biol Evol. 1994;11:715–724. doi: 10.1093/oxfordjournals.molbev.a040152. [DOI] [PubMed] [Google Scholar]
- 34.Shinozaki K, et al. EMBO J. 1986;5:2043–2049. doi: 10.1002/j.1460-2075.1986.tb04464.x. [DOI] [PMC free article] [PubMed] [Google Scholar]
- 35.Maddison W P, Maddison D R. MacClade. Sunderland, MA: Sinauer; 1992. [Google Scholar]
- 36.Graves J D, Press M C, Smith S, Stewart G R. Plant Cell Environ. 1992;15:283–288. [Google Scholar]
- 37.Delavault P, Sakanyan V, Thalouarn P. Plant Mol Biol. 1995;29:1071–1079. doi: 10.1007/BF00014978. [DOI] [PubMed] [Google Scholar]
- 38.Thalouarn P, Renaudin S. C R Acad Sci Ser III. 1991;313:381–388. [PubMed] [Google Scholar]
- 39.Nickrent D L, Schuette K P, Starr E M. Am J Bot. 1994;81:1149–1160. [Google Scholar]
- 40.Nickrent D L, Starr E M. J Mol Evol. 1994;39:62–70. doi: 10.1007/BF00178250. [DOI] [PubMed] [Google Scholar]
- 41.Clegg M T, Gaut B S, Learn G H, Jr, Morton B R. Proc Natl Acad Sci USA. 1994;91:6795–6801. doi: 10.1073/pnas.91.15.6795. [DOI] [PMC free article] [PubMed] [Google Scholar]
- 42.Wu C-I, Li W-H. Proc Natl Acad Sci USA. 1985;82:1741–1745. doi: 10.1073/pnas.82.6.1741. [DOI] [PMC free article] [PubMed] [Google Scholar]
- 43.Heinhorst S, Cannon G C. J Cell Sci. 1993;104:1–9. [Google Scholar]
- 44.Nickrent D L, Franchina C R. J Mol Evol. 1990;31:294–301. doi: 10.1007/BF02101124. [DOI] [PubMed] [Google Scholar]
- 45.Doyle J J. Syst Bot. 1992;17:144–163. [Google Scholar]
- 46.Wolfe A D, dePamphilis C W. Plant Mol Biol. 1997;33:965–977. doi: 10.1023/a:1005739223993. [DOI] [PubMed] [Google Scholar]