

Abstract
Field potentials recorded in the olfactory bulb glomerular layer (GL) are thought to result mainly from activation of mitral and tufted cells. The contribution of juxtaglomerular cells (JG) is unknown. We tested the hypothesis that JG are the main driving force to novel spontaneous glomerular layer field potentials (sGLFPs), which were recorded in rat olfactory bulb slices maintained in an interface chamber. We found that sGLFPs have comparable magnitudes, durations and frequencies both in standard horizontal slices, where all layers with all cell types were present, and in isolated GL slices, where only JG cells were preserved. Hence, the impact of mitral and deep/medium tufted cells to sGLFPs turned out to be minor. Therefore, we propose that the main generators of sGLFPs are JG neurons. We further explored the mechanism of generation of sGLFPs using a neuronal ensemble model comprising all types of cells associated with a single glomerulus. Random orientation and homogenous distribution of dendrites in the glomerular neuropil along with surrounding shell of cell bodies of JG neurons resulted in substantial spatial restriction of the generated field potential. The model predicts that less than 20% of sGLFP can spread from one glomerulus to an adjacent one. The contribution of JG cells to the total field in the center of the glomerulus is estimated as ~50% (~34% periglomerular and ~16% external tufted cells), whereas deep/medium tufted cells provide ~39% and mitral cells only ~10%. Occasionally, some sGLFPs recorded in adjacent or remote glomeruli were cross-correlated, suggesting involvement of interglomerular communication in information coding. These results demonstrate a leading role of JG cells in activation of the main olfactory bulb (MOB) functional modules. Finally, we hypothesize that the GL is not a set of independent modules, but it represents a subsystem in the MOB network, which can perform initial processing of odors.
Keywords: electrogenesis, slices, glomerular layer, closed field, model
Field potentials recorded in brain tissue are generated by summation of electrical fields’ f neuronal dipoles (Lorente de Nó, 1947; Buresh et al., 1962; Hubbard et al., 1969; Guselnikov, 1976; Karnup, 1980, 1982). Synchronous fluctuations of electrical charges on similarly oriented ends of dipoles, for instance in apical dendrites of pyramidal cells in the hippocampus or neocortex, result in electroencephalographic (EEG) waves. In brain structures, lacking comparable orientation of neuronal dipoles or constructed of quadrupole-like multipolar neurons, a distinctive EEG cannot be recorded (Buresh et al., 1962; Guselnikov, 1976). In layered structures, such as the hippocampus and neocortex, current source density analysis can determine where the majority of synchronously depolarized neuronal compartments are located (for a review, see Mitzdorf, 1985). An active zone (in which neurons are depolarized by ionic current influx, hence the extracellular potential is negative) and a passive zone (with a phase reversal of the extracellular field due to the dipolar properties of cells) are referred to as the sink and source, respectively. In such structures, the sink is readily revealed upon orthodromic stimulation resulting in a synchronized excitatory synaptic input (Lambert et al., 1991; Aroniadou and Keller, 1993; Kandel and Buzsaki, 1997). Similar observations have been made in the main olfactory bulb (MOB) (Aroniadou-Anderjaska et al., 1999). This structure is stratified and has five main layers (from the surface to depth): olfactory nerve layer (ONL), glomerular layer (GL), external plexiform layer (EPL), mitral cell layer (MCL) and granule cell layer (GCL). The olfactory nerve (ON) establishes synaptic contacts exclusively in the GL, in the neuropil of spherical structures about 100–120 μm in diameter, which are referred to as glomeruli. In rat, each glomerulus in vivo comprises the apical dendritic tufts of 13–25 mitral cells, of about 25–50 medium and deep tufted cells and dendrites of 1500–2000 juxtaglomerular (JG) cells (Allison, 1953; Meisami and Safari, 1981; Frazier and Brunjes, 1988; Royet et al., 1988; Shipley et al., 1996; Royet et al., 1998). Cell bodies of JG neurons surround the glomerular neuropil, thus constituting a structural and a functional module (Fig. 1A). A conspicuous feature of the MOB is that the dendrites of all neurons that have been described so far, possess both postsynaptic and presynaptic loci; therefore, dendrodendritic synaptic interactions provide the majority of interneuronal communications within the bulb (Pinching and Powell, 1971a; Isaacson, 1999; Isaacson and Strowbridge, 1998; Sassoe-Pognetto and Ottesen, 2000; Schoppa and Urban, 2003). Despite their key position in the pathway of transmission of odor information to the brain, the role of JG cells is poorly understood. JG cells comprise three morphologically different kinds of neurons: periglomerular (PG), external tufted (ET) and short-axon (SA) cells. The primary dendrites of PG and ET cells converge toward the center of the glomerulus, resulting in roughly radial symmetry of the module. In contrast, SA cells do not belong to any particular glomerulus—their dendrites and axons are arbitrary directed and randomly distributed in the extraglomerular space—so they are in position to provide interglomerular interactions (Aungst et al., 2003). The primary dendrites of each PG, ET, tufted and mitral cell are affiliated with a single glomerulus (with few exceptions; Shipley et al., 1996). Dendritic arborizations of such a cellular ensemble constitute the glomerular core (neuropil) with an essentially homogenous density (Pinching and Powell, 1971b). Cell bodies of mitral cells are located in the MCL about 200–300 μm away from their tufts, thus forming large dipole moments. Deep and medium tufted cells have shorter primary dendritic shafts, which are often oriented obliquely in various directions (Macrides and Schneider, 1982). In contrast, mitral/tufted (M/T) cells have long lateral dendrites in the EPL, extending up to 1 mm (Fig. 1A and Fig. 6). Thus, a sub-population of M/T neurons, whose apical dendrites are affiliated with a single glomerulus, creates a very local concentrated sink and a broadly distributed source. When the ON is stimulated a number of glomeruli are simultaneously activated, resulting in a pronounced sink in the GL and a corresponding source in the MCL and the lower EPL (Aroniadou-Anderjaska et al., 1999). Thus, the current viewpoint is that the sink in the GL is generated primarily by synchronous depolarization of mitral and tufted cell tufts, whereas the impact of JG cells is negligible because they do not have large dipole moments and they are not oriented parallel to each other (Mori, 1987; Shipley et al., 1996). Hence, their synaptic currents were considered unlikely to contribute significantly to local field potentials (Rall and Shepherd, 1968).
Fig. 1.

(A) Scheme of olfactory bulb layers. Dashed circles in the GL indicate the border between the glomerular neuropil and the surrounding shell of JG cell bodies. In the left glomerulus only dendrites of JG cells arborizing within the glomerular core are shown. In the central glomerulus only dendritic arborizations of M/T cells are shown. Secondary dendrites of tufted cells and lateral dendrites of mitral cells in the EPL are curtailed. (B–D) Olfactory bulb slice preparations. (B) Horizontal slice of the MOB. (C) Isolated segment of the GL from a horizontal slice. Recordings were performed from GL sites free of adjacent EPL. (D) Tangential slice of GL + ONL made from the medial blade of the MOB (GL on the upper surface with ONL underneath). Recordings were performed from sites free of EPL remains.
In the present study, we show that spontaneous field potentials can be recorded without any stimulation in acute MOB slices in normal artificial cerebrospinal fluid (ACSF). Furthermore, spontaneous field potentials of comparable amplitude and duration can also be recorded in slices containing only the GL. Therefore, a substantial part of these field potentials may be generated by the ensemble of JG cells. This hypothesis is further supported by modeling the fields produced by the glomerular module. We assumed that an extracellular field potential in the GL originates from the simultaneous depolarization of the majority of dendrites within the glomerular core. The constructed electrostatic model was based on the basic anatomy of the olfactory bulb, where subsets of mitral, tufted and JG neuron types generated electrical fields in accordance with their known location and morphology. Both experimental and simulated data strongly suggest a preponderant contribution of JG cells to the total glomerular field as compared with mitral and tufted cells.
EXPERIMENTAL PROCEDURES
Sprague–Dawley rats (21–30 days old) of either sex were anesthetized with chloral hydrate and decapitated in accordance with Institutional Animal Care and Use Committee and NIH guidelines. Every effort was made to minimize the number of animals used and their suffering. The olfactory bulbs were removed and immersed in the ice-cold sucrose-containing artificial cerebrospinal fluid (sACSF) saturated with 95% O2 and 5% CO2 gas mixture (pH = 7.4). The sACSF had the following composition in mM: 26 NaHCO3, 1 NaH2PO4, 2KCl, 0.2 CaCl2, 5 MgSO4, 10 glucose, and 248 sucrose. Slices were cut with a vibratome (OTS-4000, Electron Microscopy Sciences, Hatfield, PA, USA). Three types of slice preparations were used. 1) Control slices are conventional 400 μm horizontal slices parallel to the bottom of the MOB (Fig. 1B). 2) Isolated segments of the GL were excised from a 400-μm- or 200-μm-thick horizontal slice (Fig. 1C); as a variation of the isolated GL in a few horizontal slices a longitudinal cut in the EPL between GL and MCL was made. 3) Tangential 400-μm-thick slices made from the medial side of the MOB contained the ONL and the GL (Fig. 1D). Immediately after preparation, slices were placed for 15–20 min into a beaker containing normal ACSF at 30 °C for recovery. The ACSF was equilibrated with 95% O2–5% CO2 and had a composition in mM: 124 NaCl, 26 NaHCO3, 3 KCl, 1.25 NaH2PO4, 2 CaCl2, 1.7 MgSO4, and 10 glucose. For field potential recordings, slices were transferred to the interface chamber and left for 1 h for adaptation at 32 °C and perfused at a rate of 2 ml/min with normal O2/CO2-equilibrated ACSF. A flow of the same humidified gas mixture was continuously maintained above the slices. Unless otherwise stated, individual cells from all layers were recorded and filled with biocytin in the whole-cell configuration in the submerged mode under visual control using differential interference contrast (DIC) optics. The interface mode favors the recording of high amplitude evoked and spontaneous field potentials. However, we could conduct whole-cell recordings in the interface chamber only from mitral cells, but did not succeed in blind patching of JG cells, probably because they have small size and are loosely packed. In contrast, whole-cell recordings from JG cells under visual control in the submerged mode were performed routinely, but in this configuration evoked field potentials (eFP) were greatly attenuated (compared with interface mode) and spontaneous field potentials were undetectable.
Pipettes for extracellular and whole-cell microelectrodes were pulled from borosilicate capillaries with an inner filament (1.5 mm o.d., Clark, Kent, UK) on a pipette puller (P-97, Sutter Instrument Company, Novato, CA, USA). The pipettes for field potential recordings had a tip-width of 2 μm and they were filled with ACSF, which gave a DC-resistance of 3–5 MΩ in the bath solution. Field potentials were obtained with DP-301 amplifiers (Warner Instrument Corporation); the bandwidth of amplifiers during the recording was set at 0.1 Hz–1 kHz. EFPs were obtained using GRASS S8800 stimulator (Astro-Med, West Warwick, RI, USA) and a bipolar tungsten electrode (20 μm tip diameter). A site of stimulation was located in the ONL 100–200 μm rostrally from a recorded glomerulus. Whole-cell recordings were obtained with an Axopatch 200B amplifier (Axon Instruments) with a low-pass filter set at 2 kHz. The pipettes for whole-cell configuration were filled with the intracellular solution containing (mM): 144 K-gluconate, 2 NaCl, 2 MgCl2, 10 Hepes, 0.2 EGTA, 3 Mg2-ATP, 0.3 Na2-GTP and 0.2% biocytin hydrochloride (270 mOsm, pH 7.3) which gave 5–8 MΩ DC-resistance in the bath solution.
Data acquisition was performed with DigiData1200 A/D interface and pClamp8 software (both Axon Instruments, Foster City, CA, USA). Data were stored on the hard disk of the computer for off-line analysis.
All drugs were obtained from Tocris Cookson (Ellisville, MO, USA) (AMPA receptor blocker 6-cyano-7-nitroquinoxaline-2,3-dione (CNQX); NMDA receptor blocker D-(−)-2-amino-5-phosphopentanoic acid (D-AP5); GABAA receptor blocker bicuculline (BIC) methochloride).
Data analysis was performed with the Clampfit-8 (Axon Instruments), Origin-6 (Microcal Software Inc., Northampton, MA, USA) and MiniAnalysis (Synaptosoft Inc., Decatur, GA, USA) software packages. The amplitude of the sGLFP was measured from the onset to the peak; duration at half the amplitude is referred to as sGLFP half-width; rise time was measured from 10% to 90%, and 90% to 10% decay time was extrapolated by one exponential fit. Data, expressed as mean ± S.D., were statistically analyzed with the one-way ANOVA test with the significance level set to P = 0.05. Cross-correlation between paired traces of field potentials was calculated with custom-made software over 4 s-long fragments. The calculated cross-correlogram was then normalized by the square root of the product of the autocorrelogram values of the two traces at zero lag time, so the cross-correlation function (CCF) was independent of actual amplitudes in the traces. Then individual CCFs built for a row of successive sweeps were averaged and ± 5% confidence level was calculated for averaged cross-correlation function (avgCCF).
Development of biocytin-filled neurons has been described elsewhere (Hayar et al., 2004a,b) and their reconstruction under the light microscope was performed with Neurolucida software (MicroBrightField, Colchester, VT, USA). To estimate how many JG and tufted cells are bound to an average glomerulus, a set of five acute slices was fixed after 1–2 h of incubation, then each slice was cut to 60 μm-thick sections and mature neurons were revealed with the antibody NeuN. In a selected segment of the medial blade (Fig. 8I)(approximately 2/3 of the OB length, similar to that of a dissected segment in Fig. 2B) all well-stained cells in the GL and EPL were counted; poorly labeled cells were discarded as they could be either cells degrading in the course of incubation or immature neurons developing from progenitors migrating into GL through EPL from the rostral migratory stream. After 3D-reconstruction of the segment, we calculated the numbers of JG and tufted cells per one glomerulus in a given slice, and then we averaged these numbers over all slices.
Fig. 2.
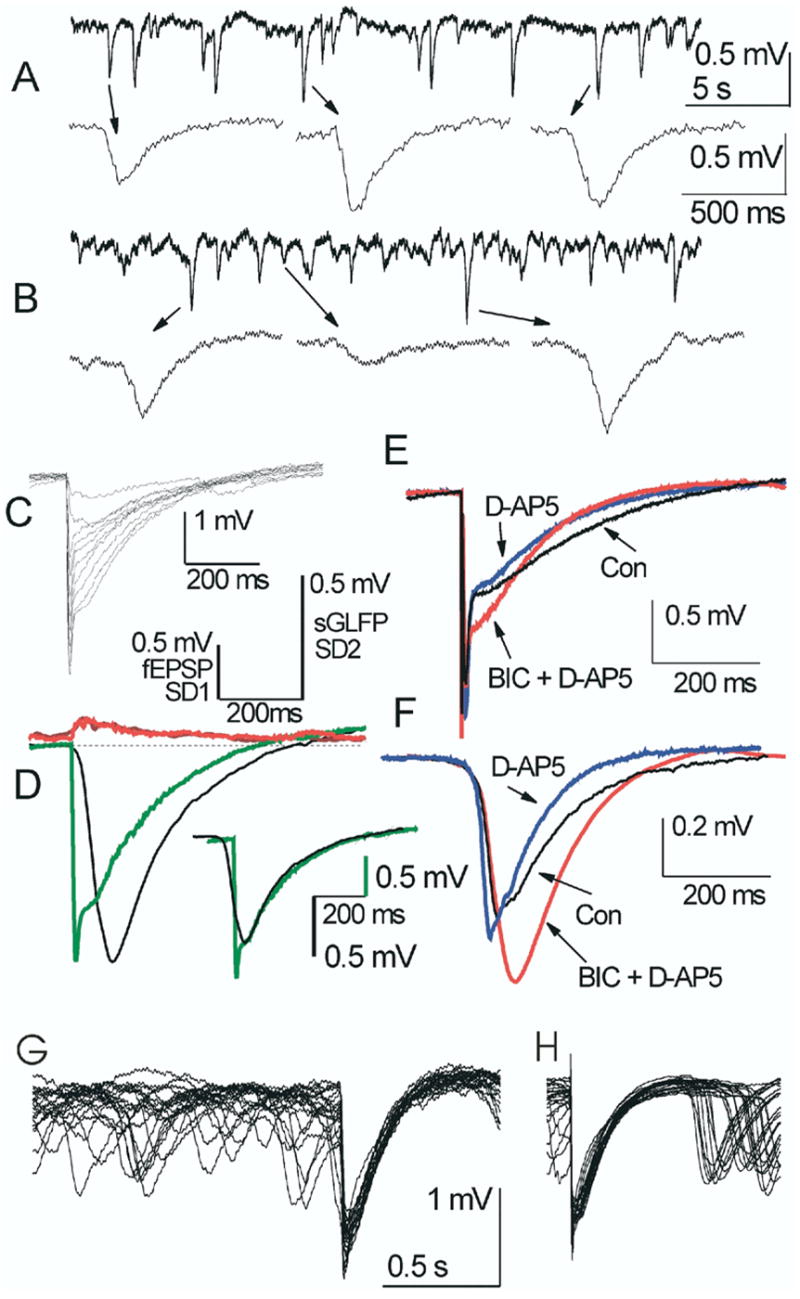
Spontaneous glomerular field potentials in two different control slices (A and B). Insets show some individual sGLFPs. Note various amplitudes and time courses of spontaneous events. (C) eFPs in the GL are comparable in their time course and amplitudes with sGLFPs. Incremental rise of stimulus intensity from 10 to 100 μA (Δ = 10 μA) was followed by rise in the eFP amplitude and gradual development of a fast initial phase. (D) Averaged eFP in this site (n = 10, stimulation at 30 μA, green line) and an average of 10 sGLFPs exceeding 90% of the largest sGLFP (n = 10, black line) display identical duration and identical distributions of standard deviations (SD1 (red) for eFP and SD2 (brown) for sGLFP). Scales above are given for averaged eFP with its standard deviation SD1 (left scale) and for averaged sGLFP with its standard deviation SD2 (right scale). Adjustment of the averaged sGLFP peak and maximum of a slow eFP to the same point reveals an identical decay time course and different rise time (D, inset). Note difference in amplitude scaling for sGLFP and eFP. (E) Averaged eFP (n = 10) with stimulation at 100 μA in another slice and (F) averaged sGLFP from the same recording site (n = 10, > 90% of the maximal amplitude) display similarity in changes upon application of synaptic blockers. NMDA-receptor blocker D-AP5 shortened decay time and GABAA-receptor blocker BIC increased amplitudes in both sGLFP and eFP (slow phase) to a similar extent. (G, H) Overlapping eFP along with fragments of spontaneous field activity in two different slices treated with BIC. Note occlusion of sGLFP by eFP and similar decay kinetics in eFP and the highest sGLFPs.
To reconstruct the spatial distribution of field potentials generated by a unitary structural module, we designed a mathematical model comprising 280 JG (= 230 PG + 50 ET) cells, 50 tufted cells and 10 mitral cells based on counts of NeuN-labeled neurons. The calculations were based on the assumption that during depolarization, the intraglomerular neuropil bears a uniformly distributed extracellular negative charge, whereas the soma along with secondary (in tufted cells) or lateral (in mitral cells) dendrites creates an equal positive extracellular charge. The charges of each cell were then divided by 200 (arbitrary chosen number of a unitary charge fragments) and distributed along corresponding dendrites. Synaptic density and degree of synaptic activation within the neuropil was presumed constant for all cells. Since a JG cell was assumed to have only primary dendrites arborizing in the glomerular core, all the JG cell positive charge was concentrated at the soma. It was also assumed that a mitral, tufted and ET cell has two times more extensive intraglomerular dendritic arbor than that of a PG cell (see Table 2). Thus, a negative intraglomerular charge per mitral, tufted or ET cell is twice as big as that of a PG cell; as a consequence, secondary dendrites in a tufted cell and lateral dendrites in a mitral cell and soma in an ET cell bear positive charges twice that of a PG soma. The combined negative charge of intraglomerular dendrites from all neurons was evenly distributed within the neuropil resulting in a localized sink of the module. The combined positive charge of all PG cell bodies was evenly distributed over the glomerular shell. The combined positive charge of ET cells was distributed over the lower hemisphere of the glomerular shell. The combined positive charge of tufted cells was distributed in the upper half of EPL within a slab of 400 × 400 × 100 μm in (x, y, z) directions, respectively, which gave rise to a tufted cells’ scattered source; here we set the upper EPL thickness at 100 μm (total EPL thickness is 200 μm, z axis), secondary dendrites were randomly oriented within 400 μm around the central point and the glomerular sphere was at the center on top of the slab. The combined positive charge of mitral cells was distributed in the analogous slab occupying the lower half of the EPL with the dimensions 1000 × 1000 × 100 μm and gave rise to mitral cells’ scattered source; predominant location of lateral dendrites in the lower EPL was based on anatomical data (Macrides and Schneider, 1982). The y dimen sion of M-slab exceeded thickness of the slice (see Fig. 7B), but this overestimation allowed better assessment of M-cells’ impact in the in vivo conditions. The inversion points between negative and positive charges were set on the neuropil/shell border. The electrostatic potential V(r→) at the space point r→ outside the cell behaves according to the Coulomb’s law in the dielectric medium with the dielectric constant ε equal to that of the physiological electrolyte solution:
| (1) |
Table 2.
Morphometric data on intraglomerular dendritic arborization
| Parameter (M ± SE) | JG
|
M/Tb (n = 11)a | |
|---|---|---|---|
| PG (n = 15) | ET (n = 28) | ||
| Total length of dendrites in the tuft (μm) | 589 ± 78 | 1308 ± 185 | 1114 ± 161 |
| Ratio of a tuft area to its glom area (%) | 22 ± 0.4 | 61.5 ± 3.5 | 61.7 ± 7.5 |
Characteristics of mitral and tufted cells were not significantly different, therefore they were merged.
In Eq. (1) qi is the electrostatic charge at the point in space r→i which is a point on the cell membrane, |r→− r→i| is the distance from a point r→i to a point r→ in which the potential was measured. The sum runs over all points r→i of all neurons present in the model thus collecting the total electrostatic field generated by all neurons at the point r→. We calculated all potentials in arbitrary units and then normalized them to a maximum value of the total field potential, i.e. to the total field potential value at the center of the glomerulus. The model field potentials were reported along the line, which connected centers of glomeruli in the GL in the plane parallel to the olfactory bulb layers starting at the center of the glomerulus.
RESULTS
Glomerular field potentials
Extracellular field potential recordings were made in acute slices of the rat MOB. Three types of slices were used: (a) 400 μm thick horizontal slices of the MOB, which are referred to as standard or control slices (Fig. 1B); (b) isolated GL strips made from the standard slice with a cut at the GL–EPL border (Fig. 1C); (c) surface (tangential) slices containing only a flat sheet of the GL and the ONL (Fig. 1D).
In conventional horizontal slices spontaneous glomerular layer field potentials (sGLFP) represent irregular events (frequency = 0.85 ± 0.06 Hz, range 0.29–1.65 Hz) of negative polarity (Fig. 2A, B). An event was considered a sGLFP if its amplitude exceeded 0.8 mV from its base, the steepest slope of the rising phase was less than 0.03 mV/ms, and its rise time (range 7–250 ms) was shorter than its decay time (range 30–600 ms). Amplitude of the noise was M ± S.D. = 0.0032 ± 0.0139 mV (range −0.073–0.162 mV, n = 33 recording sites). Despite qualitatively distinct appearance, sGLFPs did not fit to a standardized shape even in the same trace and no clusters were observed in individual scatter plots (Fig. 3A–D). Scatter plots “HalfWidth vs. Amplitude” and “DecayTime vs. RiseTime” of pooled sGLFPs (n = 14,933, 33 sites) in 20 control slices, showed no correlation (correlation coefficients were 0.124 and 0.264, respectively) or clustering (not shown). The kinetics of large sGLFPs were strikingly similar to that of eFP produced by stimulation of the ON, suggesting that they may involve a common mechanism. In the case shown in Fig. 2D, the largest (> 90% of maximal amplitude) sGLFPs and eFP evoked by moderate stimulation (up to half maximum) had identical durations, distributions of standard deviations and comparable amplitudes. However, the average sGLFP for this site had a much slower rise time than the average eFP (105 and 9.8 ms, respectively). The rapid rise time of the fast early phase of eFP is due to the synchronizing effect of the ON activation. Thus, all stimulus-synchronized cellular voltage changes, including EPSPs and calcium spikes (McQuiston and Katz, 2001), may contribute to this population event. The slower kinetics of the late eFP phase and sGLFP were probably due to a gradual engagement of postsynaptic neurons, producing an avalanche of intraglomerular transmitter release. The possibility of a common mechanism generating both the sGLFP and the late phase of eFP is supported by the similarity of sGLFP and eFP decay course, by the occlusion of sGLFPs after eFP (Fig. 2G, H), and by the reduction of the late eFP when the stimulus was given during largest sGLFP (not shown). When sGLFP was normalized to the maximum of the late eFP phase and their peaks were superimposed (Fig. 2D, inset), a mono-exponential decay fit in these curves gave values of τ = 173 ms and τ = 192 ms for the averaged sGLFP and eFP, correspondingly. However, pooled over other eight control slices, the decay time constants of large (> 80% of max) sGLFP and eFP were significantly different (P < 0.05), showing values of τGLFP = 265 ± 10 ms (S.D. = 150, n = 222) and τFP = 233 ± 9 ms (S.D. = 139, n = 217). This difference may result either from involvement of additional neurons upon stimulation with different intensities or from subsequent recruitment of more neurons during the eFP decay. Blockade of GABAA-R-mediated inhibition by BIC eliminated the difference between τGLFP and τFP (see below). ON stimulation could elicit eFP of much greater amplitude than that of largest sGLFP at the same site, which is probably due to synchronized activation of many neighboring glomeruli upon electrical stimulation. In the case shown in Fig. 2, a maximal eFP could reach 4 mV (Fig. 2C), whereas the largest sGLFPs at the same site were only ~1.8 mV (Fig. 2D, black). On average, the ratio sGLFPmax/eFPmax in horizontal slices in normal ACSF was 0.27 ± 0.04 (n = 16, one recording site per slice).
Fig. 3.
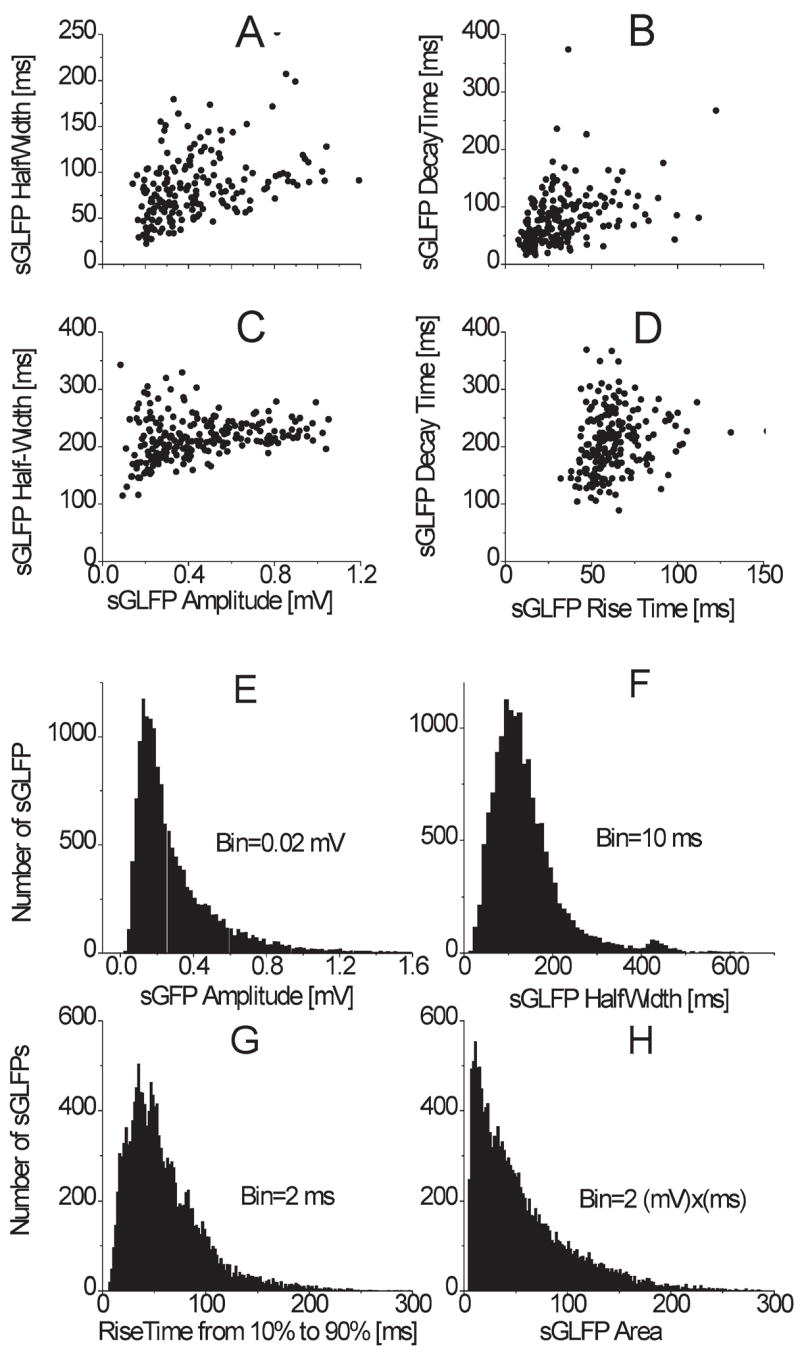
(A, B) Scatter plot for a single 10 min recording in a control slice (n = 203); C and D, scatter plot for a single 10 min recording in a tangential slice (n = 200). (A, C) Half-width vs. amplitude, B, D, decay time vs. rise time. Note poor correlation of parameters indicating lack of all-or-none mechanism. Distributions of amplitudes (E), half-widths (F), 10% to 90% rise times (G) and areas (H) of sGLFPs in control horizontal slices (n = 14,933).
To test whether the same synaptic receptors are involved in sGLFP and eFP formation, we blocked ionotropic glutamatergic and GABAA receptors. Bath application of synaptic blockers led to similar changes in both sGLFP and slow phase of eFP (Fig. 2E, F). Blockade of NMDA receptors with 20 μM D-AP5 did not substantially change the amplitude of either spontaneous or evoked events but shortened their half-width by 30% and 17%, correspondingly. This indicates that the slow late eFP phase is due to AMPA-R and NMDA-R activation; after NMDA-R blockade, the late phase is apparently generated by multiple AMPA-R-mediated overlapping asynchronous events. This suggests that a common mechanism produces both the late phase of sGLFPs and eFP but not their initiation. Involvement of recurrent inhibition in shaping these events was tested by subsequent application of GABAA receptor antagonist BIC (10 μ M). When GABAA-Rs were blocked, the amplitude of the late eFP phase as well as that of sGLFP significantly increased (36% and 32%, respectively; P < 0.05, n = 5) but the early eFP amplitude was unchanged. After application of BIC, the sGLFPmax/eFPmax ratio was increased from 0.27 ± 0.04 (n = 16) to 0.51 ± 0.11 (n = 5). In four slices treated with BIC, the decay time constants of eFP and sGLFP did not differ significantly, showing values of τFP = 242 ± 12 ms (S.D. = 168, n = 186) and τGLFP = 221 ± 9 (S.D. = 110, n = 144), correspondingly. This indicates that in the absence of inhibition similar neuronal populations are responsible for both evoked and spontaneous field potentials.
Spontaneous GLFPs were not all-or-none events as they varied considerably in amplitude, duration and shape (Fig. 3E–H). An averaged sGLFP in control slices (n = 14933, measured in 33 sites, 20 slices) had an amplitude of 0.29 ± 0.21 mV (mode 0.146 mV, range 0.05–1.6 mV), duration measured at half-maximal amplitude (half-width) of 139 ± 82 ms (mode 105.7 ms, range 13– 666 ms), 10%–90% rise time of 86.6 ± 46.4 ms (mode 38 ms, range 10–446 ms), decay time of 280 ± 145 ms (mode 106 ms, range 17–510 ms) (see Table 1, nFig. 3) and frequency of 0.85 ± 0.06 Hz (range 0.29–1.65 Hz). Measured sGLFP parameters in all individual control recordings did not create clusters (ex. Fig. 3A–D). Neither individual (Fig. 3A–D), nor pooled data ( = 14933, not shown) revealed correlation between the different measured parameters such as “half-width vs. amplitude” and “decay time vs. rise time.”
Table 1.
Parameters of sGLFP in standard horizontal slices (HS) and in slices of the IGL maintained in normal ACSF
| sGLFP parameter | Mean ± SD | Min | Max |
|---|---|---|---|
| Amplitude HS [mV] | 0.292 ± 0.216 | 0.028 | 1.669 |
| Amplitude IGL [mV] | 0.244 ± 0.190 | 0.033 | 1.325 |
| Rise time HS [ms] | 86.62 ± 46.44 | 10 | 446 |
| Rise time IGL [ms] | 92.43 ± 47.98 | 8.2 | 367 |
| Decay time HS [ms] | 280.05 ± 145.37 | 16.9 | 510 |
| Decay time IGL [ms] | 239.79 ± 122.68 | 13.5 | 401 |
| Area HS [mV ms]a | 56.12 ± 47.02 | 5 | 330 |
| Area IGL [mV ms]a | 40.33 ± 36.55 | 5 | 265 |
| HalfWidth HS [ms] | 139.67 ± 82.34 | 13.3 | 666 |
| HalfWidth IGL [ms] | 130.03 ± 70.07 | 20 | 535 |
Number of sGLFPs in HS was NHS = 14,933 (33 recording sites), in IGL it was NIGL = 5468 (nine recording sites): in all pairs means were significantly different (P < 0.05).
Because of the complex architecture of the MOB, the interpretation of the sGLFPs requires an understanding of the main generators of field fluctuations and spatial extent of the produced fields. The first (commonly accepted) hypothesis tested was whether sGLFPs are produced exclusively by synchronized activity of mitral cells. Three sets of data indicate that, to the contrary, sGLFPs are mainly generated by other cells. First, multiple electrode record ings did not show any indication of spread of sGLFP into EPL and the sGLFP phase did not reverse in the MCL, lower EPL and even upper EPL (Fig. 4A). Second, in glomerular strip preparations (Fig. 1C), sGLFP amplitudes and time course were similar to those recorded in horizontal slices (Fig. 4C; Table 1). Third, sGLFPs recorded from the GL in surface slices (Fig. 1D) were comparable to those recorded in control slices (Table 1) and sometimes were even greater than average sGLFPs recorded in intact horizontal slices (Fig. 4C, lower trace). Measurements of sGLFPs in glomerular strips and in surface slices were not significantly different; therefore, these measurements were pooled as those of isolated glomerular layer (IGL). Despite comparable properties of sGFLP in horizontal slices and in IGL, they differed significantly (P < 0.05; Table 1). Thus, experiments in which the GL was surgically isolated from the MCL/EPL resulted in two main findings. First, M/T cells do contribute, but only weakly, to sGLFP generation. Second, mitral and tufted cells are not the only types of neurons responsible for sGLFP generation. This suggests that JG cells are the major contributors to sGLFPs in acute MOB slices.
Fig. 4.
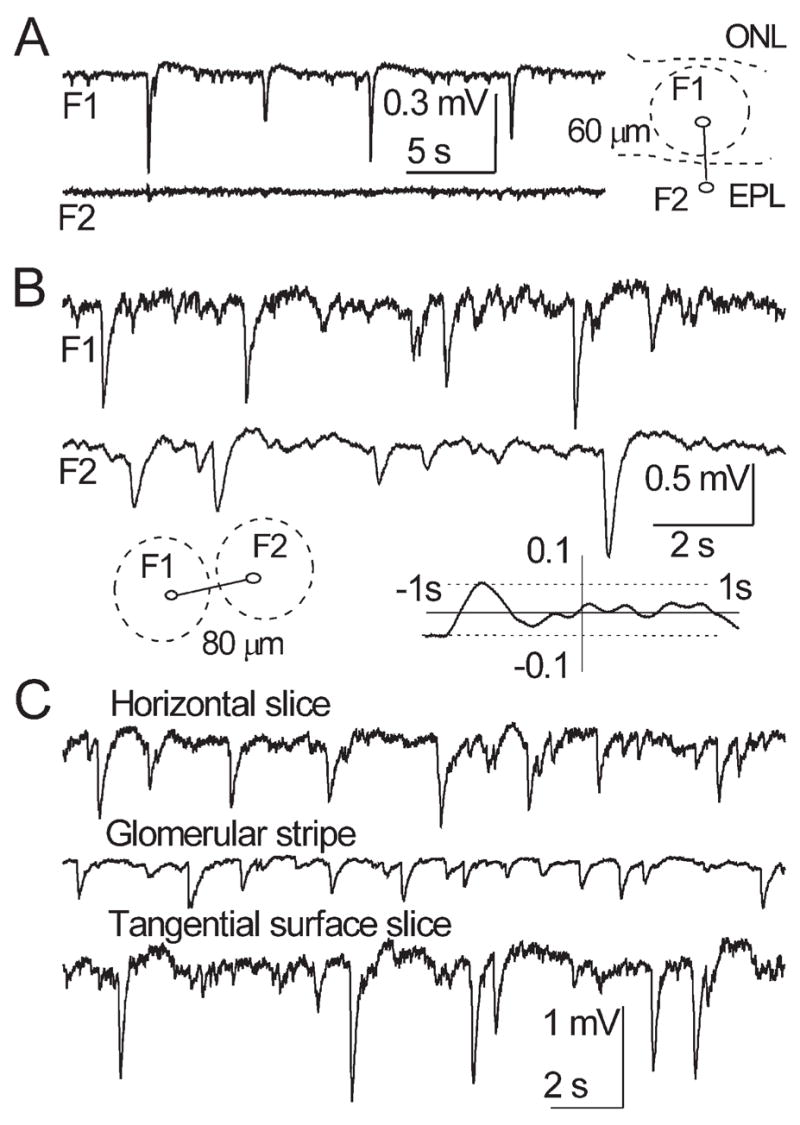
(A) Simultaneous recordings from a glomerulus in GL (F1) and a site in EPL below (F2). Sites F1 and F2 are 60 μm apart, dashed lines designate boundaries of layers and the glomerulus. Note total absence of a field spread or reversal in F2. (B) Simultaneous recordings from two adjacent glomeruli in a tangential slice. Sites F1 and F2 are 80 μm apart, dashed lines designate glomeruli (inset on the left). Note that even the largest sGLFPs in one site do not induce noticeable fluctuations in the other site. Lack of significant peaks in CCF (inset on the right) confirms independence of sGLFP occurrence in the two sites shown above. In this CCF the abscissa shows the average level (solid line, CCF = 0) and designates time lags from −1 s to +1 s; vertical solid line (the ordinate) is from −0.1 to +0.1; horizontal dashed lines above and below the abscissa designate ± 95% confidence interval. (C) Traces of sGLFP in a control horizontal slice (upper trace), in a stripe of isolated GL (middle trace), and in a tangential slice (lower trace). Somewhat lower sGLFP amplitudes in the glomerular strip are probably due to trauma while dissecting a 200 μm stripe from a horizontal 400 μm thick slice. sGLFPs in tangential slices sometimes could exceed those in control slices.
Next, we investigated whether sGLFPs are produced within an individual glomerulus or whether they represent the summation of fields from neighboring glomeruli, and how far the unitary sGLFP can propagate. Simultaneous recordings with one electrode placed in a glomerulus and another placed at a distance of ≥100 μm (in another glomerulus or in the interglomerular space), generally did not show similarity of sGLFP patterns and there was no significant cross-correlation (31 of 36, Fig. 4B). However, in a few cases the CCF displayed a significant peak with a phase lag, indicating a polysynaptic connection between the two sites (five of 36, P < 0.05) (Fig. 5A). In dual (n = 12) or triple recordings (n = 8) from adjacent glomeruli (microelectrode distance 80–120 μm), there was a weak or no significant cross-correlation between sGLFPs (Fig. 4B). Simultaneous recordings from three sites, either in the GL along the line parallel to MOB layers or along an arbitrary straight line in a surface slice, showed no evidence of a propagating excitatory wave. Precisely coinciding events, indicating a spread of the field from the same generator, were observed only when electrodes were separated by less than 50 μm (nμ5, Fig. 5B). Furthermore, dual recordings from the same glomerulus with inter-electrode distances of 30–40 μm inevitably demonstrated almost identical trains of sGLFPs and high correlation (cross-correlation coefficient was in the range 0.54–0.84, n = 6, not shown). This suggests that each sGLFP is generated within a single glomerulus and practically does not spread beyond the glomerulus border. This is consistent with the observation that sGLFPs were absent in the EPL just 20 μm below the GL (Fig. 4A).
Fig. 5.
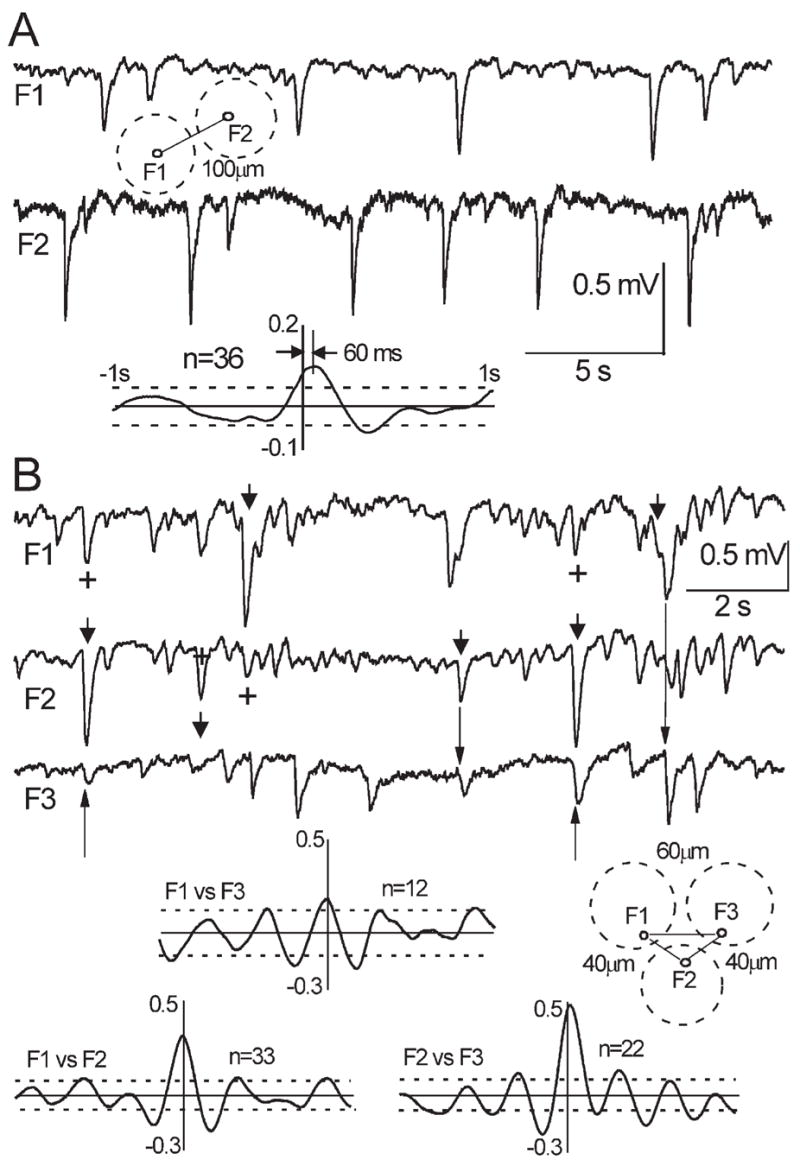
(A) Dual recording in a horizontal slice with an inter-electrode distance of 100 μm. Dashed circles indicate position of glomeruli. The averaged CCF (n = 36) shows significant correlation between sites with 60 ms time lag, indicating polysynaptically mediated propagation of excitation. (B) Triple recording in a horizontal slice with an inter-electrode distances: F1–F2 and F2–F3 40 μm, F1–F3 60 μm. Note utterly synchronous events, which are indicative of the field spread. Arrowheads designate bigger, presumably primary events; plus stands for presumably secondary events resulting from a field spread; arrows are pointed to slightly delayed sGLFP that could be initiated by primary sGLFP via interglomerular connections. The insets indicate positions of extracellular electrodes, dashed circles designate corresponding glomeruli; avgCCFs indicate passive propagation of the fields without time lags between the sites of recording. Note pronounced ~3 Hz patterns of background oscillations in F1 and F2 which also emerged in CCFs.
Morphological substrate of sGLFPs
The spatial distribution of field potentials generated by a unitary structural (“glomerular”) module was analyzed using a mathematical model. In this model we used morphometric data obtained from biocytin labeled neurons (Table 2). Examples of reconstructed cells and a reduced diagram of corresponding current flows are illustrated in Fig. 6. The mean number of JG and tufted cells associated with one glomerulus was estimated from calculations in five slices treated with the antibody NeuN, which selectively labels mature neurons. This resulted in a total of 57,474 GL-cells and 10,323 EPL-cells over 206 glomeruli. The average counts were 279.1 ± 11.7 GL-cells and 49 ± 3.8 EPL-cells per one glomerulus. These numbers probably underestimate the number of JG cells and overestimate the number of tufted cells. First, about half of the neurons in the GL were not counted due to poor staining with NeuN probably because of either degradation in the course of experiment or the immature state of newly developing neurons (Coskun and Luskin, 2002; Fukushima et al., 2002; Winner et al., 2002). Second, some EPL cells are local interneurons with short dendrites (Hamilton et al., 2005), therefore the actual number of tufted cells per glomerulus is likely to be lower than in our count. A glomerulus is known to be innervated in vivo by approximately 25 mitral cells (Allison, 1953; Frazier and Brunjes, 1988) or ~13–14 mitral cells (25 M/T cells) (Royet et al., 1998). This number should be lower in slices due to cell death during preparation and maintenance of slices. Direct calculation of mitral cells in NeuN-stained slices was unreliable as they were intermingled with granule cells embedded in the MCL. However, we estimated the number of mitral cells as ~10 per glomerulus. A similar number of 12 mitral cells (range 10–15) has been obtained upon microinjection of a fluorescent dye Alexa-AM into a single glomerulus in a horizontal 400 μm thick slice (Dr. Adam Puche, Department of Anatomy and Neurobiology, University of Maryland Medical School, personal communication). Thus, for the model the numbers of neurons innervating a glomerulus in a slice were taken as 280 JG, 50 tufted and 10 mitral cells. JG neurons with pear-like soma and robust primary dendritic shafts (characteristic to ET cells), and those with smaller round soma and relatively thin primary shafts (characteristic to PG cells) can be discriminated in the submerged slice under DIC optics (Hayar et al., 2004b). Using cell counts within the focal depth of 30–70 μm the ratio of ET to PG cells was estimated as ~0.2. Therefore the 280 JG cells in the model were composed from 230 PG and 50 ET cells. The 50 ET cells were positioned in the deeper hemisphere of the glomerular shell, since earlier we found that they are located predominantly in the lower GL where density of JG cells is higher than in the upper GL (Fig. 6I) (Hayar et al., 2004a).
Fig. 6.
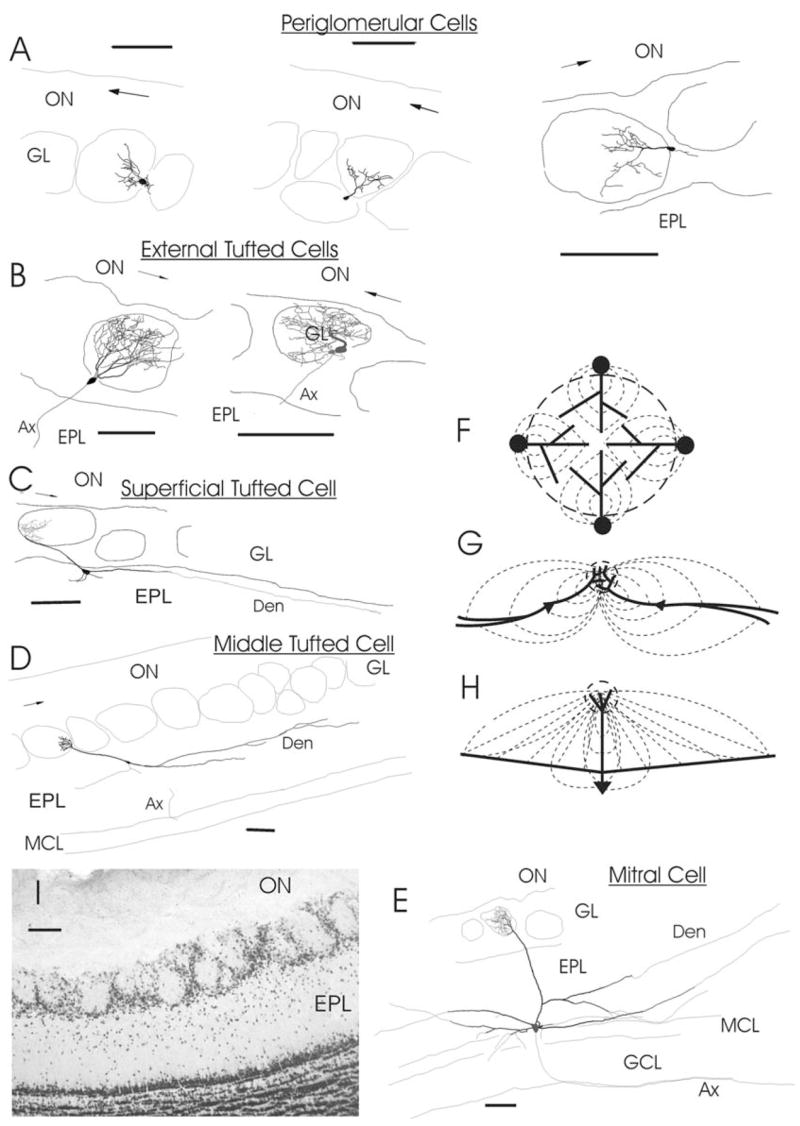
(A–E) Reconstructions of biocytin-labeled neurons having dendritic arborization in a single glomerulus. (A) Three PG cells with a branching primary dendrite (Den) within the glomerulus. (B) Two ET cells with the somata in the glomerular shell and an extensive dendritic tuft occupying entire glomerulus. (C) Superficial medium-tufted cell having long primary Den terminating with a tuft, cell body in the upper EPL and a few long secondary Dens parallel to GL/EPL border. (D) Medium-tufted cell with the soma deep in the EPL. (E) Mitral cell with a tufted primary Den and long lateral Dens. (F–H) Diagrams of current flow: (F) for a group of JG cells surrounding a glomerulus, (G) for tufted cells, (H) for mitral cell. Here dashed circle designates a glomerulus, thick lines are Dens and thin dashed lines are directions of currents. Note convergence of currents from broadly distributed sources of M/T cells into a comparatively small sink in the glomerular core. In contrast, somata of JG cells create a source distributed primarily in the glomerular shell and Dens give rise to a sink in the core. In the reconstructions Ax stands for an axon; arrow in the ON shows rostro-caudal direction. Scale bars = 100 μm in all drawings and on the photo. (I) photograph of a fragment from 60 μm-thick section immunolabeled with NeuN for mature neurons.
Modeling of sGLFP
A computer model with spatially distributed static charges, was designed to estimate the propagation of the field potential generated by the functional module. The spatial profile of the instantaneous (i.e. static) electric field was assessed in the plane parallel to OB layers. We have to emphasize, that this model is a first approximation and a very simplified estimate of instantaneous voltage field profile at its maximum regardless of its dynamics. Therefore, current flow underlying generation of the field, intraglomerular compartmentalization and intracellular/extracellular conductances were not considered. The model was designed solely to roughly assess the relative contribution of different cell types to the total field and to assess spatial profile of these contributions, but not to describe the process of field generation. The currents-based model would be substantially more complex and is the goal for future developments.
It was assumed that all elements of a complex module are synchronously activated to a maximum degree. Such activation means depolarization of all dendrites of each cell within the glomerular neuropil. Since JG cells and M/T cells are differently organized within the module, we divided the module into two subunits representing JG and M/T cell populations (Fig. 7A, B). In the first subunit, JG cells had all depolarized dendrites uniformly distributed in the core of the sphere (sink); cell bodies of PG cells were uniformly distributed around the surface of the sphere and cells bodies of ET cells covered only the deeper half of the sphere (source) (Fig. 7A). Together, they composed a closed field because outside of the sphere negative and positive charges mostly neutralized each other (Fig. 7C, D). The spatial profile of the potential generated by a set of tufted cells was lower in maximal amplitude but substantially broader than that of JG cells and somewhat resembled the open field profile (Fig. 7D). The tufts of tufted cells create a concentrated sink in the glomerular core, which is only slightly neutralized by scattered somata and secondary dendrites. Mitral cells create a similar, although a much weaker field. Comparison of contributions from the three cell types shows an obvious preponderance of JG cells in generating the total field (Fig. 7D). JG cells account for about 50.5% of the maximum intraglomerular field (34.4% PG cells and 15.7% tufted cells), whereas tufted cells account for ~38.8% and mitral cells only for 10.4% of the maximum sGLFP at the center of the glomerulus. At the neuropil/shell border, the field drops to 30% of its magnitude in the center. With the assumption that two adjacent glomeruli are separated by only a monolayer of JG cell bodies (~10 μm, although in reality it may be two or three cells thick, Fig. 7I), one can assess the portion of the field invading the adjacent glomerulus as ~20% and ~8% of its maximum on the border and in the center, correspondingly (Fig. 7F). Importantly, the field propagating beyond the glomerulus border is produced by M/T cells, whereas the JG field is completely nullified at this point. Thus, the model predicts that in the intact OB or in the submerged conventional slice where glomeruli have non-skewed spherical shape, field potential deviations of up to ~20% of the maximal amplitude can result from passive spread of sGLFP from the neighboring sphere.
Fig. 7.

Modeling of spatial distribution of a glomerular field potential. Two imaginary partial modules that together constitute the whole structural functional ensemble contribute differently in the entire field. (A) Glomerular sphere with negatively charged dendritic neuropil (red) and the outer shell of JG cell bodies (blue); a segment of the glomerulus is removed to show its core. (B) Tufted and mitral cells concentrate tufts of their primary dendrites in a single glomerulus (red ball); soma and secondary dendrites of tufted cells (green slab) as well as soma and lateral dendrites of mitral cells (blue slab) are uniformly distributed in the EPL. (C) Field potential profiles generated by different components of the entire module. PG-s and ET-s stand for contribution of PG and ET somata located in the glomerular shell; T-s/d and M-s/d designate impact of tufted and mitral somato-dendritic compartments located in the EPL and MCL; M-tuft, T-tuft, ET-tuft and PG-d are fields generated by intraglomerular dendritic arborizations of the corresponding cell types. Total field is the sum of all the above partial fields. Vertical dashed line indicates the core/shell border. (D) Separate contributions of all neuron types to the total field of the module; JG profile is the sum of PG and ET profiles. Two central dashed lines designate neuropil/shell borders with a ~10 μm wall of cell bodies between two adjacent glomeruli; dashed line on the right indicates the center of adjacent glomerulus. (E) xy Projection of the flattened glomerulus (colored oval); dashed circle behind the oval designates an original glomerular sphere. (F) Spatial profile of the glomerular field is practically independent of glomerular deformation. Vertical dashed lines designate neuropil/shell border in the non-distorted sphere (middle), along the short axis (left) and along the long axis (right); horizontal dashed line designates 30% of sGLFPmax and shows persistency of the field magnitude at the neuropil/shell border regardless of the glomerulus deformation. Distance on all plots is measured from the center of the glomerulus in the plane parallel to the MOB layers. Partial field magnitudes are normalized to the maximum of the total field.
Our experiments were performed in slices maintained in the interface chamber where all the original ensembles are inevitably flattened. Distortion of the module is likely to cause distortion of its field, for example increasing a component recorded at a distance. To estimate the effect of slice deformation, both subunits of our model were squeezed in a manner as it happens in the interface chamber. A spherical glomerulus was transformed into an ovoid with the same volume (Fig. 7E) and both slabs representing distributions of M/T secondary dendrites were squeezed in the same direction as the sphere (not shown), so that in the xz dimensions (plane of the flattened slice) size of all subunits increased whereas they decreased in the y dimension. Calculation of the field propagation after such flattening showed no change in the potential magnitude at the border between glomeruli (Fig. 7F). Despite shortening the distance from the glomerular center to the periphery, the squeezed field profile along y axis completely neutralized the size change. On the other hand, elongation of the glomerulus in the xz dimensions was accompanied by a field profile extension, which in turn resulted in maintaining the normal potential magnitude at the glomerular border. Beyond the shell, the total field of the whole module remained virtually independent of the glomerular shape.
Receptors involved in sGLFP shaping
It is commonly recognized that field potentials result from synchronization of neurons in local microcircuits. Neuronal synchronization can be mediated by excitatory and inhibitory synaptic transmission. Therefore, we tested how sGLFPs are affected by blockers of synaptic transmission in regular horizontal slices (n = 5). Bath application of 20 μM D-AP5 (NMDA-receptor blocker) did not change sGLFP frequency or amplitude, but shortened the duration of field events (Fig. 8). The application of 10 μM BIC (GABAA-receptor blocker) caused on average a twofold increase in the amplitude of sGLFPs and a more regular occurrence of sGLFPs (Table 3, Figs. 8, 9). Finally, 10 μM CNQX (AMPA-receptor blocker) completely and reversibly suppressed spontaneous field activity. This finding suggests that spontaneous local population activity is due to AMPA-receptor-mediated excitation within a glomerulus. Although feedforward as well as feedback inhibition can exert a synchronizing effect on the excitatory network, this did not seem to be true for sGLFP generation. GABAA-receptor blockade did not eliminate spontaneous population events. Instead, it led to their facilitation and it increased their regularity. Another function of inhibition is to prevent over-excitation in the network, i.e. to prevent epileptiform activity. In the latter case, disinhibition can cause total mobilization of cells into highly synchronized discharges. Application of 10 μM BIC led to a dramatic increase in sGLFP amplitude (from 0.22 ± 0.14 mV in control to 0.42 ± 0.3 mV in BIC) and an increase in average duration (width at half amplitude was 141 ± 91 ms and 169 ± 96 ms in control and BIC, respectively; ncon = 3757 and nbic = 4227, seven sites in five slices) (Table 3). The frequency of occurrence of sGLFPs was slightly increased (P < 0.05, n = 7) from 1.12 ± 0.12 Hz in control to 1.27 ± 0.08 Hz in BIC. This indicates that feedback inhibition in a glomerulus curtails spread of AMPA-R-mediated excitation, but does not determine its periodicity.
Fig. 8.
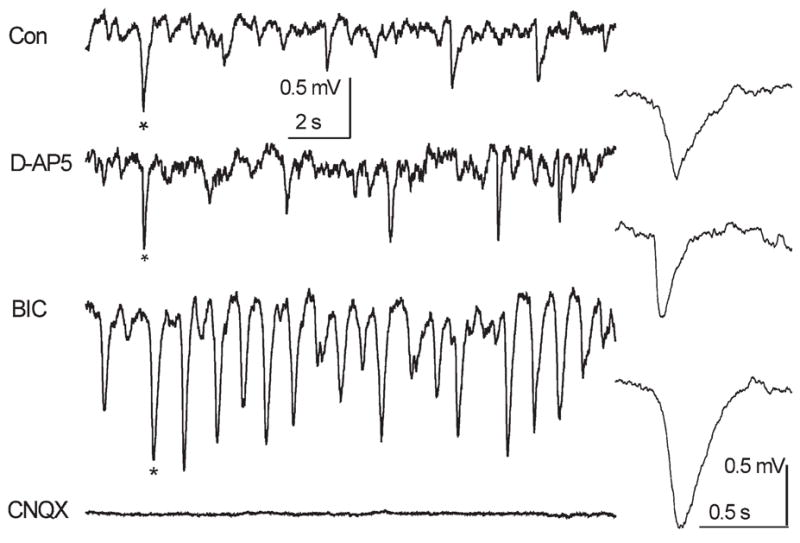
Spontaneous population activity in the GL is mediated by AMPA receptors and can be released from background inhibition by GABAA receptor blockade. In a control horizontal slice NMDA receptor blockade by D-AP5 did not change an average sGLFP pattern. GABAA-R blockade with BIC facilitated field potential oscillations. Finally, AMPA-R blockade completely turned off population activity. Events marked by asterisks are given in the insets with an enlarged time scale.
Table 3.
Effect of disinhibition on sGLFP
| sGLFP parameter | Mean ± SD | Min | Max |
|---|---|---|---|
| Amplitude HS-Con [mV] | 0.217 ± 0.142 | 0.028 | 0.907 |
| Amplitude HS-Bic | 0.424 ± 0.300 | 0.005 | 1.547 |
| Amplitude IGL-Con [mV] | 0.269 ± 0.222 | 0.043 | 1.325 |
| Amplitude IGL-Bic | 0.340 ± 0.242 | 0.055 | 1.851 |
| Rise time HS-Con [ms] | 96.27 ± 53.67 | 10 | 409 |
| Rise time HS-Bic | 117.04 ± 54.97 | 4 | 376 |
| Rise time IGL-Con [ms] | 86.22 ± 43.32 | 8.2 | 363.01 |
| Rise time IGL-Bic | 112.69 ± 48.06 | 11.4 | 427.33 |
| Decay time HS-Con [ms] | 280.84 ± 134.77 | 19.5 | 501 |
| Decay time HS-Bic | 293.34 ± 135.47 | 22 | 601 |
| Decay time IGL-Con [ms] | 275.69 ± 112.75 | 25.6 | 400.2 |
| Decay time IGL-Bic | 287.35 ± 116.94 | 24.2 | 400.5 |
| Area HS-Con [mV ms]a | 43.19 ± 34.54 | 5.01 | 197.34 |
| Area HS-Bic | 98.38 ± 88.04 | 5 | 555.51 |
| Area IGL-Con [mV ms]a | 49.45 ± 45.26 | 5 | 264.89 |
| Area IGL-Bic | 70.24 ± 51.45 | 5.12 | 369.96 |
| HalfWidth HS-Con [ms] | 141.15 ± 91.48 | 22.02 | 665.92 |
| HalfWidth HS-Bic | 169.96 ± 98.46 | 16.65 | 713 |
| HalfWidth IGL-Con [ms] | 141.85 ± 73.97 | 20.04 | 535.22 |
| HalfWidth IGL-Bic | 164.93 ± 83.80 | 18.67 | 559.36 |
Horizontal slices (HS) and IGL were tested separately in normal ACSF (Con) and after application of 10 μM bicuculline. Calculations have been made for the same recording sites. Seven sites in HS and four sites in IGL. In all pairs means were significantly different (P < 4610. 0.05); NHS-Con = 3757, NHS-Bic = 4327, NIGL-Con = 2706, NIGL-Bic = 4610.
Fig. 9.

sGLFPs in a dual recording show no synchrony either before (A) or after (B) BIC application. Insets show location of the recording sites (distance ~400 μm with three glomeruli in between) and the averaged cross-correlograms for control conditions (left, n = 29) and upon disinhibition (right, n = 30). A fragment of (B) marked by a horizontal bar is expanded in C. Note no change in cross-correlation despite a significant increase of sGLFP amplitude upon blockade of inhibition.
Even upon disinhibition, sGLFPs had variable amplitude, which implies involvement of different subsets of neurons in successive events. Simultaneously recorded pairs of sGLFP trains did not show either enhanced synchrony or similarity after GABAA-R blockade (Fig. 9). Hence, disinhibition in the GL does not lead to involvement of individual modules in global activity, but rather enhances excitatory ensemble features in each of them.
sGLFP-to-long-lasting depolarization (LLD) relation
sGLFPs may represent population events analogous to mitral cell spontaneous long-lasting depolarizations (sLLDs) (Carlson et al., 2000), which are also AMPA-R-dependent and involve prolonged recurrent excitation of dendrites in the glomerular neuropil. sGLFPs may be produced by excitation of either JG cells or M/T cells or both. Our results indicate that sGLFP generation occurs in the absence of M/T cell somata. However, in the intact system the M/T population may play a leading role and subsequently recruit the JG cells into a common event. To test this hypothesis, we investigated whether sGLFPs were correlated with sLLDs in mitral cells, which are thought to reflect massive synchronous depolarization in the glomerulus. Whole-cell recording from a mitral cell (blind mode, normal ACSF) was performed simultaneously with a field potential from a glomerulus containing the tuft of this mitral cell. Correspondence between intracellular and field recordings was established by the systematic presence of synchronized voltage deflections in both traces and the lack of synchronized sGLFPs in adjacent glomeruli (in each field recording three electrodes were placed in three neighboring glomeruli). In such dual recordings, every sLLD had a concomitant sGLFP (Fig. 10A). The amplitudes and shapes of these sGLFPs varied substantially, indicating that although a given mitral cell was involved in every event, the constellation of neurons recruited in each sGLFP is variable (Fig. 10B). Individual sGLFP frequently had shorter rise time, shorter duration, earlier onset, and typically reached the peak earlier than simultaneously recorded sLLDs. With the reference point set at the sLLD onset in three of five dual recordings, the onset of the averaged sGLFP preceded that of sLLD by ~10 ms (Fig. 10C); in two other dual recordings, the difference in sGLFP and sLLD initiation was not distinctive (not shown). Furthermore, sLLD-induced mitral cell spikes were delayed on average by 50 ms from the sGLFP onset; therefore, spike-dependent glutamate release from mitral cell tuft at best could contribute to sGLFP after it reached 90%–100% of its peak (Fig. 10C). Spike-triggered averaging of field potentials in two adjacent glomeruli by first spikes of a burst in the mitral cell associated with one of these glomeruli (F2) also showed that firing starts at ~90% of sGLFP peak and is delayed by 175 ms relative to a corresponding cross-correlated sGLFP onset (Fig. 10D). Weaker cross-correlation M-to-F1 was secondary and was likely due to F2-to-F1 interglomeru-lar interaction (see below), which occurred with ~50 ms time lag (Fig. 10D). This finding implies that M/T cells are not necessarily initiators of a population event, but on the contrary they may be either followers or equal participants of an event. Thus, the relationship between sLLDs and sGLFPs is in agreement with the notion of self-sufficiency of the JG ensemble in producing sGLFPs.
Fig. 10.
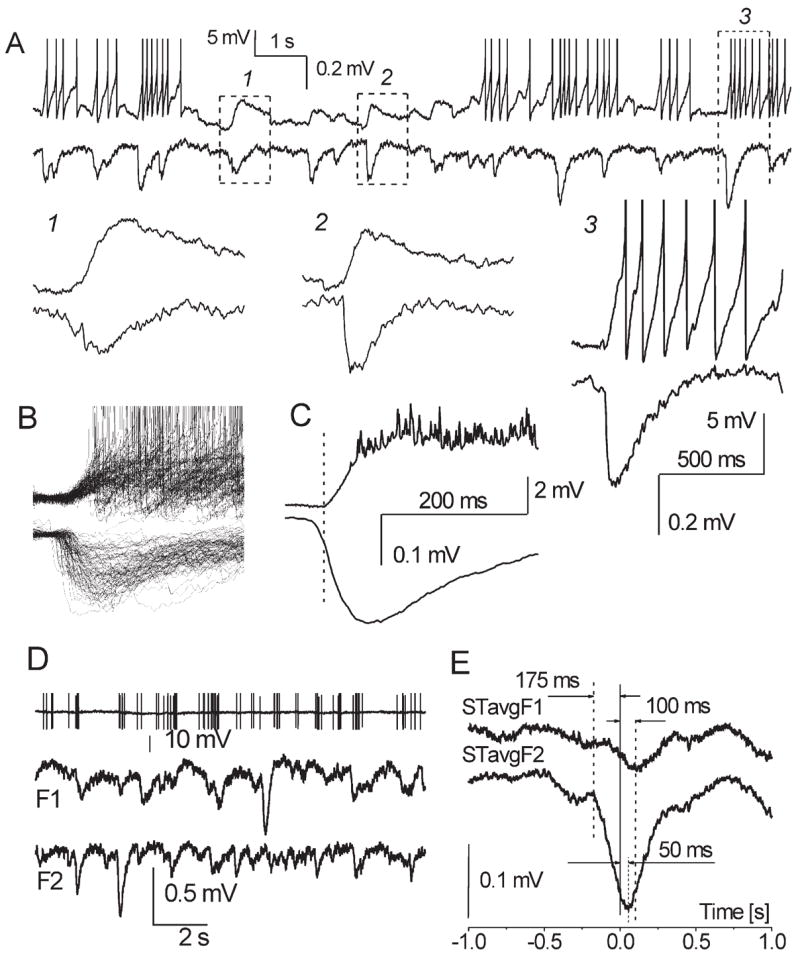
Simultaneous recordings of sLLDs in a mitral cell and sGLFPs from a glomerulus containing the mitral cell tuft. (A) Dual sweep of intracellular (upper trace) and field activity (lower trace). Spikes of mitral cell are truncated. Insets with an expanded time scale demonstrate variability of sGLFP locked to sLLD and different kinetics of sGLFP as compared with sLLD. (B) Overlapping sweeps with sLLD/sGLFP pairs (n = 80). All sLLD onsets are set at the same time point (t = 0). Note 10-fold difference between smallest and biggest sGLFP indicating different amount of cells involved in successive sGLFP in a given glomerulus. (C) Averaged sLLD and sGLFP (n = 80) with the reference point set at the sLLD onset show 9.8 ms delay of sLLD upon initiation of sGLFP. (D) Spontaneous firing of another mitral cell (high-passed at 1 kHz, spikes are truncated) and simultaneous field potential recordings from adjacent glomeruli (F1 and F2, distance 100 μm). (E) Spike-triggered averaged waveform (STavg, n = 50) obtained from this triple recording. Spikes of mitral cell that were preceded by 1 s silence period were put at t = 0 and concomitant waves at F1 and F2 sites were averaged. Note that in mitral cell first spike of a cluster occurs 175 ms after sGLFP initiation in F2 when STavgF2 reached 87% of its maximum; cross-correlation of mitral cell spike clusters with sGLFP in F1 is weaker, and STavgF1 is delayed for 100 ms relative to STavgF2.
Interglomerular communications
In accordance with conventional thinking that the glomeruli are functionally isolated units, one would expect total lack of correlation between sweeps recorded at distant sites. However, the recently discovered dense ramification of strikingly long axons of “SA” cells (extending for more than 1 mm away from the soma) suggests the possibility of cross-talk among remote glomeruli (Aungst et al., 2003). Indeed, cross-correlation analysis of spontaneous field potentials from remotely-separated sites in the GL of a control slice occasionally indicated functional links. In paired traces (n = 16, control slices) recorded from points separated by one or more glomeruli, some CCF over successive 4 s sweeps displayed positive peaks around zero lag time (Fig. 11A). In these cases, both traces frequently had prominent concomitant sGLFPs. Detailed analysis of individual pairs of such concomitant sGLFPs showed different onset times and kinetic properties of events that were apparently synchronous, thus ruling out passive field propagation. For six of 16 paired traces, avgCCF (over n = 50 sweeps) revealed statistically significant correlation with a peak located near zero lag time (Fig. 11B, Fig. 12K, L, N, O). This cross-correlation between two trains was eliminated by shuffling of the original recorded 4 s fragments in pairs. Therefore, significant peaks in CCFs imply randomly occurring functional links. In the other 10 pairs, deviations of CCFs did not exceed confidence levels (Fig. 12A–J). In a few CCFs (Fig. 12D, H, I, K, M), there was a small but sharp peak riding on a slow wave, which may indicate a portion of precisely synchronized PSPs resulting from spontaneous common inputs. Such a cluster of synchronous PSPs is also known as an “EEG quantum” (Groudis et al., 1972; Karnup, 1980, 1982), which emerges from the surrounding waveform when other field components are more loosely synchronized. In the pair of neurons (isolated GL stripe) depicted in Fig. 11C, the coefficient of cross-correlation upon BIC application increased from 0.068 to 0.115 (both values are significant, P < 0.05) with the peak shift (Δτ = −23 ms) unchanged. Since the magnitude of cross-correlation does not depend on the amplitude of oscillations, but only on the degree of their coincidence, this suggests that the elements providing interglomerular links (presumably SA cells) can be functionally active even in control conditions. Disinhibition results in either involvement of some additional elements or facilitation of their targets. We failed to obtain significant cross-correlation between sites separated by three or more glomeruli.
Fig. 11.
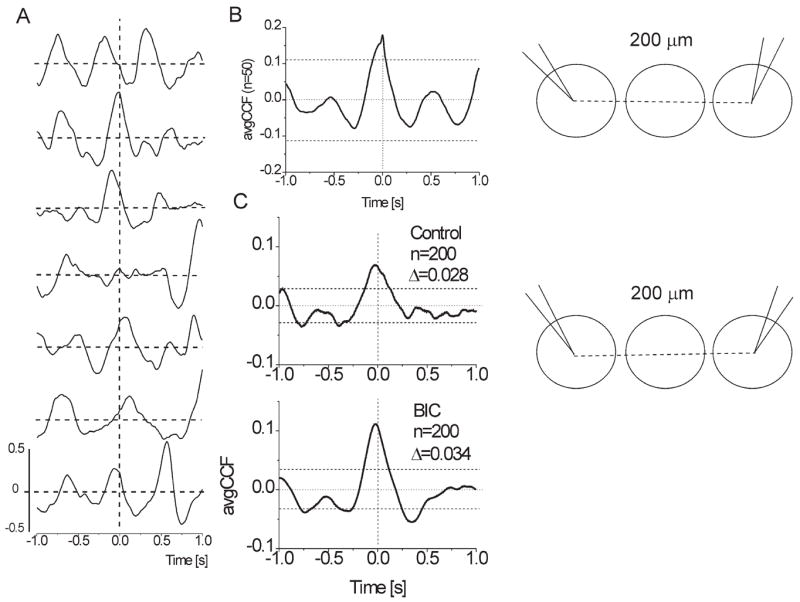
Cross-correlation of sGLFPs. (A) Examples of CCF calculated over 4 s sweeps in a row of total 50 sweeps show high variability of waveforms and transient character of cross-correlation; recording sites were separated by one glomerulus in a conventional horizontal slice. (B) Averaged CCF (n = 50 sweeps of 4 s) has a significant central peak shifted 20 ms to the left indicating functional interconnection between two glomeruli in control conditions. (C) Averaged CCFs (n = 200 sweeps of 4 s in each) for a dual recording in an isolated GL stripe from two adjacent glomeruli (interelectrode distance 100 μm) showed ~60% increase of cross-correlation upon application of 20 μM BIC. Note that both in control and in BIC the central peak of avgCCFs is shifted to the left for 25–30 ms indicating leadership of the second (i.e. not reference) glomerulus. Horizontal dashed lines designate 95% confidence levels. Insets on the right illustrate location of the recording sites.
Fig. 12.
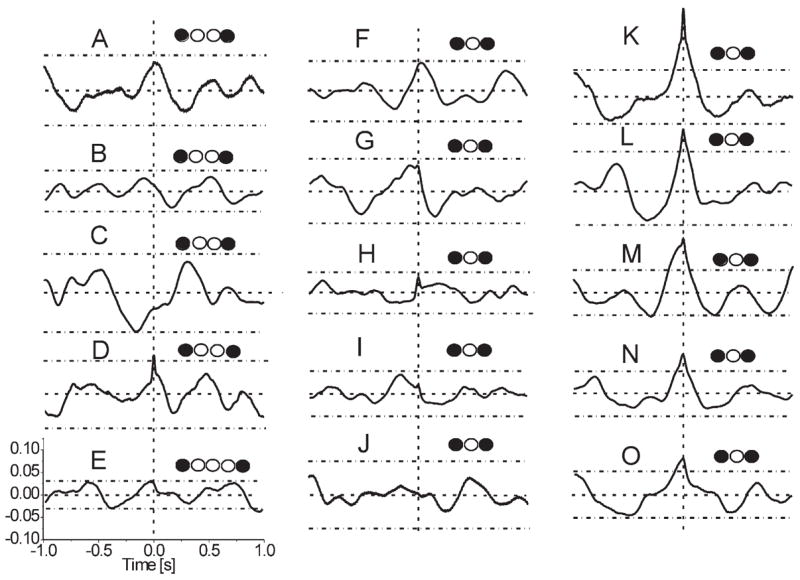
Cross-correlation of spontaneous field potentials recorded in pairs of remote glomeruli. Averaged CCFs in the left and middle columns indicate the absence of significant cross-correlation. In the right column avgCCFs show significant cross-correlation around zero time lag. Horizontal dashed lines in each plot designate confidence levels ( ± Δ, P < 0.01) above and below the zero level (CCF = 0). Vertical dashed lines indicate zero time lag (τ = 0). Hollow circles designate glomeruli separating recording sites (filled circles). Sharp peaks at τ = 0 overriding slow waves in some avgCCFs (D, H, I, K, M) may indicate a spontaneous synchronous common synaptic input (ex. from the ON).
DISCUSSION
In this study, we have described for the first time field potentials that are generated spontaneously in the GL in olfactory bulb slices. These sGLFPs had variable shape and amplitude, and occurred at irregular intervals. They were mediated mostly by AMPA/kainate receptors and were enhanced during blockade of GABAA receptors. They persisted after removal of the MCL indicating that they were predominantly generated by GL neurons. Nevertheless, they were correlated with mitral cell postsynaptic LLDs, suggesting the existence of a common generator. We developed a mathematical model consistent with our hypothesis that sGLFPs are generated mainly by JG cells.
In the past decade, significant achievements have been made in understanding odor coding in the olfactory system. This is mostly due to the discovery of the spatial aspect of odor presentation, where different odors activated different combinations of glomeruli in the MOB (Johnson and Leon, 2000a,b; Linster et al., 2001; Luo and Katz, 2001; Mori, 2003; Wachowiak and Cohen, 2001). In contrast, the temporal aspect of odor coding is still poorly understood. Field potential oscillations occur in the MOB in vivo during odor presentation (Chapman et al., 1998; Fletcher et al., 2005; Kay, 2003, 2005; Kashiwadani et al., 1999; Ketchum and Haberly, 1993; Lam et al., 2000; Laurent et al., 1996; Neville and Haberly, 2003; Ravel et al., 2003). The dynamics of a neuronal network response to an odor is mainly associated with the delta or theta rhythms and can be either the result of ongoing computation or it can represent a sequence of activity patterns (Friedrich, 2002; Laurent, 1999, 2002; Spors and Grinvald, 2002). For instance, rhythmic excitation of mitral cells was found to be coupled to the breathing cycle (theta range) during odor presentation in rodents (Macrides and Chorover, 1972; Margrie and Schaefer, 2003; Cang and Isaacson, 2003). Mechanisms, that underlie temporal dynamics of population activity in the MOB, have been also studied in vitro. Dendro-dendritic interactions between mitral and granule cells in the EPL were proposed to produce slow waves of excitation in the MOB (Isaacson and Strowbridge, 1998; Schoppa et al., 1998). Recently, β-γ transient fast network oscillations were found to depend on both chemical and electrical synaptic transmission in mitral/granule cells (Friedman and Strowbridge, 2003; Lagier et al., 2004).
A surprising lack of published observations on spontaneous field potentials in the GL in vitro is due to several reasons. First, most previous studies were performed in submerged slices, where eFP were relatively small compared with those recorded in the interface mode, and spontaneous events apparently were not detectable. Second, experiments in slices in the interface mode were mostly focused on evoked activity, and all inter-stimulus events were neglected. It is important to note, that Leveteau and MacLeod (1966) were the first who described odor-evoked field potentials in the GL in vivo and they suggested that these potentials originate in individual glomeruli. This observation allowed them to introduce the notion of a “glomerular unit.”
Field potentials recorded in the GL were thought to be produced by the activity of many glomeruli with large dipole-like M/T cells as main contributors. This point of view was developed for layered structures based on data from evoked responses. However, we provide here evidence that in a spherical glomerular module spontaneously synchronized neurons can generate pronounced but sharply confined local field potentials. The first indication for a lack of significant contribution from adjacent glomeruli to sGLFPs is that in disinhibited slices sGLFPs were regular, although of variable amplitude. If waves from adjacent glomeruli were detectable, a complex pattern of events would have been observed unless all glomeruli were synchronized. However, disinhibition increased the amplitude and the regularity of sGLFPs, but did not increase the complexity of a sGLFP train. Moreover, sGLFPs in adjacent glomeruli (distance ~100 μm) often were not correlated.
To investigate the mechanism of sGLFP generation with computer simulation, we introduced two superimposed partial modules: one sub-module constructed from only mitral cells, medium-tufted and deep-tufted cells (Fig. 1A, glomerulus in the center), and another sub-module composed exclusively from JG cells (Fig. 1A, glomerulus on the left). In the first case, M/T somata as well as lateral dendrites of mitral cells and secondary dendrites of tufted cells are distributed in a broad area where dendrites extend up to 1–2 mm in the EPL (Macrides and Schneider, 1982; Shipley et al., 1996). Excitatory neurons (i.e. M/T cells) do not establish conventional synaptic contacts with each other, but they can interact in the MOB via glutamate spillover both in the glomerular core and in the EPL (Price and Powell, 1970; Pinching and Powell, 1971b; Isaacson, 1999; Friedman and Strowbridge, 2000). Gap-junctions among intraglomerular M/T cell dendrites can also serve as a synchronizing mechanism for elements of the module (Kosaka and Kosaka, 2004; Lowe, 2003; Migliore et al., 2005). Furthermore, within a glomerulus ET cells are synchronized by multiple mechanisms including glutamate release from ON, glutamate spillover among dendrites, feedback inhibition and gap junctions (Hayar et al., 2005). Thus, in this sub-module with spillover- and gap-junction-mediated intraglomerular recurrent excitation, one pole is located within a sphere of ~100 μm in diameter (recordable sink), whereas another pole (scattered source) is not well-de-fined and apparently cannot show a phase reversal. The fact that upon ON stimulation one can observe a depth profile of evoked potentials in the MOB as well as reversal of the glomerular sink to the corresponding source in the EPL and MCL (Aroniadou-Anderjaska et al., 1997, 1999), can be explained by concomitant excitation of a number of modules resulting in activation of aligned sinks in the GL and occurrence of a parallel layer of sources in the MCL/low EPL.
In the other sub-module, all synchronously depolarized dendrites are located in the core of the glomerular neuropil and all the cell bodies surround the glomerulus. At first glance, JG cells cannot generate recordable field potentials as they are very short and lack parallel orientation. However, based on the notion of the closed field that is created by simultaneous depolarization of radially-oriented dendrites in a nuclear structure (Lorente de Nó, 1947), JG cells are perfectly suited to produce a closed field. Our second sub-module is an ideal nucleus-like structure; hence, we should expect a recordable field potential in its core. Even at a small distance from this sub-module, negative (core) and positive (shell) charges would be neutralized and a field potential would be undetectable. In a real system, both types of sub-modules are superimposed; therefore, the combined field potential has features of both. If the above assumptions are correct, then (a) sGLFPs should be present in an isolated GL and (b) a fraction of sGLFPs can spread beyond glomerular outline in control slices. The first implication of this proposed mechanism was supported by our experimental results. To test the second implication and estimate the impact of different cell types on the total field potential generated in a single glomerulus, we used a computer modeling approach. The suggested static model is the first approximation to uncover the components of sGLFPs. Therefore, it gives only a rough estimate of sGLFP structure and it does not simulate the dynamic development of field potentials. However, it gives a snapshot of contributing components at the peak of intraglomerular excitation, thus providing valuable information about glomerular electrogenesis.
The electrostatic model for distribution of field potentials, generated by many neuronal elements united via a common glomerulus, confirms the above hypothesis and uncovers the field profile of sGLFP. First, the model shows that JG cells alone are capable of generating a substantial population event. Second, due to neutralization of opposite charges outside of the glomerulus, the total JG impact is expressed predominantly within the glomerular core. Third, mitral cells contribute only a small fraction to the spontaneous field events (~10%). Fourth, since the extraglomerular potential can be up to 20% of the neuropil potential, it is possible that sGLFPs of small amplitude may be produced by an adjacent glomerulus.
Until recently, there was no evidence that olfactory glomeruli communicate at long distances. However, we recently found that short axon cells, unlike what their name implies, had in fact long axons (> 1 mm) innervating the GL (Aungst et al., 2003). These cells appeared to be glutamatergic because in a tangential slice, electrical stimulation of these neurons evoked excitatory responses that propagate up to 10 glomerular distances. However, SA cells might not be spontaneously active in slices and this could explain the lack of cross-correlated sGLFPs at distances longer than 200–300 μm. Similarly, there was occasional cross-correlation between spontaneous membrane potential oscillations in mitral cells with tufts in adjacent glomeruli and complete lack of synchrony at greater interglomerular distances (Schoppa and Westbrook, 2001).
The novel sGLFPs are analogous to events observed in mitral cells during whole-cell recordings. Upon GABAA receptor blockade or NMDA bath application, mitral cells are capable of producing sLLD (up to 1 s in duration) of the membrane potential (Carlson et al., 2000; Schoppa and Westbrook, 2001). LLD corresponds to recurrent dendrodendritic excitatory interactions among neurons affiliated with the same glomerulus. It is possible that synchronous LLDs in a group of cells with tightly interweaving dendrites might give rise to a population event recordable as a field potential. In the absence of inhibition, the majority of M/T and JG neurons contribute to a field event giving rise to a sGLFP of maximum amplitude. However, sLLDs in the same cell have variable amplitude (Fig. 10 in Carlson et al., 2000; Fig. 2 in Schoppa and Westbrook, 2001), which implies that the number of neurons contributing to sLLD is variable. This is in agreement with our finding that even in disinhibited slices sGLFPs had variable amplitude. Our finding that evoked saturated field potential is typically greater than sGLFP even after BIC application, also supports the notion that not all neurons of the ensemble participate in sGLFPs, maintaining background level of synchrony within the module. The observation that sGLFP precedes sLLD in mitral cells suggests that mitral cells are followers rather than initiators of population events. The most likely scenario is that mitral cells are activated when a critical number of glutamate-releasing neurons are already active. Such a triggering mechanism may be produced by synchronized spontaneously bursting ET cells of the same glomerulus (Hayar et al., 2004a,b).
The number of dendrites of JG cells significantly exceeds those of M/T cells in a glomerulus. Indeed, it was estimated that in a slice ~10 mitral cells, 50 tufted and 280 (= 230 PG + 50 ET) JG cells have their dendrites in each glomerulus. Thus, one can assess the M/T-to-JG ratio as 1/4.6 and a ratio of their tufts as ~1/2.75, which implies a greater impact of JG cells (73%) as compared with M/T cells (~27%) to sGLFP solely on the basis of morphology. Our model has assessed the JG and M/T contribution as ~1:1 (34.4% PG + 15.7% ET = ~50% JG and 38.8% tufted + 10.4% mitral = + 50% M/T = ~50% of the maximum field value correspondingly). The lower actual impact of JG cells is due to partial neutralization of their negative charges in the neuropil by surrounding positive charges (Fig. 7C). Nevertheless, the impact of JG cells to the total intraglomerular field is substantial. Finally, in control slices the frequency of sGLFP did not differ significantly from that in the isolated GL, indicating that the GL contains all the basic elements necessary to produce spontaneous population events. This hypothesis is also supported by the ability of ET and PG cells to generate calcium spikes, which provides more prolonged and powerful charge-transfer than a burst of fast sodium spikes (Hayar et al., 2004a; Murphy et al., 2005; McQuiston and Katz, 2001). Therefore, based on our experimental and theoretical results, we can conclude that M/T cells are not required for the glomerular field potential to be initiated. In contrast, JG cells seem to constitute the decisive elements of the functional module.
Resolving the mechanism of intraglomerular electrogenesis and interglomerular communication will enhance our understanding of the functional organization of the neuronal ensembles of the OB and may provide a useful tool to study odor information processing in the olfactory bulb. sGLFPs may play a significant role in temporal coding as a substrate for synchronization among modules upon odor presentation. In addition, they can provide some background level of excitation for the neuronal population of the olfactory bulb. Based on the above and previous results (Aungst et al., 2003; Hayar et al., 2004a,b), we hypothesize that the GL represents a subsystem of interconnected modules that can serve as a band-pass odor intensity discriminator. In this case, sGLFPs continuously create spatially-distributed “white noise” in the glomerular map preventing detection of weak odors. Moreover, high odor intensity can strongly excite a corresponding glomerulus and then result in widespread lateral interglomerular inhibition mediated by SA cells (Aungst et al., 2003), which eliminates perception of all other odors but the prevailing one. At intermediate odor intensities, different patterns of activated glomeruli can emerge from noisy sGLFP background without being suppressed by lateral inhibition. This allows discrimination of fine aromas or odor blends. The fact that activation of output neurons is delayed (~50–170 ms) relative to intraglomerular activation and that interglomerular communication occurs in a shorter time window (tens of ms), indicates that output neurons are recruited for information processing after an initial processing within the GL. This supports the hypothesis that the GL is critical for initial odor analysis.
Acknowledgments
We thank Dr. Bradley Alger and Dr. Didier Depireux for critical reading of the manuscript and helpful comments. This study was supported by the SMU (M.K.), DC006356, DC007123 (A.H.) and DC36940, DC02173 (M.T.S.).
Abbreviations
- ACSF
artificial cerebrospinal fluid
- avgCCF
averaged cross-correlation function
- BIC
bicuculline
- CCF
cross-correlation function
- CNQX
6-cyano-7-nitroquinoxaline-2,3-dione
- D-AP5
D-(−) 2-amino-5-phosphopentanoic acid
- DIC
differential interference contrast
- EEG
electroencephalogram/electroencephalographic
- eFP
evoked field potential
- EPL
external plexiform layer
- ET
external tufted
- GCL
granule cell layer
- GL
glomerular layer
- IGL
isolated glomerular layer
- JG
juxtaglomerular
- LLD
long-lasting depolarization
- MCL
mitral cell layer
- MOB
main olfactory bulb
- M/T
mitral/tufted
- ON
olfactory nerve
- ONL
olfactory nerve layer
- PG
periglomerular
- SA
short-axon
- sACSF
sucrose-containing artificial cerebrospinal fluid
- sGLFP
spontaneous glomerular layer field potential
- sLLD
spontaneous long-lasting depolarization
References
- Allison AC. The structure of the olfactory bulb and its relationship to the olfactory pathways in the rabbit and the rat. J Comp Neurol. 1953;98:309–353. doi: 10.1002/cne.900980206. [DOI] [PubMed] [Google Scholar]
- Aroniadou V, Keller A. The pattern and synaptic properties of horizontal intracortical connections in the rat motor cortex. J Neurophysiol. 1993;70:1493–1553. doi: 10.1152/jn.1993.70.4.1553. [DOI] [PubMed] [Google Scholar]
- Aroniadou-Anderjaska V, Ennis M, Shipley MT. Glomerular synaptic responses to olfactory nerve input in rat olfactory bulb slices. Neuroscience. 1997;79(2):425–434. doi: 10.1016/s0306-4522(96)00706-3. [DOI] [PubMed] [Google Scholar]
- Aroniadou-Anderjaska V, Ennis M, Shipley MT. Current-source density analysis in the rat olfactory bulb: laminar distribution of kainite/AMPA- and NMDA-receptor-mediated currents. J Neurophysiol. 1999;81:15–28. doi: 10.1152/jn.1999.81.1.15. [DOI] [PubMed] [Google Scholar]
- Aungst JL, Heyward PM, Puche AC, Karnup SV, Hayar A, Szabo G, Shipley MT. Center-surround inhibition among olfactory bulb glomeruli. Nature. 2003;426(6967):623–629. doi: 10.1038/nature02185. [DOI] [PubMed] [Google Scholar]
- Buresh Y, Petan M, Zakhar I. Electrophysiological methods of studies [in Russian] Moscow: Inostrannaya Literatura; 1962. [Google Scholar]
- Cang J, Isaacson JS. In vivo whole cell recording of odorevoked synaptic transmission in the rat olfactory bulb. J Neurosci. 2003;23(10):4108–4116. doi: 10.1523/JNEUROSCI.23-10-04108.2003. [DOI] [PMC free article] [PubMed] [Google Scholar]
- Carlson GC, Shipley MT, Keller A. Long-lasting depolarizations in mitral cells of the rat olfactory bulb. J Neurosci. 2000;20(5):2011–2021. doi: 10.1523/JNEUROSCI.20-05-02011.2000. [DOI] [PMC free article] [PubMed] [Google Scholar]
- Chapman CA, Xu Y, Haykin S, Racine RJ. Beta-frequency (15–35 Hz) electroencephalogram activities elicited by toluene and electrical stimulation in the behaving rat. Neuroscience. 1998;86(4):1307–1319. doi: 10.1016/s0306-4522(98)00092-x. [DOI] [PubMed] [Google Scholar]
- Coskun V, Luskin MB. Intrinsic and extrinsic regulation of the proliferation and differentiation of cells in the rodent rostral migratory stream. J Neurosci Res. 2002;69(6):795–802. doi: 10.1002/jnr.10336. [DOI] [PMC free article] [PubMed] [Google Scholar]
- Fletcher ML, Smith AM, Best AR, Wilson DA. High-frequency oscillations are not necessary for simple olfactory discrimination in young rats. J Neurosci. 2005;25(4):792–798. doi: 10.1523/JNEUROSCI.4673-04.2005. [DOI] [PMC free article] [PubMed] [Google Scholar]
- Frazier LL, Brunjes PC. Unilateral odor deprivation: early postnatal changes in olfactory bulb cell density and number. J Comp Neurol. 1988;269:355–370. doi: 10.1002/cne.902690304. [DOI] [PubMed] [Google Scholar]
- Friedman D, Strowbridge B. Functional role of NMDA autoreceptors in olfactory mitral cells. J Neurophysiol. 2000;84:39–50. doi: 10.1152/jn.2000.84.1.39. [DOI] [PubMed] [Google Scholar]
- Friedman D, Strowbridge B. Both electrical and chemical synapses mediate fast network oscillations in the olfactory bulb. J Neurophysiol. 2003;89:2601–2610. doi: 10.1152/jn.00887.2002. [DOI] [PubMed] [Google Scholar]
- Friedrich RW. Real time odor representation. Trends Neurosci. 2002;25(10):487–489. doi: 10.1016/s0166-2236(02)02256-7. [DOI] [PubMed] [Google Scholar]
- Fukushima N, Yokouchi K, Kawagishi K, Moriizumi T. Differential neurogenesis and gliogenesis by local and migrating neural stem cells in the olfactory bulb. Neurosci Res. 2002;44(4):467–473. doi: 10.1016/s0168-0102(02)00173-6. [DOI] [PubMed] [Google Scholar]
- Groudis YU, Gutman A, Kuras A, Mildazhis V, Milyukas V, Mitskene V, Mutskus K. EEG quantum (definition, measurement, registration) [in Russian] Dokl Akad Nauk SSSR. 1972;204(5):1246–1249. [PubMed] [Google Scholar]
- Guselnikov VI. Electrophysiology of the brain [in Russian] Moscow: Vysshaya Shkola; 1976. [Google Scholar]
- Hamilton KA, Heinbockel T, Ennis M, Szabo G, Erdelyi F, Hayar A. Properties of external plexiform layer interneurons in mouse olfactory bulb slices. Neuroscience. 2005;133:819–829. doi: 10.1016/j.neuroscience.2005.03.008. [DOI] [PMC free article] [PubMed] [Google Scholar]
- Hayar A, Karnup S, Shipley MT, Ennis M. Olfactory bulb glomeruli: external tufted cells intrinsically burst at theta frequency and are entrained by patterned olfactory input. J Neurosci. 2004a;24(5):1190–1199. doi: 10.1523/JNEUROSCI.4714-03.2004. [DOI] [PMC free article] [PubMed] [Google Scholar]
- Hayar A, Karnup S, Ennis M, Shipley M. External tufted cells: a major excitatory element that coordinates glomerular activity. J Neurosci. 2004b;24(30):6676–6685. doi: 10.1523/JNEUROSCI.1367-04.2004. [DOI] [PMC free article] [PubMed] [Google Scholar]
- Hayar A, Shipley MT, Ennis M. Olfactory bulb external tufted cells are synchronized by multiple intraglomerular mechanisms. J Neurosci. 2005;25(36):8197–8208. doi: 10.1523/JNEUROSCI.2374-05.2005. [DOI] [PMC free article] [PubMed] [Google Scholar]
- Hubbard JI, Llinas R, Quastel DMJ. Electrophysiological analysis of synaptic transmission. London: Edward Arnold Ltd; 1969. pp. 265–294. [Google Scholar]
- Isaacson JS. Glutamate spillover mediates transmission in the rat olfactory bulb. Neuron. 1999;23(2):377–384. doi: 10.1016/s0896-6273(00)80787-4. [DOI] [PubMed] [Google Scholar]
- Isaacson JS, Strowbridge B. Olfactory reciprocal synapses: dendritic signaling in the CNS. Neuron. 1998;20:749–761. doi: 10.1016/s0896-6273(00)81013-2. [DOI] [PubMed] [Google Scholar]
- Johnson BA, Leon M. Modular representation of odorants in the glomerular layer of the rat olfactory bulb and the effects of stimulus concentration. J Comp Neurol. 2000a;422:496–509. doi: 10.1002/1096-9861(20000710)422:4<496::aid-cne2>3.0.co;2-4. [DOI] [PubMed] [Google Scholar]
- Johnston BA, Leon M. Odorant molecular length: one aspect of the olfactory code. J Comp Neurol. 2000b;426:330–338. doi: 10.1002/1096-9861(20001016)426:2<330::aid-cne12>3.0.co;2-5. [DOI] [PubMed] [Google Scholar]
- Kandel A, Buzsaki G. Cellular-synaptic generation of sleep spindles, spike-and-wave discharges, and evoked thalamocortical responses in the neocortex of the rat. J Neurosci. 1997;17(17):6783–6797. doi: 10.1523/JNEUROSCI.17-17-06783.1997. [DOI] [PMC free article] [PubMed] [Google Scholar]
- Karnup SV. Comparative analysis of statistical relations between spontaneous cortical unit activity and the EEG in different states of the brain function [in Russian] Zhurn Vyssh Nervn Deyat. 1980;30:105–112. doi: 10.1007/BF01186269. [DOI] [PubMed] [Google Scholar]
- Karnup SV. Comparative analysis of statistical relations between spontaneous cortical unit activity and the EEG in different states of the brain function [translation into English] Neurosci Behav Physiol. 1982;12:213–219. doi: 10.1007/BF01186269. [DOI] [PubMed] [Google Scholar]
- Kashiwadani H, Sasaki YF, Uchida N, Mori K. Synchronized oscillatory discharges of mitral/tufted cells with different molecular receptive ranges in the rabbit olfactory bulb. J Neurophysiol. 1999;82:1786–1792. doi: 10.1152/jn.1999.82.4.1786. [DOI] [PubMed] [Google Scholar]
- Kay LM. Two species of gamma oscillations in the olfactory bulb: dependence on behavioral state and synaptic interaction. J Integr Neurosci. 2003;2(1):31–41. doi: 10.1142/s0219635203000196. [DOI] [PubMed] [Google Scholar]
- Kay LM. Theta oscillations and sensorimotor performance. Proc Natl Acad Sci U S A. 2005;102(10):3863–3868. doi: 10.1073/pnas.0407920102. [DOI] [PMC free article] [PubMed] [Google Scholar]
- Ketchum KL, Haberly LB. Synaptic events that generate fast oscillations in piriform cortex. J Neurosci. 1993;13(9):3980–3985. doi: 10.1523/JNEUROSCI.13-09-03980.1993. [DOI] [PMC free article] [PubMed] [Google Scholar]
- Kosaka T, Kosaka K. Neuronal gap-junctions between intraglomerular mitral/tufted cell dendrites in the mouse main olfactory bulb. Neurosci Res. 2004;49(4):373–378. doi: 10.1016/j.neures.2004.04.003. [DOI] [PubMed] [Google Scholar]
- Lagier S, Carleton A, Lledo PM. Interplay between local GABAergic interneurons and relay neurons generates gamma oscillations in the rat olfactory bulb. J Neurosci. 2004;24(18):4382–4392. doi: 10.1523/JNEUROSCI.5570-03.2004. [DOI] [PMC free article] [PubMed] [Google Scholar]
- Lam YW, Cohen LB, Wachoviak M, Zochowski MR. Odor elicits three different oscillations in the turtle olfactory bulb. J Neurosci. 2000;20(2):749–762. doi: 10.1523/JNEUROSCI.20-02-00749.2000. [DOI] [PMC free article] [PubMed] [Google Scholar]
- Lambert NA, Borroni AM, Grover LM, Teyler TJ. Hyperpolarizing and depolarizing GABA-A receptor-mediated dendritic inhibition in area CA1 of the rat hippocampus. J Neurophysiol. 1991;66:1538–1548. doi: 10.1152/jn.1991.66.5.1538. [DOI] [PubMed] [Google Scholar]
- Laurent G. A systems perspective on early olfactory coding. Science. 1999;286:723–728. doi: 10.1126/science.286.5440.723. [DOI] [PubMed] [Google Scholar]
- Laurent G. Olfactory network dynamics and the coding of multidimentional signals. Nat Rev Neurosci. 2002;3:884–895. doi: 10.1038/nrn964. [DOI] [PubMed] [Google Scholar]
- Laurent G, Wehr M, Davidowitz H. Temporal representation of odors in the olfactory network. J Neurosci. 1996;16(12):3837–3847. doi: 10.1523/JNEUROSCI.16-12-03837.1996. [DOI] [PMC free article] [PubMed] [Google Scholar]
- Leveteau J, MacLeod P. Olfactory discrimination in the rabbit olfactory glomerulus. Science. 1966;153(732):175–176. doi: 10.1126/science.153.3732.175. [DOI] [PubMed] [Google Scholar]
- Linster C, Johnson BA, Yue E, Morse A, Xu Z, Hingco EE, Choi Y, Choi M, Messiha A, Leon M. Perceptual correlates of neural representations evoked by odorant enantiomers. J Neurosci. 2001;21(24):9837–9843. doi: 10.1523/JNEUROSCI.21-24-09837.2001. [DOI] [PMC free article] [PubMed] [Google Scholar]
- Lorente de Nó R. Action potential of the motoneurones of the hypoglossus nucleus. J Cell Comp Physiol. 1947;29:207–288. doi: 10.1002/jcp.1030290303. [DOI] [PubMed] [Google Scholar]
- Lowe G. Electrical signaling in the olfactory bulb. Curr Opin Neurobiol. 2003;13:476–481. doi: 10.1016/s0959-4388(03)00092-8. [DOI] [PubMed] [Google Scholar]
- Luo M, Katz LC. Response correlation maps of neurons in the mammalian olfactory bulb. Neuron. 2001;32:1165–1179. doi: 10.1016/s0896-6273(01)00537-2. [DOI] [PubMed] [Google Scholar]
- Macrides F, Schneider SP. Laminar organization of mitral and tufted cells in the main olfactory bulb of the adult hamster. J Comp Neurol. 1982;208:419–430. doi: 10.1002/cne.902080410. [DOI] [PubMed] [Google Scholar]
- Macrides F, Chorover SL. Olfactory bulb units: activity correlated with inhalation cycles and odor quality. Science. 1972;175(17):84–87. doi: 10.1126/science.175.4017.84. [DOI] [PubMed] [Google Scholar]
- Margrie TW, Schaefer AT. Theta oscillation coupled spike latencies yield computational vigour in a mammalian sensory system. J Physiol. 2003;546:363–374. doi: 10.1113/jphysiol.2002.031245. [DOI] [PMC free article] [PubMed] [Google Scholar]
- McQuiston AR, Katz LC. Electrophysiology of interneurons in the glomerular layer of the rat olfactory bulb. J Neurophysiol. 2001;86:1899–1907. doi: 10.1152/jn.2001.86.4.1899. [DOI] [PubMed] [Google Scholar]
- Meisami E, Safari L. A quantitative study of the effects of early unilateral olfactory deprivation on the number and distribution of mitral and tufted cells and of glomeruli in the rat olfactory bulb. Brain Res. 1981;221:81–107. doi: 10.1016/0006-8993(81)91065-9. [DOI] [PubMed] [Google Scholar]
- Migliore M, Hines ML, Shepherd GM. The role of distal dendritic gap-junctions in synchronization of mitral cell axonal output. J Comput Neurosci. 2005;18(2):151–161. doi: 10.1007/s10827-005-6556-1. [DOI] [PubMed] [Google Scholar]
- Mitzdorf U. Current source-density method and application in cat cerebral cortex: investigation of evoked potentials and EEG phenomena. Physiol Rev. 1985;65:37–100. doi: 10.1152/physrev.1985.65.1.37. [DOI] [PubMed] [Google Scholar]
- Mori K. Membrane and synaptic properties of identified neurons in the olfactory bulb. Prog Neurobiol. 1987;29:275–320. doi: 10.1016/0301-0082(87)90024-4. [DOI] [PubMed] [Google Scholar]
- Mori K. Grouping of odorant receptors: odour maps in the mammalian olfactory bulb. Biochem Soc Trans. 2003;31:134–136. doi: 10.1042/bst0310134. [DOI] [PubMed] [Google Scholar]
- Murphy GJ, Darcy DP, Isaacson JS. Intraglomerular inhibition: signaling mechanisms of an olfactory microcircuit. Nat Neurosci. 2005;8(3):354–364. doi: 10.1038/nn1403. [DOI] [PubMed] [Google Scholar]
- Neville KR, Haberly LB. Beta and gamma oscillations in the olfactory system of the uretane-anesthetized rat. J Neurophysiol. 2003;90(6):3921–3930. doi: 10.1152/jn.00475.2003. [DOI] [PubMed] [Google Scholar]
- Pinching AJ, Powell TP. The neuron types of the glomerular layer of the olfactory bulb. J Cell Sci. 1971a;9:305–345. doi: 10.1242/jcs.9.2.305. [DOI] [PubMed] [Google Scholar]
- Pinching AJ, Powell TP. The neuropil of the glomeruli in the olfactory bulb. J Cell Sci. 1971b;9:347–377. doi: 10.1242/jcs.9.2.347. [DOI] [PubMed] [Google Scholar]
- Price JL, Powell TPS. The synaptology of the granule cells in the olfactory bulb. J Cell Sci. 1970;7:125–155. doi: 10.1242/jcs.7.1.125. [DOI] [PubMed] [Google Scholar]
- Rall W, Shepherd GM. Theoretical reconstruction of field potentials and dendrodendritic synaptic interactions in olfactory bulb. Exp Neurol. 1968;14:44–56. doi: 10.1152/jn.1968.31.6.884. [DOI] [PubMed] [Google Scholar]
- Ravel N, Chabaud P, Martin C, Gaveau V, Hugues E, Tallon-Baudry C, Bertrand O, Gervais R. Olfactory learning modifies the expression of odor-induced oscillatory responses in the gamma (60–90 Hz) and beta (15–40 Hz) bands in the rat olfactory bulb. Eur J Neurosci. 2003;17(2):350–358. doi: 10.1046/j.1460-9568.2003.02445.x. [DOI] [PubMed] [Google Scholar]
- Royet JP, Souchier C, Jourdan F, Ploye H. Morphometric study of the glomerular population in the mouse olfactory bulb: numerical density and size distribution along the rostrocaudal axis. J Comp Neurol. 1988;270:559–568. doi: 10.1002/cne.902700409. [DOI] [PubMed] [Google Scholar]
- Royet JP, Distel H, Hudson R, Gervais R. A reestimation of the number of glomeruli and mitral cells in the olfactory bulb of rabbit. Brain Res. 1998;788:35–42. doi: 10.1016/s0006-8993(97)01504-7. [DOI] [PubMed] [Google Scholar]
- Sassoe-Pognetto M, Ottesen OP. Organization of ionotropic glutamate receptors at dendrodendritic synapses in the rat olfactory bulb. J Neurosci. 2000;20:2192–2201. doi: 10.1523/JNEUROSCI.20-06-02192.2000. [DOI] [PMC free article] [PubMed] [Google Scholar]
- Schoppa NE, Westbrook GL. Glomerulus-specific synchronization of mitral cells in the olfactory bulb. Neuron. 2001;31:639–651. doi: 10.1016/s0896-6273(01)00389-0. [DOI] [PubMed] [Google Scholar]
- Schoppa NE, Kinzie JM, Sahara Y, Segerson TP, Westbrook GL. Dendrodendritic inhibition in the olfactory bulb is driven by NMDA receptors. J Neurosci. 1998;18:6790–6802. doi: 10.1523/JNEUROSCI.18-17-06790.1998. [DOI] [PMC free article] [PubMed] [Google Scholar]
- Schoppa NE, Urban NN. Dendritic processing within olfactory bulb circuits. Trends Neurosci. 2003;26:501–506. doi: 10.1016/S0166-2236(03)00228-5. [DOI] [PubMed] [Google Scholar]
- Shipley MT, Mclean JH, Zimmer LA, Ennis M. The olfactory system. In: Swanson LW, Bjorklund A, Hokfelt T, editors. Handbook of chemical neuroanatomy, 12: Integrated systems of the CNS, part III. Amsterdam: Elsevier; 1996. pp. 467–571. [Google Scholar]
- Spors H, Grinvald A. Spatio-temporal dynamics of odor representation in the mammalian olfactory bulb. Neuron. 2002;34:301–315. doi: 10.1016/s0896-6273(02)00644-x. [DOI] [PubMed] [Google Scholar]
- Wachowiak M, Cohen LB. Representation of odorants by receptor neuron input to the mouse olfactory bulb. Neuron. 2001;32:723–735. doi: 10.1016/s0896-6273(01)00506-2. [DOI] [PubMed] [Google Scholar]
- Winner B, Cooper-Kuhn CM, Aigner R, Winkler J, Kuhn HG. Long-term survival and cell death of newly generated neurons in the adult rat olfactory bulb. Eur J Neurosci. 2002;16(9):1681–1689. doi: 10.1046/j.1460-9568.2002.02238.x. [DOI] [PubMed] [Google Scholar]