

Abstract
The HML and HMR mating loci of Saccharomyces cerevisiae are bound in silent chromatin, which is assembled at the flanking E and I transcriptional silencers. The retrotransposon Ty5 preferentially integrates into regions of silent chromatin, and Ty5 insertions near the HMR-E silencer account for ≈2% of total transposition events. Most Ty5 insertions occur within 800 bp on either side of the autonomously replicating consensus sequence within HMR-E. Ty5 target preference is determined by silent chromatin, because integration near HMR-E is abolished in strains with silencer mutations that alleviate transcriptional repression. The recognition of specific DNA sequences per se does not direct integration, rather, it is the protein complex assembled at the silencers. As demonstrated here for Ty5, recognition of specific chromatin domains may be a general mechanism by which retrotransposons and retroviruses determine integration sites.
Retroelements, which include retrotransposons and retroviruses, are not randomly distributed in eukaryotic genomes (1, 2). One explanation for this observation is that the cDNA intermediates of retroelement replication integrate preferentially into specific genomic sites. This model is supported by the Ty1 and Ty3 retrotransposons of Saccharomyces cerevisiae. These elements integrate preferentially upstream of tRNA genes or other genes transcribed by RNA polymerase III (pol III) (3, 4). Targeted transposition by Ty1 and Ty3 is abolished by mutations that block the assembly of pol III transcription complexes, indicating that transcriptional competence is a requirement for targeting. In vitro transposition assays with Ty3 further suggest that targeting is determined by interactions between the Ty3 integration complex and components of the pol III transcription apparatus (5). The loading of transcription factors TFIIIB and TFIIIC onto tRNA gene templates is sufficient to direct Ty3 integration.
Interactions between retroelements and chromosomal proteins is also suggested by the finding that human immunodeficiency virus (HIV) integrase binds a host factor, Ini1, which is a human homologue of the S. cerevisiae protein SNF5 (6). SNF5 is a member of the SWI/SNF protein complex that is involved in shaping chromatin and activating gene expression (7). Nucleosomes affect HIV and Moloney leukemia virus integration sites (8–12), and histone mutations can alter Ty1 integration patterns (13). These data suggest that chromatin influences target choice, and recognition of chromatin components by retroelements may be a general mechanism by which integration sites are determined.
We have recently demonstrated that the Saccharomyces retrotransposon Ty5 integrates preferentially near telomeres or the silent mating loci HML and HMR (14, 15). These regions are bound in a well-studied chromatin, called silent chromatin, which is involved in telomere function and the transcriptional inactivation of adjacent genes (16). Transcriptional silencers flanking HML and HMR (designated E and I) mediate silent chromatin assembly, and the HMR-E silencer, in particular, has been studied extensively. HMR-E consists of three cis-acting sequences, called A, E, and B. The A site is an autonomously replicating consensus sequences, which serves as an origin of DNA replication and binds the origin recognition complex. The E and B sites bind the transcription factors RAP1 and ABF1, respectively. Silent chromatin is formed through the interaction of these DNA-bound proteins with a number of other proteins, including four silent information regulators (SIR1–SIR4). The preference for Ty5 to integrate near regions of silent chromatin suggested that silent chromatin directs integration. We tested this by evaluating HMR-E mutations that influence silencing for their effects on targeted transposition.
MATERIALS AND METHODS
A Ty5 Transposition Assay.
All yeast strains carried the plasmid pNK254, which has a Ty5 element under transcriptional control of the GAL1–10 promoter and a his3AI selectable marker gene (N. Ke and D.F.V., unpublished work). To induce transposition, yeast cells were grown as patches on synthetic complete media without uracil (SC-U) and with galactose at 23°C for 2 days. Cells were scraped and resuspended in 1 ml of sterile water. For each patch, 100 μl of a 107-fold dilution of the cell suspension was plated onto nonselective media [yeast extract/peptone/dextrose (YPD)] to calculate total cell number. One hundred microliters of a 10-fold dilution was spread on selective media [SC without histidine (SC-H)]. His+ colonies that arose were replica plated to SC-H media with FOA (SC-H+FOA) to remove plasmid recombinants. The frequency of Ty5 transposition was calculated by dividing the cell number on SC-H+FOA plates by that on YPD plates and the dilution factor. Yeast strains W303–1A (MATa ade2–1 can1–100 his3–11,15 leu2–3 trp1–1 ura3–1), W303–1B, W303–1, and their derivatives with various HMR-E mutations were used for all manipulations (17, 18). The mutant strains were kindly provided by David Shore (University of Geneva) and Rolf Sternglanz (State University of New York, Stony Brook). For all mutant strains, the MATα locus was converted to MATa (19).
To quantify Ty5 integration and recombination events, several hundred His+ colonies generated from transposition assays were randomly picked and grown as small patches (≈0.5 cm × 0.5 cm) on SC-H+FOA plates. Cells that grew were considered to have Ty5 integrated in the genome, while others were considered to have Ty5 recombined with the donor plasmid (see Fig. 1). The percentage of integration events was calculated as the number of His+FOAr cells divided by the total number of His+ cells.
Figure 1.
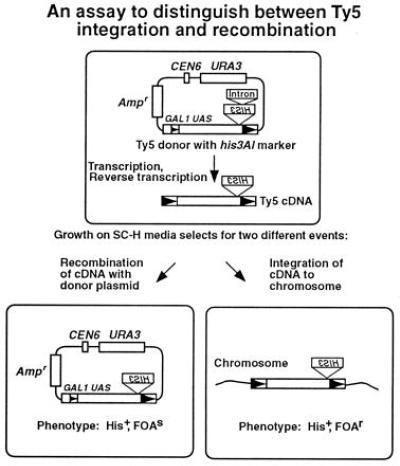
An assay to distinguish between Ty5 integration and recombination events. The Ty5 donor element is on a URA3-based vector. Ty5 cDNA is reverse transcribed, using mRNA from the donor element, which reconstitutes a functional HIS3 gene. The cDNA can either integrate into the host genome or recombine with the donor element to give rise to His+ cells. These events can be distinguished, because cells with plasmid Ty5 recombination events cannot grow on SC-H+FOA media due to the presence of the URA3 gene.
A PCR Assay to Identify Ty5 Insertions Near HMR-E and HML-E.
Polymerase chain reactions (PCR) were conducted using 50 ng of genomic DNA prepared from 10 His+FOAr strains, representing 10 independent Ty5 transposition events. The majority of His+FOAr cells were assumed to have only one insertion per genome, as supported by the characterization of more than 70 His+FOAr strains (refs. 14 and 15; data not shown). Insertions near transcriptional silencers were identified and confirmed by two rounds of PCR screening. The first round used primers that amplified all Ty5 insertions near HMR-E. This was accomplished using a Ty5-specific primer (DVO200, 5′-CATTACCCATATCATGCT-3′) and two primers that amplified a 2.3-kb window flanking HMR-E (DVO211, 5′-TGGTAGAAGCAGTAGTAACT-3′; DVO212, 5′-ACCAGAGAGTGTAACAACAG-3′). Since DNA from at least 1 of the 10 strains in each reaction did not have an insertion near HMR-E, the presence of the 2.3-kb band served as a control for the PCR reactions. One of the PCR primers (DVO212) also matched sequences flanking HML-E, and therefore Ty5 insertions in one orientation were recovered near this silencer. The second round of PCR screening used silencer-specific primers to confirm the number of insertions and to precisely map sites of integration. For HMR-E, these were DVO211, DVO200, and DVO220 (5′-CTGTGTACAAGAGTAGTACC-3′); for HML-E these were DVO247 (5′-CACGAGCTCATCTAGAGCC-3′) and DVO220. Amplifications were performed for 30 cycles using the following program: 94°C for 1 min, 50°C for 2 min, and 72°C for 5 min, with a final extension step at 72°C for 5 min.
RESULTS
A Modified Ty5 Transposition Assay.
We recently established a genetic assay to identify Ty5 transposition events in S. cerevisiae using a functional Ty5 element from Saccharomyces paradoxus (14). This assay uses a his3AI marker gene, which generates an His+ phenotype upon reverse transcription of spliced Ty5 mRNA. Analysis of His+ cells generated by our transposition assays indicated that they arose by two distinct pathways (Fig. 1). Some His+ cells were due to integration of Ty5 into the host genome and had characteristic 5-bp target site duplications (14, 15); the rest were due to recombination of Ty5 cDNA with the plasmid-borne element (N. Ke and D.F.V., unpublished work). These two events can be distinguished by taking advantage of the URA3 gene on the vector (Fig. 1). Cells with a HIS3 gene on the plasmid cannot grow on SC-H media containing FOA, which selects against the URA3 gene (20). We consider Ty5 transposition frequency to be the percentage of His+FOAr colonies, and the recombination frequency to be the percentage of His+FOAs cells. Although it is possible that some chromosomal events arise by recombination, none have been observed in the more than 54 chromosomal events characterized (14, 15). In addition, by growing each of the strains used in this study on glucose, we determined that the frequency of His+ cells that arise by reversion or recombination between plasmid and chromosomal HIS3 sequences is less than 1 × 10⁻⁸ (data not shown).
Expression of Mating Type Genes Influences the Proportion of Ty5 Integration Events.
The transcriptional silencer HMR-E is a hot spot for Ty5 integration (14). HMR-E is made up of three sequence domains, called A, E and B, which bind different proteins involved in silencing (16). Mutations in these binding sites have previously been evaluated for their role in transcriptional silencing (ref. 18; Table 1). Prior to investigating their effect on Ty5 targeting, we first tested whether these mutations influence the proportions of Ty5 integration and recombination events.
Table 1.
Integration and recombination of Ty5
| HMR-E allele | Mating type | Strain | Percentage integration events | Percentage difference from wild type | Overall transposition frequency (×10−6) | Fold reduction |
|---|---|---|---|---|---|---|
| AEB | MATa | YSZ202 | 73.0 ± 2.3 | NA | 2.88 | NA |
| AEB | MATα | YSZ201 | 75.4 ± 1.9 | 2.4 ± 4.2 | 2.81 | 1.02 |
| AEB | Diploid | YSZ200 | 57.0 ± 2.9 | 16.0 ± 5.2 | 2.35 | 1.22 |
| ΔAΔEΔB | MATα | YSZ203 | 16.1 ± 1.4 | 56.9 ± 3.7 | ND | ND |
| ΔAΔEΔB | MATa | YSZ221 | 69.7 ± 2.0 | 3.3 ± 4.3 | 1.61 | 1.79 |
| ΔAΔEB | MATa | YSZ224 | 61.4 ± 1.5 | 11.6 ± 3.8 | 1.54 | 1.87 |
| ΔAEΔB | MATa | YSZ228 | 50.9 ± 1.2 | 22.1 ± 3.5 | 2.40 | 1.20 |
| AΔEΔB | MATa | YSZ222 | 68.6 ± 0.9 | 4.4 ± 3.2 | 1.80 | 1.60 |
| ΔAEB | MATa | YSZ225 | 68.0 ± 1.2 | 5.0 ± 3.5 | 1.70 | 1.69 |
| AΔEB | MATa | YSZ227 | 57.5 ± 0.9 | 15.5 ± 3.2 | 1.58 | 1.82 |
| AEΔB | MATa | YSZ226 | 63.7 ± 0.2 | 9.3 ± 2.5 | 1.92 | 1.50 |
NA, not applicable; ND, not determined.
Integration events accounted for approximately 70% of the His+ cells generated in wild-type MATα and MATa haploid strains and about 57% of the His+ cells generated in the wild-type MATα/MATa diploid (Table 1). For the MATα strain with a deletion of HMR-E (YSZ203), the percentage of integration events decreased dramatically to 16%. This same HMR-E deletion in a MATa strain (YSZ221), however, had integration frequencies comparable to wild type (about 70%). These two mutant strains differ only in the mating type information they express (18); the MATα strain expresses both α-mating and a-mating type information from MAT and HMR, respectively, whereas the MATa strain only expresses a-mating type information. Gene expression of both mating type loci, therefore, decreases the ratio of Ty5 integration events relative to recombination events. This effect appears to be haploid specific, since the percentage of Ty5 integration is only slightly reduced in the diploid strain, which expresses both α-mating and a-mating type information.
HMR-E Mutations Do Not Significantly Affect Overall Frequencies of Ty5 Transposition.
Most of the strains with HMR-E mutations were originally constructed in a MATα background. Because expression of mating-type genes influences the proportion of Ty5 integration events, we converted these strains to MATa. The percentage of integration events and the overall transposition frequency was determined for each MATa strain using the modified transposition assay described above. Ratios of integration events ranged from 57.5 to 69.7% and were comparable to wild type (Table 1). This further suggests that only the expression of α and a mating-type information, and not mutations in HMR-E per se, is responsible for the altered levels of integration vs. recombination. Overall transposition frequencies in the HMR-E mutant strains ranged from 1.5–2.4 × 10⁻⁶ and were comparable to wild type (≈3 × 10⁻⁶; Table 1).
A PCR Assay to Measure Targeted Transposition.
Based on our previous characterization of approximately 150 independent Ty5 transposition events, we found that ≈3% of Ty5 insertions occurred near HMR-E and HML-E (14). This indicated that a large number of Ty5 insertions would be required to statistically evaluate targeting in the HMR-E mutants. To obtain the requisite numbers, we developed a PCR assay to measure targeting to HMR-E and HML-E (Fig. 2). For a given mutant, 600–1,000 His+FOAr strains were randomly collected, which represent independent Ty5 transposition events. Genomic DNA samples were prepared from pools of 10 strains, and insertions near particular silencers were amplified using a Ty5-specific and two silencer-specific primers (Fig. 2). The locations of insertions were mapped by a second round of PCR using two Ty5-specific primers and a primer specific for HMR-E or HML-E. All Ty5 insertions were recovered within about a 2-kb window encompassing a given silencer, the region preferred by Ty5 for integration.
Figure 2.

(A) A PCR assay to quantitate the frequency of Ty5 transposition to HML-E and HMR-E. Shaded bar indicates chr III. Expanded views are shown for HML and HMR, and E and I designate the flanking transcriptional silencers. W, X, and Z represent homologous regions shared between HML, HMR, and MAT. Yα and Ya are specific for HML and HMR, respectively. Transcripts (a1, a2, α1, α2) at each mating locus are shown by the longer horizontal arrows. An expanded view is shown for HMR-E indicating the A, E, and B sequence domains. Hypothetical Ty5 insertions are indicated by the labeled boxes, which are not drawn to scale. Names and locations of primers used for PCR are shown by the shorter horizontal arrows. (B) Examples of PCR products obtained in the first round of screening. Each lane shows amplification products from yeast genomic DNA derived from 10 independent transposition events. The numbers at the top of each lane indicate different pools of DNA. DNA size markers are shown at the left. DNA was amplified with primers DVO200, DVO211, and DVO212. The 2.3-kb band present in all lanes is derived from sequences flanking HMR-E without insertions; this serves as an internal PCR control. Fragments smaller than 2.3 kb indicate Ty5 insertions near HMR-E or HML-E. Subsequently, locus-specific and Ty5-specific primers were used to confirm the location of these insertions in a second round of PCR.
The Silencing Status of HMR Affects Targeted Transposition.
The results of our PCR screen to evaluate targeted transposition in strains with HMR-E mutations are shown in Table 2. For the wild-type strain, 1.9% (17/908) of Ty5 transposition events occurred near HMR-E and 2.2% (20/908) occurred near HML-E, the latter of which served as an experimental control. Due to the nature of the primers used, insertions in only one orientation near HML-E were identified (see Materials and Methods), suggesting that the actual frequency of transposition to this locus approximates 4%. Transposition to HMR-E was not significantly reduced in the ΔB strain (1.0%) relative to wild type (2.2%); however, it was reduced by about 3-fold (P < 0.05) and 4-fold (P < 0.01) in the ΔA (0.68%) and ΔE (0.48%) strains, respectively. Targeting to HMR-E in the ΔA and ΔE mutant strains was also reduced relative to HML-E. This modest affect on transposition is similar to the slight derepression of HMR transcription observed for single-domain deletions of HMR-E (18).
Table 2.
Frequency of Ty5 transposition near HML-E and HMR-E
| HMR-E allele | Strain | Total Ty5 insertions | Insertions near HML-E (%) | Insertions near HMR-E (%) | Fold reduction in targeting to HML-E† | Fold reduction in targeting to HMR-E† |
|---|---|---|---|---|---|---|
| AEB | YSZ202 | 908 | 20 (2.2) | 17 (1.9) | 1 | 1 |
| ΔAEB | YSZ225 | 884 | 14 (1.6) | 6 (0.68) | 1.4 | 2.8* |
| AΔEB | YSZ227 | 828 | 21 (2.5) | 4 (0.48) | 0.87 | 3.9** |
| AEΔB | YSZ226 | 788 | 8 (1.0) | 8 (1.0) | 2.2 | 1.8 |
| AΔEΔB | YSZ222 | 883 | 18 (2.0) | 0 (<0.11) | 1.1 | >17*** |
| ΔAEΔB | YSZ228 | 672 | 6 (0.80) | 0 (<0.15) | 2.5* | >13*** |
| ΔAΔEB | YSZ224 | 754 | 6 (0.80) | 0 (<0.13) | 2.8* | >14*** |
| ΔAΔEΔB | YSZ221 | 954 | 8 (0.84) | 0 (<0.10) | 2.6* | >18*** |
Marked numbers are significantly different from the wild type at *, P < 0.05; **, P < 0.01; ***, P < 0.001.
For strains with any two or all three silencer domains deleted, no Ty5 insertions were recovered near HMR-E among the 672–954 transposition events screened (Table 2). This corresponds to more than a 13-fold reduction in the frequency of targeted transposition. Because deletion of any one of the three domains only slightly affects silencing at HMR, and deletion of any two or all three completely disrupts HMR silencing, targeted transposition by Ty5 is directly correlated with the assembly of silent chromatin (18). For most of these mutants, transposition frequency near HML-E was approximately 3-fold reduced (P < 0.05) compared with the wild type, indicating that the transcriptional status at HMR influences targeting to HML. This supports previous observations suggesting interactions between domains of silent chromatin; for example, HMR silencing is influenced by its distance from the telomere (21).
Ty5 Integrates Nonrandomly Within a 1.6-kb Window of HMR-E.
We mapped the position of Ty5 insertions near HMR-E in strains with single-domain deletions, and found no obvious change in the integration pattern (Fig. 3). All of the insertions were within 800 bp on either side of the A site (the origin recognition complex binding site), which is consistent with previously observed targeting patterns (14). Patterns of transposition near HML-E were not altered in strains with various HMR-E mutations. Many insertions are clustered at certain sites (e.g., to the left of HML-E), suggesting that targeted integration may be influenced by local chromatin structure.
Figure 3.

(A) Location of Ty5 insertions near HMR-E. Ty5 insertions were identified throughout the ≈2-kb window represented by the open box. The reference point is the autonomously replicating consensus sequence (A) located within HMR-E. The genotype of HMR-E is indicated to the left. Arrows pointing down represent insertions in the same 5′ to 3′ orientation as the chromosome sequence, and arrows pointing up represent insertions in the opposite orientation. (B) Location of Ty5 insertions near HML-E. Only one orientation of Ty5 insertions was identified in this experiment, since only one primer (DVO212) matches sequence at the HML locus. The reference point is the A site located within HML-E. The genotype of HMR-E is indicated to the left, while the genotype of HML-E is wild type in all strains.
DISCUSSION
Silent Chromatin Directs Ty5 Integration.
The preference for Ty5 to integrate near the HMR-E transcriptional silencer is determined by silent chromatin assembled at this site. Targeted integration to HMR-E is abolished in strains with mutated silencers that alleviate transcriptional repression of HMR. DNA sequences per se are not critical for target choice, since deletion of any one of the three HMR-E sequence domains does not dramatically reduce targeting. Rather, the proteins recruited by these cis sequences appear to be responsible for target specificity. The A, E, and B domains of HMR-E interact with origin recognition complex, RAP1 and ABF1, respectively (16). These proteins are assembled into silent chromatin along with other proteins, such as SIR1–SIR4. We predict that one or more of these components interacts with the Ty5 integration complex to direct transposition.
Targeted transposition by Ty5 correlates well with the transcriptional status of HMR. Deletion of two or more HMR-E domains completely derepresses transcription and completely eliminates targeted integration (18, 22). We observed slight decreases in targeting for single ΔE and ΔA mutations. Deletion of the E domain partially derepresses transcriptional silencing at HMR (18). Although deletion of A domain does not derepress transcription, this deletion appears to weaken silencing, and ΔA mutations have been shown to enhance the level of derepression caused by certain mutations in components of silent chromatin, such as the RAP1 temperature-sensitive mutations (23). The observed reduction in Ty5 targeting for single-domain mutations, therefore, may be the consequence of a weakened silent chromatin. Whereas transcriptional silencing is sufficient for targeting to occur, it remains to be determined whether it is absolutely necessary. One or few protein factors, which by themselves cannot mediate silencing, may be capable of directing integration.
Insertion Patterns of Ty Elements.
Most Ty5 insertions near HMR-E are within 800 bp of the A site in this silencer without any orientation specificity. The boundary of silent chromatin at HMR extends over 0.8 kb upstream of HMR-E (24). Ty5 insertions, therefore, occur within this highly packed chromatin, which is inaccessible to many protein–DNA interactions (24). This suggests that the Ty5 integration complex can negotiate silent chromatin to access target sites, or that transposition occurs when these regions are disassembled, such as during DNA replication. The silent mating loci are traversed by precisely positioned nucleosomes, and DNase I and micrococcal nuclease sensitive sites have been mapped across HMR and HML (25). Hotspots for Ty5 integration, particularly near the silencers, correlate loosely with sites of prominent nuclease hypersensitivity. Additional experiments, however, are required to more precisely map integration and nuclease sensitive sites to determine whether chromatin dictates local integration site preferences.
Ty5 insertions occur on either side of their targets. This pattern is in contrast to Ty1 and Ty3 (3, 4); Ty1 insertions are generally within 700 bp upstream of pol III transcribed genes, and Ty3 integrates within several bp upstream of transcription start sites of target genes. Like Ty5, neither Ty1 nor Ty3 display an orientation preference; however, Ty1 and Ty3 insertions seldom occur downstream of the promoters in their target genes. It is interesting to note that the rDNA and tRNA genes, which are preferred targets for Ty1, repress expression of pol II transcribed genes (26–28). This suggests that silencing is a common feature of Ty targets. Retroviruses preferentially insert upstream of transcriptionally active genes, and this preference is presumably due to the presence of open chromatin at these sites (1). The differences among Ty elements and retroviruses suggest that each likely uses a unique targeting mechanism, although they probably share similar targeting strategies to recognize DNA-bound proteins or protein complexes.
Chromatin and Retroelement Targeting.
The proteins that make up silent chromatin carry out or influence numerous genetic processes, including DNA replication, transcriptional silencing, and telomere function (16). We demonstrate here that silent chromatin also directs transposition. We propose that targeted integration by Ty5 is mediated by interactions between the Ty5 integration complex and one or more protein component of silent chromatin. This is supported by preliminary data indicating that mutations in SIR genes affect targeted transposition (S. Zou and D.F.V., unpublished work). Retroelements may generally sense specific chromatin domains during integration, as supported by the observation that Ty1 and Ty3 recognize domains of pol III transcription, and that HIV integrase interacts with the chromatin-related protein Ini1 (3, 4, 6). Retroelements are the major class of interspersed repetitive DNAs in plant and animal genomes. Targeted integration is suggested by their nonrandom distribution, as evidenced by the clustering of retrotransposons in intergenic regions of maize and the association of some retroelements with heterochromatin and telomeres in Drosophila (29–32). Retroelement targeting, therefore, is likely an important factor in shaping eukaryotic genome organization.
Acknowledgments
This is journal paper J-17122 of the Iowa Agriculture and Home Economics Experiment Station (Ames, IA) (project 3120). We are grateful to Andrzej Konieczny and Jeff Smith for critical reading of the manuscript, and to our lab members Ning Ke and Xiaowu Gai for generously sharing materials and many helpful discussions. We also thank David Shore and Rolf Sternglanz for strains and plasmids. This work was funded by a grant from the American Cancer Society and an American Cancer Society Junior Faculty Research Award to D.F.V.
ABBREVIATIONS
- FOA
5-fluoroorotic acid
- pol III
RNA polymerase III
- SIR
silent information regulators
- SC-H
synthetic complete media without histidine
References
- 1.Sandmeyer S B, Hansen L J, Chalker D L. Annu Rev Genet. 1990;24:491–518. doi: 10.1146/annurev.ge.24.120190.002423. [DOI] [PubMed] [Google Scholar]
- 2.Craigie R. Trends Genet. 1992;8:187–190. doi: 10.1016/0168-9525(92)90223-q. [DOI] [PubMed] [Google Scholar]
- 3.Chalker D L, Sandmeyer S B. Genes Dev. 1992;6:117–128. doi: 10.1101/gad.6.1.117. [DOI] [PubMed] [Google Scholar]
- 4.Devine S E, Boeke J D. Genes Dev. 1996;10:620–633. doi: 10.1101/gad.10.5.620. [DOI] [PubMed] [Google Scholar]
- 5.Kirchner J, Connolly C M, Sandmeyer S B. Science. 1995;267:1488–1491. doi: 10.1126/science.7878467. [DOI] [PubMed] [Google Scholar]
- 6.Kalpana G V, Marmon S, Wang W, Crabtree G R, Goff S P. Science. 1994;266:2002–2006. doi: 10.1126/science.7801128. [DOI] [PubMed] [Google Scholar]
- 7.Hirschhorn J N, Brown S A, Clark C D, Winston F. Genes Dev. 1992;6:2288–2298. doi: 10.1101/gad.6.12a.2288. [DOI] [PubMed] [Google Scholar]
- 8.Pruss D, Bushman F D, Wolffe A P. Proc Natl Acad Sci USA. 1994;91:5913–5917. doi: 10.1073/pnas.91.13.5913. [DOI] [PMC free article] [PubMed] [Google Scholar]
- 9.Pruss D, Reeves R, Bushman F D, Wolffe A P. J Biol Chem. 1994;269:25031–25041. [PubMed] [Google Scholar]
- 10.Pryciak P M, Sil A, Varmus H E. EMBO J. 1992;11:291–303. doi: 10.1002/j.1460-2075.1992.tb05052.x. [DOI] [PMC free article] [PubMed] [Google Scholar]
- 11.Pryciak P M, Varmus H E. Cell. 1992;69:769–780. doi: 10.1016/0092-8674(92)90289-o. [DOI] [PubMed] [Google Scholar]
- 12.Pryciak P M, Muller H P, Varmus H E. Proc Natl Acad Sci USA. 1992;89:9237–9241. doi: 10.1073/pnas.89.19.9237. [DOI] [PMC free article] [PubMed] [Google Scholar]
- 13.Rinckel L, Garfinkel D. Genetics. 1996;142:761–776. doi: 10.1093/genetics/142.3.761. [DOI] [PMC free article] [PubMed] [Google Scholar]
- 14.Zou S, Ke N, Kim J M, Voytas D F. Genes Dev. 1996;10:634–645. doi: 10.1101/gad.10.5.634. [DOI] [PubMed] [Google Scholar]
- 15.Zou S, Kim J M, Voytas D F. Nucleic Acids Res. 1996;24:4825–4831. doi: 10.1093/nar/24.23.4825. [DOI] [PMC free article] [PubMed] [Google Scholar]
- 16.Laurenson P, Rine J. Microbiol Rev. 1992;56:543–560. doi: 10.1128/mr.56.4.543-560.1992. [DOI] [PMC free article] [PubMed] [Google Scholar]
- 17.Rothstein R J. Methods Enzymol. 1983;101:202–210. doi: 10.1016/0076-6879(83)01015-0. [DOI] [PubMed] [Google Scholar]
- 18.Brand A H, Micklem G, Nasmyth K. Cell. 1987;51:709–719. doi: 10.1016/0092-8674(87)90094-8. [DOI] [PubMed] [Google Scholar]
- 19.Herskowitz I, Jensen R. Methods Enzymol. 1991;194:132–146. doi: 10.1016/0076-6879(91)94011-z. [DOI] [PubMed] [Google Scholar]
- 20.Boeke J D, LaCroute F, Fink G R. Mol Gen Genet. 1984;197:345–346. doi: 10.1007/BF00330984. [DOI] [PubMed] [Google Scholar]
- 21.Thompson J S, Johnson L M, Grunstein M. Mol Cell Biol. 1994;14:446–455. doi: 10.1128/mcb.14.1.446. [DOI] [PMC free article] [PubMed] [Google Scholar]
- 22.Brand A H, Breeden L, Abraham J, Sternglanz R, Nasmyth K. Cell. 1985;41:41–48. doi: 10.1016/0092-8674(85)90059-5. [DOI] [PubMed] [Google Scholar]
- 23.Sussel L, Shore D. Proc Natl Acad Sci USA. 1991;88:7749–7753. doi: 10.1073/pnas.88.17.7749. [DOI] [PMC free article] [PubMed] [Google Scholar]
- 24.Loo S, Rine J. Science. 1994;264:1768–1771. doi: 10.1126/science.8209257. [DOI] [PubMed] [Google Scholar]
- 25.Nasmyth K. Cell. 1982;30:567–578. doi: 10.1016/0092-8674(82)90253-7. [DOI] [PubMed] [Google Scholar]
- 26.Hull M W, Erickson J, Johnston M, Engelke D R. Mol Cell Biol. 1994;14:1266–1277. doi: 10.1128/mcb.14.2.1266. [DOI] [PMC free article] [PubMed] [Google Scholar]
- 27.Bryk M, Banerjee M, Murphy M, Knudsen K E, Garfinkel D J, Curcio M J. Genes Dev. 1997;11:255–269. doi: 10.1101/gad.11.2.255. [DOI] [PubMed] [Google Scholar]
- 28.Smith J S, Boeke J D. Genes Dev. 1997;11:241–254. doi: 10.1101/gad.11.2.241. [DOI] [PubMed] [Google Scholar]
- 29.SanMiguel P, Tikhonov A, Jin Y, Motchoulskaia N, Zakharrov D, Melake-Berhan A, Springer P, Edward K, Lee M, Avramova Z, Bennetzen J. Science. 1996;274:765–768. doi: 10.1126/science.274.5288.765. [DOI] [PubMed] [Google Scholar]
- 30.Biessmann H, Mason J M, Ferry K, d’Hulst M, Valgeirsdottir K, Traverse K L, Pardue M L. Cell. 1990;61:663–673. doi: 10.1016/0092-8674(90)90478-w. [DOI] [PubMed] [Google Scholar]
- 31.Levis R W, Ganesan R, Houtchens K, Tolar L A, Sheen F M. Cell. 1993;75:1083–1093. doi: 10.1016/0092-8674(93)90318-k. [DOI] [PubMed] [Google Scholar]
- 32.Pimpinelli S, Berloco M, Fanti L, Dimitri P, Bonaccorsi S, Marchetti E, Caizzi R, Caggese C, Gatti M. Proc Natl Acad Sci USA. 1995;92:3804–3808. doi: 10.1073/pnas.92.9.3804. [DOI] [PMC free article] [PubMed] [Google Scholar]