

Abstract
During acute viral hepatitis, the intrahepatic tolerance sustained by immunosuppressive cytokines such as interleukin (IL)-4, IL-10, transforming growth factor (TGF)-β and prostaglandin E2 (PGE2), produced by Kupffer cells (KC), liver sinusoidal endothelial cells (LSEC), natural killer (NK) T cells and natural regulatory T cells may be disturbed. NK cells are recruited normally in the liver and produce interferon (IFN)-γ to control viral replication. The use of mouse hepatitis virus type 3 (MHV3) attenuated variants showing selected tropisms for KC or LSEC have allowed determining their roles in the disturbances of immune tolerance during viral hepatitis. Groups of C57BL/6 mice were infected with the pathogenic L2-MHV3 (KC+, LSEC+), low attenuated 51·6-MHV3 (KC+, LSEC−) or high attenuated CL12-MHV3 (KC−, LSEC−) variants for the first 3 days. Results showed that IL-10, TGF-β and PGE2 production in the liver decreased in L2-MHV3-infected mice and increased in 51·6-MHV3- and CL12-MHV3-infected mice. The ratio of IFN-γ/IL-4 in liver decreased in L2-MHV3-infected mice, while it was not (or low) altered in mice infected with the attenuated MHV3 variant mice. Phenotypic analysis of intrahepatic mononuclear cells revealed that apoptotic NK and NK T cells increased in mice infected with the L2-MHV3, but were minor in 51·6-MHV3- and CL12-MHV3-infected mice. The numbers of CD4+ forkhead box P3+ cells increased in the livers from low pathogenic CL12-MHV3 and YAC-MHV3-infected mice. These results indicate that viral permissivity of KC and LSEC is involved in the decrease of IL-10 and PGE2, while KC may play an additional role in the apoptosis of NK and NK T cells during acute viral hepatitis.
Keywords: immunosuppressive cytokines, MHV3, NK/NK T cells, pathogenicity
Introduction
Viral hepatitis is an inflammatory disease induced by various viruses, mainly human hepatitis B virus (HBV) and hepatitis C virus (HCV), and their elimination is under the control of innate and adaptive immune responses [1]. Integrity of the liver sinusoidal endothelial cells (LSEC), Kupffer cells (KC), natural killer (NK) T cells and natural regulatory T (Treg) cells is essential to preserve immune tolerance in the liver. KC maintain hepatic tolerance by producing interleukin (IL)-10 and prostaglandin E2 (PGE2), involved in the inhibition of recruited antigen-specific CD4+ and CD8+ T cells to the liver by impairment of the surface expression of CD54, CD106, CD80 and CD86 expression in LSEC [2,3]. Furthermore, LSEC are known to produce tumour growth factor (TGF)-β, IL-10 and PGE2 to promote liver regeneration and maintain immune tolerance [3,4]. NK T cells are involved in the control of hepatic immune tolerance through the production of IL-4 or interferon (IFN)-γ[5,6]. Finally, certain subpopulations of T cells, called natural Treg cells, generally expressing the CD4+ CD25+ forkhead box P3+ (FoxP3+) phenotype, are known to inhibit cellular activation through the production of immunosuppressive cytokines such as IL-10 and/or TGF-β, which control inflammatory responses and hepatic damage in chronic HCV carriers [7,8]. The liver is an organ enriched in NK and NK T cells. NK cells are involved in virus defence through their cytotoxic function and their capacity to secrete cytokines such as IFN-γ. In immune tolerance, NK T cells are a peculiar subpopulation of cells expressing the NK1·1 marker and bearing a limited expression of T cell receptor (TCR)-αβ or TCR-γδ that recognize the CD1d molecule at the surface of antigen-presenting cells [9,10]. Moreover, the function of NK T cells may be CD1d-restricted or CD1d-unrestricted, and it has been suggested that CD1d-unrestricted NK T cells are involved in the activation of the innate immune response, whereas CD1d-restricted NK T cells promote adaptive immune response [11].
It has been shown that NK and NK T cells are important to control the replication of HBV and HCV in liver through their secretion of IFN-γ[12–15]. However, various studies have suggested a detrimental role of NK and NK T cells during HBV and HCV infections, or in concanavalin A (ConA)- and α-galactosideceramide (αGalCer)-induced hepatitis [16–19]. Treg cells may decrease the activation of NK cells during the disease [20,21] and, inversely, activated NK cells may down-regulate FoxP3 expression in CD4+ CD25+ Treg cells [22].
As the immune tolerance mechanism in liver depends greatly upon the integrity of various populations of hepatic cells, it is difficult to study the functional relationships between LSEC, KC, Treg, NK and NK T cells in the breakdown of tolerance during a viral hepatitis. The use of a natural mouse hepatitis model, the mouse hepatitis virus type 3 (MHV3) and its variants possessing different cell tropisms and inducing different levels of hepatitis, may be helpful to unravel the roles for these cells in the aetiology of disease. The pathogenic L2-MHV3 strain induces acute hepatitis in C57BL/6 mice, and death of the animal occurs within 3–4 days [23]. KC, LSEC and hepatocytes are permissive to the pathogenic L2-MHV3 virus and acute hepatitis is related to extensive necrosis in the liver and to immunodeficiency in several lymphoid organs [23–25]. The 51·6-MHV3 variant is less virulent than L2-MHV3, killing mice within 5–9 days, inducing moderate liver necrosis and infecting KC cells, but not LSEC [25]. The highly attenuated CL12-MHV3 variant induces the death of mice within 8–10 days, minor hepatitis with perivascular inflammatory foci, no immunodeficiency and undetectable infectious virions in LSEC or KC [25]. However, viral replication in liver was similar for pathogenic parental virus and attenuated variants [26], suggesting that the gravity of hepatitis depends on the intensity of the inflammatory response. Finally, a non-pathogenic YAC-MHV3 variant, isolated from a persistent viral infection in YAC-1 cells, induces subclinical hepatitis characterized by few perivascular local inflammatory foci, and subsequent recovery occurring within less than 15 days [27].
We have demonstrated previously that L2-MHV3-induced acute hepatitis is related to the impairment of innate immunity as splenic, myeloid and intrahepatic NK and NK T cells decrease [28]. Nevertheless, Stohlman et al. have demonstrated that splenic NK cells from MHV-A59-infected Balb/c mice are unable to produce IFN-γ although still exerting their cytotoxic activities [29].
We suggest that the viral permissivity of KC and/or LSEC to pathogenic L2-MHV3 results in the breakdown of liver immune tolerance sustained through a decrease in the production of immunosuppressive cytokines by these cells. In addition, an imbalance of intrahepatic NK, NK T and Treg cells may thus favour the generation of fulminant acute hepatitis.
In this study, we report that levels of intrahepatic IL-10, TGF-β, PGE2 and the IFN-γ/IL-4 ratio decreased in the livers of pathogenic L2-MHV3-infected mice, but increased gradually in liver from mice infected with the attenuated variants. The viral permissivity of both KC and LSEC is involved in marked down-regulation of immunosuppressive cytokines. In addition, KC play a role in NK/NK T disorders during acute viral hepatitis.
Materials and methods
Mice
C57BL/6 mice were purchased from Charles River Laboratories (St-Constant, Québec, Canada) and were housed under HEPA-filtered air (Forma Scientific, Marietta, OH, USA). Female mice between 8 and 12 weeks of age were used in all experiments. The study was conducted in compliance with regulations from the Animal Committee of the University of Québec in Montreal.
Viruses
L2-MHV3 is a cloned pathogenic substrain isolated from the liver of infected DBA2 mice and maintained in L2 cells, as described previously [30]. Escape mutants 51·6-MHV3 and CL12-MHV3 were selected from the pathogenic L2-MHV3 virus in the presence of S protein-specific A51 and A37 monoclonal antibodies respectively [25]. The non-pathogenic YAC-MHV3 variant is a cloned substrain produced in persistently infected YAC-1 cells [27]. Pathogenic and target cell properties are summarized in Table 1. All viruses were produced in L2 cells and their pathogenic properties were assessed regularly.
Table 1.
Characterization of pathogenic properties and cell tropisms of MHV3 variants.
| L2-MHV3 | 51·6-MHV3 | CL12-MHV3 | YAC-MHV3 | |
|---|---|---|---|---|
| Mortality (days p.i.) | ≈ 3–4 | ≈ 5–9 | ≈ 8–10 | Viral elimination |
| Histopathology | Acute fulminating hepatitis with extensive necrosis | Acute hepatitis with intrahepatic necrosis | Weak hepatitis with perivascular inflammatory foci | Subclinical hepatitis with local inflammatory foci |
| Immunodeficiency | Yes | Yes | No | No |
| Infection of LSEC | Yes | No | No | No |
| Infection of KC | Yes | Yes | No | Low replication |
LSEC, liver sinusoidal endothelial cells; KC, Kuppfer cells; p.i., post-infection. MHV3, mouse hepatitis virus type 3.
In vivo viral infections
Groups of three mice were infected intraperitoneally (i.p.) with 1000 tissue culture infective dose 50% (TCID50) of L2-MHV3, 51·6-MHV3, CL12-MHV3 or YAC-MHV3 viruses. Mock-infected mice received a similar volume of RPMI-1640 (Gibco laboratories, Grand Island, NY, USA). At various times post-infection (p.i.), the mice were anaesthetized by i.p. injection using ketamine hydrochloride (200 mg/kg) (Vetrepharm Canada Inc., Belleville, Ontario, Canada) and xylazine (10 mg/kg) (Bayer Inc., Toronto, Ontario, Canada). Mice were bled by section of the portal vein and aortic artery, as described by Watanabe et al. [31]. The livers were harvested following exsanguination.
Cells
The continuous mouse fibroblast L2 cell line was grown in RPMI-1640 supplemented with glutamine (2 mM), antibiotics (penicillin 100 U/ml and streptomycin 100 mg/ml) (Gibco laboratories) and 5% fetal calf serum (FCS) (Gemini Bio-Products, Woodland, CA, USA). L2 cells were used for virus production.
Intrahepatic mononuclear cells (MNCs) were isolated from the liver of three mice in each experimental group, as described previously [32]. Briefly, the liver was pressed through a 70 μm cell strainer (Falcon Scientific Co., Montreal, Québec, Canada) which was then washed with 10 ml of supplemented RPMI-1640 and 20% FCS. The cell suspension was then layered on 7 ml of FCS to allow debris sedimentation. The top layer was centrifuged for 10 min at 1000 g and the supernatant was collected for quantification of cytokines. The cells were then resuspended and centrifuged on top of a discontinuous Percoll gradient (45% and 67% Percoll) (Amersham Pharmacia, Uppsala, Sweden) for 30 min at 1000 g. MNCs were collected at the interface of the 45% and 67% Percoll layers. The cells were then washed and resuspended in phosphate buffer saline (PBS) (Gibco laboratories). Cell viabilities, ranging from 90 to 100%, were assayed by a trypan blue exclusion test.
In vitro viral infections
Intrahepatic MNCs were isolated from the livers of uninfected mice and were seeded in 24-well plates at a concentration of 106 cells/ml in supplemented RPMI-1640 and 20% FCS. The cells were infected with 0·1–1·0 multiplicity of infection (m.o.i.) of L2-MHV3, 51·6-MHV3, CL12-MHV3 or YAC-MHV3 viruses, and were then incubated further at 37°C, under 5% CO2, for 48 h.
Flow cytometric analysis
The percentages of intrahepatic NK1·1+TCR-αβ−, NK1·1– TCR-αβ+, NK1·1+ TCR-αβ+, CD4+ FoxP3− and CD4+ FoxP3+ T cells from mock- or different virus-infected mice were determined by two double immunolabellings. Intrahepatic MNCs were isolated, 106 cells were resuspended in PBS and CD16/CD32 receptors were blocked (Pharmingen, Toronto, Ontario, Canada) for 15 min. The cells were then incubated on ice for 30 min with 1 μg of anti-mouse fluorescein isothiocyanate (FITC)-NK1·1 (clone PK136, mouse IgG2a κ; Pharmingen), 1 μg of anti-mouse phycoerythrin (PE)-TCR-β (clone H57-597, Armenian Hamster IgG2 l1; Pharmingen) or 1 μg of anti-mouse PE-CD4 (clone RM4-5, rat IgG2a κ; Pharmingen). Depending upon the experiment, thereafter the cells were fixed and permeabilized (eBioscience, San Diego, CA, USA) and labelled with 1 μg of anti-mouse/rat FITC-FoxP3 [clone FJK-16 s, rat immunoglobulin G2a (IgG2a) κ; eBioscience]. Flow cytometric analysis was performed on a fluorescence-activated cell sorter flow cytometer (FACScan) (Becton-Dickinson, Mountain View, CA, USA) and with CellQuest software (Becton-Dickinson). Ten thousand cells were analysed per sample and percentages of various subpopulations were determined by multi-parametric analysis.
TdT-mediated biotin-dUTP nick-end labelling assay
Intrahepatic MNCs were purified from mock-infected and L2-MHV3-infected C57BL/6 mice and adjusted to a concentration of 106 cells/ml. The cells were stained with the FITC-TdT-mediated biotin-dUTP nick-end labelling (TUNEL) reagent (Roche Diagnostics, Laval, Québec, Canada) for 60 min at 37°C in a humidified atmosphere. Flow cytometric analysis was performed on a FACScan and with CellQuest software as indicated above.
Determination of intracytoplasmic viral proteins
Permissivity of intrahepatic NK and NK T cells to viral infection was verified by two double immunolabellings. In vitro-infected intrahepatic MNCs were collected, 106 cells were resuspended in PBS and CD16/CD32 receptors were blocked for 15 min. The cells were then incubated on ice for 30 min with 1 μg of anti-mouse CD1d : Ig (recombinant fusion protein, mouse DimerX; Pharmingen)/PE-IgG1 (anti-mouse IgG1, clone A85-1; Pharmingen) or 1 μg of anti-mouse PE-DX5 (clone DX5, rat IgMκ; Pharmingen). Once washed, the cells were incubated thereafter on ice 30 min with optimal dilutions of anti-mouse MHV3 (polyclonal anti-sera)/FITC-IgG (anti-mouse IgG, γ-chain specific, Sigma-Aldrich, Oakville, Ontario, Canada). Flow cytometric analysis was performed on a FACScan with CellQuest software as indicated above.
Cytokine determinations by enzyme-linked immunosorbent assay
Cytokines produced in the liver of mock- and MHV3-infected mice were quantified using IFN-γ, IL-4, IL-10, TGF-β (Pharmingen) and PGE2 (Biosource International, Camarillo, CA, USA) commercial mouse enzyme-linked immunosorbent assay (ELISA) tests. Results were reproducible in all the groups of treated-mice.
Statistical analysis
Comparisons between cytokine levels and percentages of cell subsets of infected and control mice were performed using a two-way anova test. All statistical comparisons were calculated with the GraphPad Prism version 4·03 software. Error bars represent standard error and a value of P < 0·05 was considered significant.
Results
Pathology induced by the pathogenicity variants of MHV3 in susceptible C57BL/6 mice
In order to verify the level of hepatitis induced by the different virus variants, groups of three C57BL/6 mice were infected with 1000 TCID50 of pathogenic L2-MHV3 (LSEC+, KC+), low attenuated 51·6-MHV3 (LSEC−, KC+), highly attenuated CL12-MHV3 (LSEC−, KC−) or non-pathogenic YAC-MHV3 (LSEC−, KC+) viruses. The mice were anaesthetized at 24 h, 48 h and 72 h p.i. and their livers were collected. Macroscopic observations of organs revealed that livers from mice infected with the pathogenic L2-MHV3 virus were friable, pale, with rounded extremities. These features were moderate in livers from 51·6-MHV3-infected mice and were considerably milder in livers from CL12-MHV3-infected mice. The livers from YAC-MHV3-infected mice exhibited normal colour and texture. Macroscopic observations were consistent with previous pathological features of the liver from mice infected with these variants, as reported previously [23,25,26].
Impairment of intrahepatic immunosuppressive cytokines production during an acute viral hepatitis induced by the pathogenic L2-MHV3, low attenuated 51·6-MHV3, highly attenuated CL12-MHV3 and non-pathogenic YAC-MHV3 viruses
Differences in the level of hepatitis in accordance with the KC and LSEC tropism variants suggests that immunosuppressive cytokines produced by these cells may be altered in acute hepatitis. Groups of three C57BL/6 mice were infected with 1000 TCID50 of pathogenic L2-MHV3, low attenuated 51·6-MHV3, highly attenuated CL12-MHV3 or non-pathogenic YAC-MHV3 viruses. The livers were collected at various times p.i., and the levels of IL-10, TGF-β and PGE2 were determined by ELISA tests in the supernatants from liver extracts.
When compared with livers from mock-infected mice, intrahepatic production of IL-10 decreased in mice infected with the pathogenic L2-MHV3 virus from 48 h (P < 0·05) to 72 h p.i. (P < 0·01), whereas it increased in mice infected with the non-pathogenic YAC-MHV3 variant from 24 h to 72 h p.i. (P < 0·01 at 24 h p.i.; P < 0·05 at 48 h and 72 h p.i.) (Fig. 1a). Furthermore, IL-10 was produced in livers from highly attenuated CL12-MHV3-infected mice at 72 h p.i. (P < 0·01), whereas it increased slightly at 48 h p.i. only in mice infected with low attenuated 51·6-MHV3 (P < 0·05) (Fig. 1a).
Fig. 1.
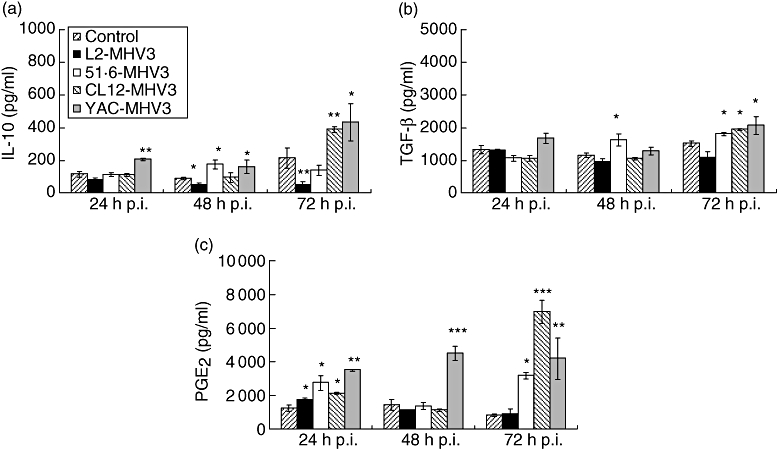
Production of intrahepatic interleukin-10 (a), transforming growth factor-β (b) and prostaglandin E2 (c) in mock-, L2-mouse hepatitis virus type 3 (MHV3)-, 51·6-MHV3-, CL12-MHV3- and YAC-MHV3-infected C57BL/6 mice at various times post-infection. Three mice were used in each experimental group (*P < 0·05, **P < 0·01, ***P < 0·001).
Intrahepatic TGF-β levels were not affected in C57BL/6 mice infected with the pathogenic L2-MHV3 virus, whereas they increased in liver from all attenuated MHV3 variants at 72 h p.i. (P < 0·05). A slight increase in TGF-β was also observed at 48 h p.i. in 51·6-MHV3-infected mice (P < 0·05) (Fig. 1b).
Intrahepatic PGE2 increased in all infected mice at 24 h p.i. (P < 0·05 for L2-MHV3, 51·6-MHV3 and CL12-MHV3; P < 0·01 for YAC-MHV3) (Fig. 1c), and dropped at 48 h p.i. in all mice except for the group of mice infected with the YAC-MHV3 variant (P < 0·001). Intrahepatic PGE2 increased in all attenuated MHV3-infected mice at 72 h p.i. (P < 0·05 for 51·6-MHV3; P < 0·001 for CL12-MHV3; P < 0·01 for YAC-MHV3) (Fig. 1c).
Intrahepatic IFN-γ/IL-4 ratio reflects the pathogenicity of the different MHV3 variants
The decrease in immunosuppressive cytokines is in inverse relationship with the pathogenicity of MHV3 variants, suggesting an imbalance between the levels of proinflammatory IFN-γ and the suppressive IL-4 cytokine in the liver. In order to verify this hypothesis, groups of three C57BL/6 mice were infected with 1000 TCID50 of pathogenic L2-MHV3, low attenuated 51·6-MHV3, highly attenuated CL12-MHV3 or non-pathogenic YAC-MHV3 viruses. The livers were collected at various times p.i. and intrahepatic IFN-γ and IL-4 production was determined by ELISA tests in supernatants from liver extracts.
IFN-γ levels decreased in the livers from all MHV3-infected C57BL/6 mice as early as 24 h p.i. (P < 0·05 for L2-MHV3, 51·6-MHV3 and YAC-MHV3; P < 0·01 for CL12-MHV3) (Fig. 2, section Ia). Thereafter, IFN-γ levels decreased further in the liver of all MHV3-infected mice except for the YAC-MHV3-infected mice (P < 0·001 for L2-MHV3; P < 0·05 for 51·6-MHV3; P < 0·01 for CL12-MHV3). At 72 h p.i., IFN-γ was impaired only in L2-MHV3-infected mice (P < 0·001), whereas the levels increased slightly for all attenuated MHV3 variants (P < 0·05).
Fig. 2.
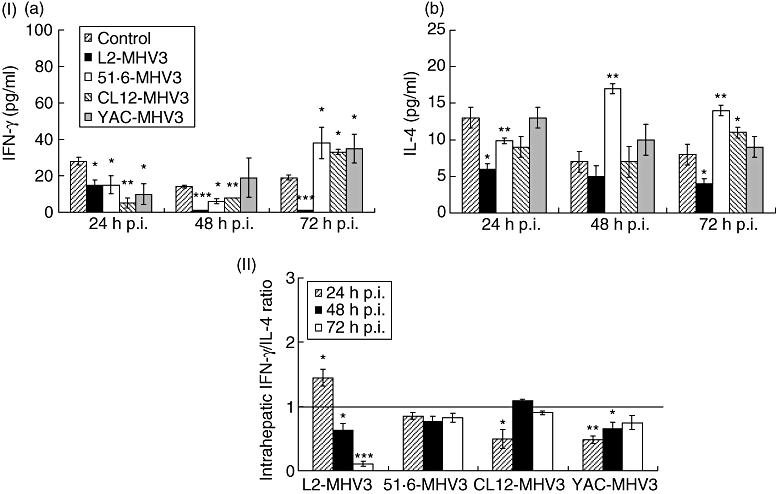
Section I: production of intrahepatic interferon (IFN)-γ (a) and interleukin (IL)-4 (b) in mock-, L2-mouse hepatitis virus type 3 (MHV3)-, 51·6-MHV3-, CL12-MHV3- and YAC-MHV3-infected C57BL/6 mice at various times post-infection (p.i.). Section II: intrahepatic IFN-γ/IL-4 ratios in L2-MHV3-, 51·6-MHV3-, CL12-MHV3- and YAC-MHV3-infected C57BL/6 mice at various times p.i. Three mice were used in each experimental group. Intrahepatic IFN-γ/IL-4 ratios in virally infected mice were compared with those from mock-infected mice which were considered as a value of 1 (*P < 0·05, **P < 0·01, ***P < 0·001).
Similarly, IL-4 decreased rapidly in livers from L2-MHV3-, 51·6-MHV3- and CL12-MHV3-infected mice as early as 24 h p.i. (P < 0·01 for L2-MHV3; P < 0·05 for 51·6-MHV3 and CL12-MHV3) (Fig. 2, section Ib), and remained lower at 72 h only in L2-MHV3-infected mice (P < 0·05). However, intrahepatic IL-4 increased in 51·6-MHV3-infected mice up to 48–72 h p.i. (P < 0·01 for both times), while only a slight increase was noted with the CL12-MHV3 variant at 72 h p.i. (P < 0·05). No changes were observed in YAC-MHV3-infected mice.
The IFN-γ/IL-4 ratio, as defined by the difference between the ratio of these cytokines in liver from infected mice compared with those from mock-infected mice, was calculated for each mouse infected with the different virus variants. Consequently, the ratio for mock-infected mice has been fixed to a value of 1 and the ratios from infected mice were compared with the ratio in mock-infected mice. Results shown in Fig. 2 (section II) reveal that the intrahepatic IFN-γ/IL-4 ratio for the L2-MHV3 virus increased only at 24 h p.i. (P < 0·05), decreasing thereafter until 72 h p.i. (P < 0·05 at 48 h p.i.; P < 0·001 at 72 h p.i.). No variation of the intrahepatic IFN-γ/IL-4 was measured in mice infected with the attenuated MHV3 variants, except for the CL12-MHV3 virus at 24 h p.i. (P < 0·05), and the YAC-MHV3 virus at 24 h (P < 0·01) and 48 h p.i. (P < 0·05), which were lower than mock-infected mice. Nevertheless, the intrahepatic IFN-γ/IL-4 ratio increased slightly with time in CL12-MHV3- and YAC-MHV3-infected mice.
The CD4+ FoxP3+ cell population is not involved in the production of intrahepatic immunosuppressive cytokines in attenuated MHV3-infected mice
The increases of the IL-10 and TGF-β levels observed at 72 h p.i. in the livers from mice infected with the attenuated MHV3-infected C57BL/6 but not with the pathogenic L2-MHV3 parental virus may be resulting from the activation of Treg cells, known to secrete these cytokines [7]. To verify this hypothesis, groups of three C57BL/6 mice were infected with 1000 TCID50 of pathogenic L2-MHV3, low attenuated 51·6-MHV3, highly attenuated CL12-MHV3 or non-pathogenic YAC-MHV3 viruses. The livers were collected at 72 h p.i., and intrahepatic MNCs were phenotyped using anti-FoxP3 and anti-CD4 antibodies. The numbers of CD4+ FoxP3+ cells increased in the livers from CL12-MHV3 and YAC-MHV3-infected mice (P < 0·05) (Fig. 3a). However, the population of CD4+ FoxP3– cells decreased in L2-MHV3 and 51·6-MHV3-infected mice, whereas they increased in CL12-MHV3 and YAC-MHV3-infected mice (P < 0·05) (Fig. 3b). In consequence, the relative level of hepatic Tregs increased slightly in L2-MHV3-infected mice (P < 0·05), while they were not altered significantly in mice infected with the attenuated MHV3 variants (Fig. 3c).
Fig. 3.
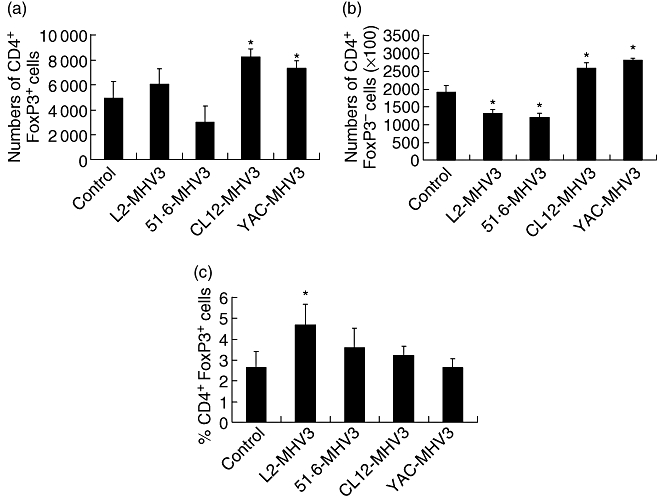
Numbers of CD4+ forkhead box P3+ (FoxP3+) (a) and CD4+ FoxP3– (b) cells, and percentages of CD4+ FoxP3+ cells within the intrahepatic CD4+ cell population (c) from mock-, L2-mouse hepatitis virus type 3 (MHV3)-, 51·6-MHV3-, CL12-MHV3- and YAC-MHV3-infected C57BL/6 mice at 72 h post-infection. Three mice were used in each experimental group. The cells were analysed using a fluorescence activated cell sorter (FACScan) flow cytometer. A total of 10 000 events were recorded. The cell numbers of each subset were calculated on the basis of 106 isolated intrahepatic mononuclear cells (*P < 0·05).
Intrahepatic NK1·1+ TCR-β–, NK1·1+ TCR-β– and NK1·1– TCR-β+ cells in livers from mice infected with the pathogenic MHV3 variants
Proinflammatory IFN-γ and suppressive IL-4 are produced normally in the liver by intrahepatic NK and NK T cells [5,10]. The strong decrease of IFN-γ and IL-4 in liver measured in L2-MHV3-infected mice and the transient decrease of these cytokines in the liver from attenuated MHV3-infected mice suggests a decrease in IFN-γ-producing NK or IL-4/IFN-γ-producing NK T cells. We have also observed previously that the numbers of intrahepatic NK cells, but not NK T cells, decreased in L2-MHV3-infected mice because of apoptosis [28].
First, groups of three mice were infected with 1000 TCID50 of pathogenic L2-MHV3, low attenuated 51·6-MHV3, highly attenuated CL12-MHV3 or non-pathogenic YAC-MHV3 viruses and the livers were collected at different times p.i. Intrahepatic MNCs were isolated and labelled subsequently with the TUNEL reagent in order to localize the normal and apoptotic MNCs by cytofluorometric analysis. As shown in Fig. 4 (section Ia), two distinct cell populations were observed according to forward-scatter/side-scatter (FSC/SSC) parameters: the G1 region was characterized by cells expressing high FSC and low SSC parameters, and the G2 region contained cells with low FSC and higher SSC profiles. TUNEL labelling revealed that a small percentage of G1 cells were TUNEL+ (10·0 ± 2·4%), whereas the majority of G2 cell population were TUNEL+ (97·0 ± 3·0%). The percentages of total MNCs within the G1 region decreased in L2-MHV3-infected mice and increased in the G2 region (Fig. 4, section Ia). However, no differences in the percentages of TUNEL+ cells in G1 and G2 cell groups were observed in intrahepatic MNCs isolated from mock-infected or from L2-MHV3-infected mice. Results presented in this figure refer to one mock-infected and one L2-MHV3-infected mouse and are representative of all mice from each group. The apoptosis of cells within the G2 region observed by the TUNEL test was also confirmed by annexin V/propidium iodide labelling (data not shown).
Fig. 4.
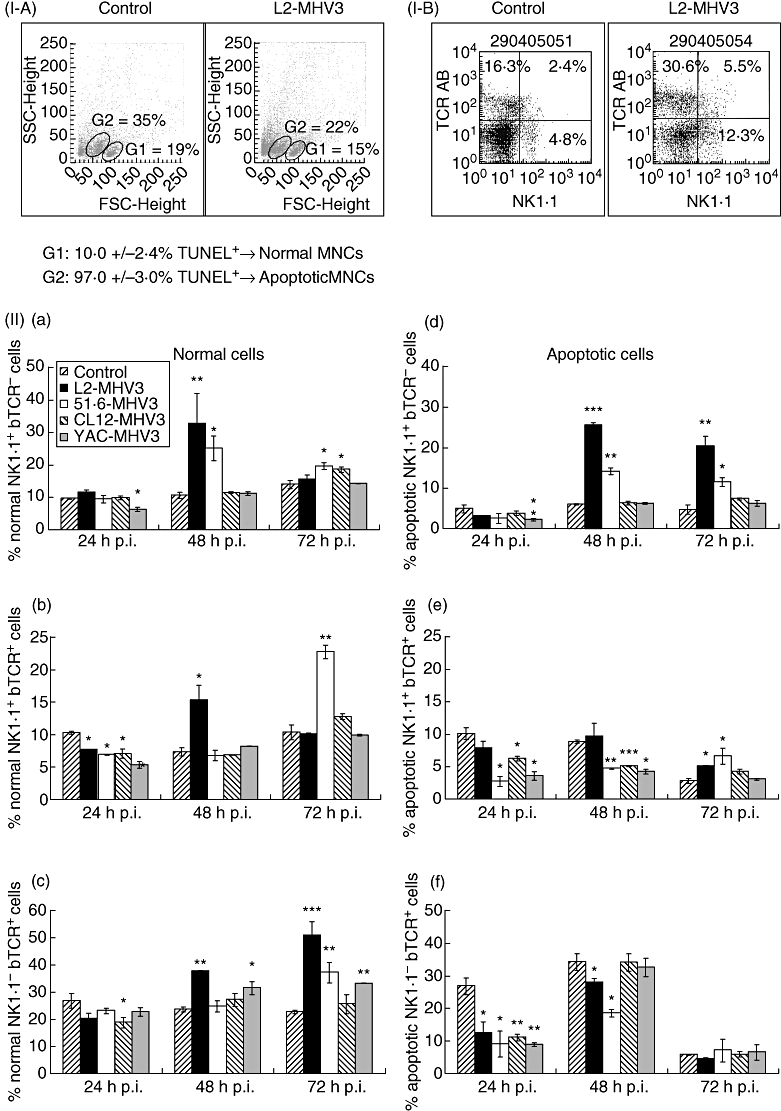
Section I: expression of TdT-mediated biotin-dUTP nick-end labelling+ cells in normal (G1 region) and apoptotic (G2 region) intrahepatic mononuclear cells from mock- and L2-mouse hepatitis virus type 3 (MHV3)-infected C57BL/6 mice (a) and dot plots of the double immunolabelling fluorescein isothiocyanate-natural killer (NK) 1·1 and phycoerythrin-T cell receptor (TCR)-β from mock- and L2-MHV3-infected C57BL/6 mice (b). Section II: normal (a, c, e) and apoptotic (b, d, f) intrahepatic NK1·1+ TCR-β– (a, b), NK1·1+ TCR-β+ (c, d) and NK1·1– TCR-β+ (e, f) cells in mock-, L2-MHV3-, 51·6-MHV3-, CL12-MHV3- and YAC-MHV3-infected C57BL/6 mice at various times post-infection. Three mice were used in each experimental group. The cells were analysed using a fluorescence activated cell sorter (FACScan) flow cytometer. A total of 10 000 events were recorded (*P < 0·05, **P < 0·01, ***P < 0·001).
Second, to identify the phenotype of normal and apoptotic intrahepatic cells, intrahepatic MNCs were then double-labelled with anti-NK1·1 and anti-TCR-β antibodies. The multi-parametric analysis of NK1·1+ TCR-β−, NK1·1+ TCR-β+ and NK1·1– TCR-β+ cells in livers from infected mice was then conducted with cells within the G1 or G2 regions. Results presented in Fig. 4 (section IIa) indicate that intrahepatic NK1·1+ TCR-β− cells from normal cells (G1 region) increased in livers from pathogenic L2-MHV3-infected mice at 48 h p.i. (P < 0·01) and in low attenuated 51·6-MHV3-infected mice from 48 h to 72 h p.i. (P < 0·05 for both times). No significant variations in this cell population were observed in livers from highly attenuated CL12-MHV3-infected mice, whereas they decreased slightly at 24 h p.i. in non-pathogenic YAC-MHV3-infected mice (P < 0·05).
Percentages of intrahepatic NK T cells (NK1·1+ TCR-β+) in normal cells (G1 region) decreased in all MHV3-infected mice at 24 h p.i. (P < 0·05 for all MHV3 viruses) (Fig. 4, section IIb). These cells increased transiently at 48 h p.i. in pathogenic L2-MHV3-infected mice (P < 0·05) and at 72 h p.i. in low attenuated 51·6-MHV3-infected mice (P < 0·01).
In addition, NK1·1– TCR-β+ cells increased from 48 h to 72 h p.i. in the livers from L2-MHV3- (P < 0·001 for both times) and YAC-MHV3-infected mice (P < 0·05 at 48 h p.i.; P < 0·01 at 72 h p.i.) compared with mock-infected mice (Fig. 4, Sect. IIc). An increase in this cell population was noted only with the 51·6-MHV3 variant at 72 h p.i. (P < 0·01), whereas it decreased at 24 h p.i. with the CL12-MHV3 virus (P < 0·05).
However, apoptotic intrahepatic NK1·1+ TCR-β– cells (G2 region) increased strongly from 48 h to 72 h p.i. in L2-MHV3- (P < 0·001 for 48 h p.i.; P < 0·01 for 72 h p.i.) and 51·6-MHV3-infected mice (P < 0·01 for 48 h p.i.; P < 0·05 for 72 h p.i.) (Fig. 4, section IId). No significant variations were observed in cells from mice infected with the CL12-MHV3 variant, characterized by a transient decrease only at 24 h p.i. in YAC-MHV3-infected mice (P < 0·05).
The percentages of apoptotic NK1·1+ TCR-β+ (NK T) cells increased in livers from L2-MHV3- and 51·6-MHV3-infected mice at 72 h p.i. only (P < 0·05) (Fig. 4, section IIe). However, they decreased in livers from all attenuated MHV3-infected mice from 24 h (P < 0·05 for all attenuated MHV3 variants) to 48 h p.i. (P < 0·001 for 51·6-MHV3 and CL12-MHV3; P < 0·01 for YAC-MHV3).
Finally, apoptotic intrahepatic NK1·1– TCR-β+ cells decreased at 24 h p.i. in all MHV3-infected mice (P < 0·05 for L2-MHV3 and 51·6-MHV3; P < 0·01 for CL12-MHV3 and YAC-MHV3) and remained lower than mock-infected mice at 48 h p.i. only in L2-MHV3- (P < 0·05) and 51·6-MHV3-infected mice (P < 0·05). No variation in the apoptotic NK1·1– TCR-β+ cell population was observed at 72 h p.i. for all groups of mice (Fig. 4, section IIf).
Relationships between hepatic NK/NK T cell ratios and hepatitis levels
To verify if the imbalance in NK and NK T cells reflects viral pathogenicity, the NK/NK T cell ratios in normal and apoptotic MNCs in the livers from groups of three C57BL/6 mice infected with 1000 TCID50 of pathogenic L2-MHV3, low attenuated 51·6-MHV3, highly attenuated CL12-MHV3 or non-pathogenic YAC-MHV3 viruses were calculated and compared with mock-infected mice.
Natural killer/NK T cell ratios in the normal cell population (G1 region) increased as early as 24 h p.i. in pathogenic L2-MHV3-infected mice (P < 0·05) and non-significantly at 48 h p.i. This ratio also increased in low attenuated 51·6-MHV3-infected mice from 24 h (P < 0·05) to 48 h p.i. (P < 0·01) but decreased thereafter at 72 h p.i. (P < 0·05). Only a slight increase was noted with the highly attenuated CL12-MHV3 variant at 24 h p.i. (P < 0·05), and no significant variation was observed with the non-pathogenic YAC-MHV3 virus (Table 2).
Table 2.
Normal and apoptotic intrahepatic natural killer (NK)/NK T cell ratios in pathogenic L2-mouse hepatitis virus type 3 (MHV3)-, low attenuated 51·6-MHV3-, highly attenuated CL12-MHV3- and non-pathogenic YAC-MHV3-infected C57BL/6 mice at various times post-infection.
| Times post-infection (h) | ||||
|---|---|---|---|---|
| Cell populations | Viral infection† | 24 | 48 | 72 |
| Normal cells | Mock-infected | 0·94 ± 0·04 | 1·45 ± 0·11 | 1·35 ± 0·07 |
| L2-MHV3 | 1·51 ± 0·10* | 2·14 ± 0·95 | 1·54 ± 0·31 | |
| 51·6-MHV3 | 1·38 ± 0·17* | 3·72 ± 0·49** | 0·86 ± 0·19* | |
| CL12-MHV3 | 1·39 ± 0·23* | 1·67 ± 0·09 | 1·46 ± 0·25 | |
| YAC-MHV3 | 1·18 ± 0·24 | 1·36 ± 0·11 | 1·43 ± 0·04 | |
| Apoptotic cells | Mock-infected | 0·49 ± 0·14 | 0·68 ± 0·03 | 1·67 ± 0·62 |
| L2-MHV3 | 0·40 ± 0·18 | 2·63 ± 0·61** | 3·97 ± 0·61** | |
| 51·6-MHV3 | 0·92 ± 0·69 | 3·01 ± 0·25*** | 1·73 ± 0·48 | |
| CL12-MHV3 | 0·61 ± 0·11 | 1·25 ± 0·10* | 1·73 ± 0·22 | |
| YAC-MHV3 | 0·62 ± 0·20 | 1·48 ± 0·18* | 2·04 ± 0·31 | |
P < 0·05
P < 0·01
P < 0·001.
Three mice were used in each experimental group. The ratios of percentages of NK and NK T cells from MHV3-infected mice were compared with those from mock-infected mice.
On the other hand, intrahepatic NK/NK T cell ratios of the apoptotic cell population (G2 region) increased strongly in L2-MHV3-infected mice from 48 h to 72 h p.i. (P < 0·01 for both times). This phenomenon was also observed in the livers from 51·6-MHV3-infected mice but only at 48 h p.i. (P < 0·001). Furthermore, these NK/NK T cell ratios were less increased in the livers from CL12-MHV3- and YAC-MHV3-infected mice at 48 h p.i. (P < 0·05 for both viruses) (Table 2).
Permissivity of NK and NK T cells to viral infection by the pathogenic L2-MHV3, low attenuated 51·6-MHV3, highly attenuated CL12-MHV3 and non-pathogenic YAC-MHV3 viruses
In order to verify if the apoptosis of NK and NK T cells is related to the viral replication of the different MHV3variants, intrahepatic MNCs were collected from uninfected mice, infected in vitro (m.o.i. of 0·1–1·0) during 48 h and then phenotyped using polyclonal anti-MHV3 anti-sera with anti-DX5 (NK cells) or CD1d:Ig (NK T cells) antibodies. The DX5+ MHV3+ and CD1d:Ig+ MHV3+ cells were compared with mock-infected cells in the entire DX5+ or CD1d:Ig+ cell populations.
As shown in Fig. 5, higher percentages of DX5+ cells were infected with the attenuated 51·6-MHV3 and CL12-MHV3 variants when compared with non-pathogenic YAC-MHV3 and pathogenic L2-MHV3 viruses (Fig. 5a–d). On the other hand, the percentages of NK T cells phenotyped with CD1d:Ig fusion protein, expressing viral proteins following infection with the 51·6-MHV3 and CL12-MHV3 variants, were higher than those infected with the L2-MHV3 and YAC-MHV3 viruses (Fig. 5e–h).
Fig. 5.
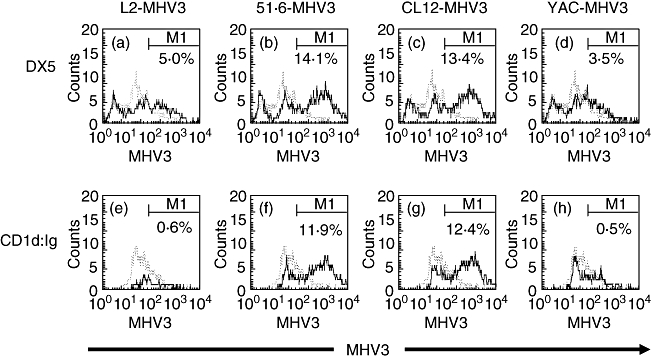
Expression of mouse hepatitis virus type 3 (MHV3) proteins in the intrahepatic DX5+ (a–d) cells and CD1d:Ig+ (e–h) cell population infected in vitro with the L2-MHV3 (a, e), 51·6-MHV3 (b, f), CL12-MHV3 (c, g) and YAC-MHV3 (d, h) viruses. The cells were analysed using a fluorescence activated cell sorter (FACScan) flow cytometer. A total of 10 000 events were recorded. The DX5+ MHV3+ and CD1d:Ig+ MHV3+ cells from virally infected cells (—) were compared with mock-infected cells (– – –) in the entire DX5+ or CD1d:Ig+ cell population.
Discussion
In the present study, fulminant hepatitis induced by the pathogenic L2-MHV3 virus is associated with a decrease in the production of intrahepatic IL-10, TGF-β, PGE2, a decrease in the IFN-γ/IL-4 ratio and an increase in the percentages of apoptotic NK and NK T cells. KC and LSEC, which are target cells for pathogenic L2-MHV3 (KC+, LSEC+) virus, are involved in a higher decrease of immunosuppressive cytokines, whereas KC also play a role in NK/NK T disorders during the acute viral hepatitis. Indeed, the highly attenuated CL12-MHV3 (KC−, LSEC−) viral variant had a lower impact on suppressive cytokines and apoptosis of NK or NK T cells when compared with the low attenuated 51·6-MHV3 (KC+, LSEC−) variant.
The use of MHV3 variants which possess different cell tropisms is an efficient system to dissect the in vivo and in vitro roles for LSEC, KC and Treg cells in the establishment of intrahepatic disorders, resulting from altered immune tolerance and the activation of natural immune responses sustained by NK and NK T cells. The results shown in this study have been summarized in Table 3.
Table 3.
Summary of immunological observations in livers from C57BL/6 mice infected with pathogenic L2-mouse hepatitis virus type 3 (MHV3), low attenuated 51·6-MHV3, highly attenuated CL12-MHV3 and non-pathogenic YAC-MHV3 viruses.
| L2-MHV3* | 51·6-MHV3 | CL12-MHV3 | YAC-MHV3 | |
|---|---|---|---|---|
| % Normal NK cells | ↑† | ↑ | – | – |
| % Normal NK T cells | ↑ | ↑ | ↓↑ | ↓↑ |
| % Normal T cells | ↑ | ↑ | – | ↑↑ |
| Normal NK/NK T ratio | ↑ | ↑↑ | ↑ | – |
| % Apoptotic NK cells | ↑ | ↑↑ | – | – |
| % Apoptotic NK T cells | ↑ | ↓↑ | ↓ | ↓ |
| % Apoptotic T cells | ↓ | ↓ | ↓↑ | ↓↑ |
| Apoptotic NK/NK T ratio | ↑↑ | ↑ | ↑ | ↑ |
| CD4+ FoxP3+ cells | ↑ | – | – | – |
| IL-10 | ↓ | ↑ | ↑ | ↑↑ |
| TGF-β | – | ↑ | ↑ | ↑ |
| PGE2 | – | ↑↑ | ↑↑ | ↑↑ |
| IFN-γ | ↓↓ | ↓↑ | ↓↑ | ↓↑ |
| IL-4 | ↓ | ↑↑ | ↓↑ | – |
| IFN-γ/IL-4 ratio | ↑↓ | – | ↓↑ | ↓↑ |
Three mice were used in each experimental group.
↑, increase; ↓, decrease; ↑↓ or ↓↑, variation during infection; –, similar to mock-infected mice. NK, natural killer; IL, interleukin; TGF, transforming growth factor; PGE2, prostaglandin E2; IFN, interferon; FoxP3, forkhead box P3.
The integrity of hepatic immunocompetent cells such as KC and LSEC is required to preserve the immune tolerance characteristic of the liver. These cells are responsible for the production of immunosuppressive cytokines such as IL-10, TGF-β and PGE2. Our results indicate that all the suppressive cytokines tested in this study either decreased or were not induced further in the livers from mice infected with the L2-MHV3 virus. The absence of TGF-β, IL-10 and PGE2 in livers from pathogenic L2-MHV3-infected mice may favour a switch from a tolerance to an inflammatory state. Infections with attenuated variants of MHV3, however, induced higher levels of immunosuppressive cytokines or delayed production of the latter. It has been demonstrated previously that the attenuation levels of virus variants reflect their inability to infect LSEC (51·6-MHV3) or LSEC and KC (CL12-MHV3) [25], suggesting that their mild virulent phenotype may depend upon the integrity of LSEC and KC cells and their role in the control of liver inflammation through the production of immunosuppressive cytokines. In addition, the lower disturbance in immunosuppressive cytokines induced by the higher attenuated CL12-MHV3 variant when compared with the low attenuated 51·6-MHV3 variant indicates that the integrity of KC cells is more important than that of LSEC in the control of inflammatory responses during acute viral hepatitis. Importantly, LSEC cells may also produce immunosuppressive cytokines, thus contributing to the reduction of the inflammatory response and concomitant pathology, as observed in livers from 51·6-MHV3-infected mice (KC+, LSEC−) when compared with mice infected with the pathogenic L2-MHV3 (KC+, LSEC+) virus.
The sources of the immunosuppressive cytokines were associated not only with LSEC and/or KC but also to Treg cells. Indeed, the percentages of intrahepatic FoxP3+ cells in the CD4+ cell population increased slightly in liver from pathogenic L2-MHV3-infected mice only. However, the decrease in immunosuppressive cytokines suggests that Treg cells may be rendered anergic or unresponsive during the first days of infection.
It is also known that IL-10 and TGF-β determine the levels of IFN-γ inhibition [33], suggesting that a decrease in IL-10 and TGF-β may favour the increase of IFN-γ and a subsequent inflammatory response. However, IFN-γ levels did not increase in livers from pathogenic L2-MHV3-infected mice. On the other hand, the level of the immunosuppressive cytokines IL-10, TGF-β and PGE2 increased in livers from all groups of mice infected with the attenuated MHV3 variants in accordance with their pathogenic levels and times p.i. The inhibitory effects of IL-10 and TGF-β on IFN-γ may not be completely consequent to the lower production of IFN-γ during the first 2 days of infection, as a significant increase in IFN-γ production was noted at 72 h p.i., a time-point at which IL-10 and TGF-β increased in livers from all attenuated MHV3-infected mice.
The use of attenuated viral variants which have lost their ability to replicate in LSEC and/or KC cells involved in the control of liver tolerance allowed us to evaluate the role for these cells in viral acute hepatitis. We have demonstrated previously that viral replication cannot explain the levels of hepatitis, as similar viral titres were found in livers from mice infected with pathogenic L2-MHV3, low attenuated 51·6-MHV3, highly attenuated CL12-MHV3 or non-pathogenic YAC-MHV3 viruses [26,27]. Viral pathogenicity correlates more with the time of appearance of virus titres in liver than the level of viral titres [26]. These observations support the hypothesis that the pathogenicity of the viral variants reflects their ability to trigger the inflammatory response rather than their capacity to replicate. As expected, macroscopic evaluation of livers from MHV3-infected mice correlated with the levels of hepatitis described by Martin et al. [25]. Previous histopathological studies have shown that the pathogenic L2-MHV3 virus induces extensive necrotic foci in liver, whereas few perivascular inflammatory foci are observed transiently in mice infected with the non-pathogenic YAC-MHV3 variant [23]. Histopathological studies have revealed dramatic effects in L2-MHV3-infected mice for which hepatocellular necrosis in the presence of inflammatory cells was evident in the presence of high transaminase activity in serum [26,34]. Moderate liver necrosis and infiltration of inflammatory cells, however, were seen in both 51·6-MHV3- and CL12-MHV3-infected mice in which low and no transaminase activity was detected. Thus, the histopathological features of viral infection by the viral variants reflect the levels of immunosuppressive cytokines, such as IL-10 and PGE2, rather than inflammatory cytokines such as IFN-γ.
It is tempting to suggest that the delayed production of PGE2 by LSEC may result in the onset of the acute hepatitis observed in our study. It has been shown that administration of PGE2 to susceptible Balb/c mice protects them against the intravascular coagulation induced during MHV3 infection [35]. PGE2 production was higher in livers from mice infected with non-pathogenic YAC-MHV3 and highly attenuated CL12-MHV3 viruses. The level of PGE2 remained higher in livers from lower attenuated 51·6-MHV3-infected mice than in L2-MHV3-infected mice. These observations not only confirm the protective role for PGE2 during acute viral hepatitis, but also suggest that the permissiveness of LSEC cells to viral infection may play a major role in the production of PGE2 during acute hepatitis.
The loss of KC and/or LSEC because of replication of pathogenic L2-MHV3 virus cannot explain the decrease in IFN-γ production. NK cells are generally major sources of IFN-γ during the early stages of infection, and NK T cells may contribute to this effector response in certain cases [5,6,14,15]. Intrahepatic NK1·1 cells increased in mice infected with the pathogenic L2-MHV3 and low attenuated 51·6-MHV3 viruses. Notwithstanding the recruitment of NK1·1 cells, the levels of IFN-γ decreased in the liver of L2-MHV3- (24 h to 72 h p.i.) and 51·6-MHV3-infected mice (24 h to 48 h p.i.). These observations reflect the high levels of apoptosis observed in intrahepatic recruited NK1·1 cells in the liver from these infected mice, as NK1·1 cells were not or less recruited in the liver during infections with the highly attenuated CL12-MHV3 and non-pathogenic YAC-MHV3 viruses and did not become apoptotic.
Many studies have suggested negative roles for NK T cells in the development of aggressive hepatitis induced by ConA or α-GalCer [17,18]. This observation was supported by a NK T cell-dependent increased production of IL-4. Production of intrahepatic IL-4 was impaired in pathogenic L2-MHV3-infected mice in contrast to attenuated 51·6-MHV3- and CL12-MHV3-infected mice. Moreover, no increase in intrahepatic NK T cells or their apoptosis was observed during infection with the highly attenuated CL12-MHV3 and non-pathogenic YAC-MHV3 variants, in contrast with L2-MHV3 or 51·6-MHV3 infections.
The decrease of intrahepatic IFN-γ and IL-4 production thus may be explained partially by the apoptosis of the NK and NK T cells because of their permissivity to viral replication. We have demonstrated recently that myeloid NK cells are susceptible to viral replication and apoptosis via the formation of syncytium [28]. However, the low percentages of L2-MHV3-infected DX5+MHV3+ and CD1d:Ig+MHV3+ cells were surprising, and may reflect the lower number of viable DX5+ and CD1d:Ig+ cells when infected with this virus. On the contrary, the low percentages of YAC-MHV3-infected NK and NK T cells explain the higher numbers of viable NK or NK T cells, as this virus did not infect these cells adequately. It was demonstrated that the non-pathogenic YAC-MHV3 variant has limited cell tropisms when compared with the pathogenic L2-MHV3 virus [23,25,34].
The imbalance between inflammatory and immunosuppressive cytokines may influence intrahepatic lymphoid cell subpopulations. Our previous studies have shown that immunodeficiencies in B and T cells are induced after 72 h p.i. in pathogenic L2-MHV3-infected C57BL/6 mice but not in non-pathogenic YAC-MHV3-infected mice [34]. Also, we have also demonstrated that the attenuated 51·6-MHV3 and CL12-MHV3 variants induce lower immunodeficiencies in B and T cells in accordance with their levels of pathogenicity [26]. It is well known that IL-10 and PGE2 are important to reduce the activation of antigen-specific CD4+ and CD8+ T cells recruited in the liver [2,3]. TGF-β is a cytokine secreted by LSEC and KC involved in the suppression of T cell proliferation [33]. Indeed, decreased levels of these cytokines can lead to overwhelming T cell activation. In addition, intrahepatic IL-10 and TGF-β may also be secreted by type 1 regulatory or T helper 3 cells, respectively, inhibiting cellular activation [7].
In conclusion, our results suggest that acute hepatitis induced by the pathogenic L2-MHV3 virus is related to a decreased production in immunosuppressive cytokines produced mainly by KC and LSEC and by the apoptosis of intrahepatic recruited NK and NK T cells. Lower levels of hepatitis reflect the KC and LSEC tropisms of attenuated MHV3 variants. The results obtained in this work suggest that innate lymphoid cells, such as NK and NK T cells, may also play a role in the onset of acute hepatitis, as they may be disturbed in acute hepatitis and their imbalance may lead to an abnormal inflammatory responses.
Further work is in progress to demonstrate the effect of viral replication of variants in in vitro-purified LSEC and KC, and on NK cells on the production of PGE2, IL-10 and TGF-β involved in immune hepatic tolerance and on anti-viral and inflammatory IFN-γ production. Considering these facts, in vivo studies will be conducted to assess the effect of repletion with recombinant cytokines on immune disorders induced during acute hepatitis.
Acknowledgments
This work was supported by a grant from NSERC-Canada. The authors thank Dr T. Scorza and Dr K. Rashidan for revising this manuscript. A. J. was supported by a NSERC fellowship.
References
- 1.Kimura K, Kakimi K, Wieland S, Guidotti LG, Chisari FV. Activated intrahepatic antigen-presenting cells inhibit hepatitis B virus replication in the liver of transgenic mice. J Immunol. 2002;169:5188–95. doi: 10.4049/jimmunol.169.9.5188. [DOI] [PubMed] [Google Scholar]
- 2.Uhrig A, Banafsche R, Kremer M, et al. Development and functional consequences of LPS tolerance in sinusoidal endothelial cells of the liver. J Leukoc Biol. 2005;77:626–33. doi: 10.1189/jlb.0604332. [DOI] [PubMed] [Google Scholar]
- 3.Knolle PA, Uhrig A, Hegenbarth S, et al. IL-10 down-regulates T cell activation by antigen-presenting liver sinusoidal endothelial cells through decreased antigen uptake via the mannose receptor and lowered surface expression of accessory molecules. Clin Exp Immunol. 1998;114:427–33. doi: 10.1046/j.1365-2249.1998.00713.x. [DOI] [PMC free article] [PubMed] [Google Scholar]
- 4.Bissel DM, Wang SS, Jarnagin WR, Roll FJ. Cell-specific expression of transforming growth factor-beta in rat liver. Evidence for autocrine regulation of hepatocyte proliferation. J Clin Invest. 1995;96:447–55. doi: 10.1172/JCI118055. [DOI] [PMC free article] [PubMed] [Google Scholar]
- 5.Hammond KJ, Pelikan SB, Crowe NY, et al. NK-T cells are phenotypically and functionnaly diverse. Eur J Immunol. 1999;29:3768–81. doi: 10.1002/(SICI)1521-4141(199911)29:11<3768::AID-IMMU3768>3.0.CO;2-G. [DOI] [PubMed] [Google Scholar]
- 6.Gansuvd B, Hagihara M, Yu Y, Inoue H, Ueda Y, Tsuchiya T, et al. Human umbilical cord blood NK T cells kill tumors by multiple cytotoxic mechanisms. Hum Immunol. 2002;63:164–75. doi: 10.1016/s0198-8859(01)00382-2. [DOI] [PubMed] [Google Scholar]
- 7.Jonuleit H, Schmitt E, Kakirman H, Stassen M, Knop J, Enk AH. Infectious tolerance: human CD25(+) regulatory T cells convey suppressor activity to conventional CD4(+) T helper cells. J Exp Med. 2002;196:255–60. doi: 10.1084/jem.20020394. [DOI] [PMC free article] [PubMed] [Google Scholar]
- 8.Bolacchi F, Sinistro A, Ciaprini C, et al. Increased hepatitis C virus (HCV)-specific CD4+CD25+ regulatory T lymphocytes and reduced HCV-specific CD4+ T cell response in HCV-infected patients with normal versus abnormal alanine aminotransferase levels. Clin Exp Immunol. 2006;144:188–96. doi: 10.1111/j.1365-2249.2006.03048.x. [DOI] [PMC free article] [PubMed] [Google Scholar]
- 9.MacDonald HR. Development and selection of NK-T cells. Curr Opin Immunol. 2002;14:250–4. doi: 10.1016/s0952-7915(02)00329-1. [DOI] [PubMed] [Google Scholar]
- 10.Mallevaey T, Fontaine J, Breuilh L, et al. Invariant and noninvariant natural killer T cells exert opposite regulatory functions on the immune response during murine schistosomiasis. Infect Immun. 2007;75:2171–80. doi: 10.1128/IAI.01178-06. [DOI] [PMC free article] [PubMed] [Google Scholar]
- 11.Giroux M, Denis F. CD1d-unrestricted human NK-T cells release chemokines upon Fas engagement. Blood. 2005;105:703–10. doi: 10.1182/blood-2004-04-1537. [DOI] [PubMed] [Google Scholar]
- 12.Kimura K, Kakimi K, Wieland S, Guidotti LG, Chisari FV. Interleukin-18 inhibits hepatitis B virus replication in the livers of transgenic mice. J Virol. 2002;76:10702–7. doi: 10.1128/JVI.76.21.10702-10707.2002. [DOI] [PMC free article] [PubMed] [Google Scholar]
- 13.Guidotti LG, Chisari FV. Non cytolytic control of viral infections by the innate and adaptative immune response. Annu Rev Immunol. 2001;19:65–91. doi: 10.1146/annurev.immunol.19.1.65. [DOI] [PubMed] [Google Scholar]
- 14.Seki S, Osada S, Ono S, et al. Role of liver NK cells and peritoneal macrophages in gamma interferon and interleukin-10 production in experimental bacterial peritonitis in mice. Infect Immun. 1998;66:5286–94. doi: 10.1128/iai.66.11.5286-5294.1998. [DOI] [PMC free article] [PubMed] [Google Scholar]
- 15.Roland J, Soulard V, Sellier C, et al. NK cell responses to Plasmodium infection and control of intrahepatic parasite development. J Immunol. 2006;177:1229–39. doi: 10.4049/jimmunol.177.2.1229. [DOI] [PubMed] [Google Scholar]
- 16.Exley MA, He Q, Cheng O, et al. Cutting edge: compartmentalization of Th1-like noninvariant CD1d-reactive T cells in hepatitis C virus-infected liver. J Immunol. 2002;168:1519–23. doi: 10.4049/jimmunol.168.4.1519. [DOI] [PubMed] [Google Scholar]
- 17.Ajuebor MN, Aspinall AI, Zhou F, et al. Lack of chemokine receptor CCR5 promotes murine fulminant liver failure by preventing the apoptosis of activated CD1d-restricted NK-T cells. J Immunol. 2005;174:8027–37. doi: 10.4049/jimmunol.174.12.8027. [DOI] [PubMed] [Google Scholar]
- 18.Biburger M, Tiegs G. Alpha-galactosylceramide-induced liver injury in mice is mediated by TNF-alpha but independent of Kupffer cells. J Immunol. 2005;175:1540–50. doi: 10.4049/jimmunol.175.3.1540. [DOI] [PubMed] [Google Scholar]
- 19.Paladino N, Flores AC, Marcos CY, et al. Increased frequencies of activating natural killer receptors are associated with liver injury in individuals who do not eliminate hepatitis C virus. Tissue Antigens. 2007;69:109–11. doi: 10.1111/j.1399-0039.2006.762_7.x. [DOI] [PubMed] [Google Scholar]
- 20.Simon AK, Jones E, Richards H, et al. Regulatory cells inhibit Fas-ligand induced innate and adaptative tumor immunity. Eur J Immunol. 2007;37:758–67. doi: 10.1002/eji.200636593. [DOI] [PMC free article] [PubMed] [Google Scholar]
- 21.Ralainirina N, Poli A, Michel T, et al. Control of NK cell functions by CD4+CD25+ regulatory cells. Immunology. 2007;120:73–82. doi: 10.1189/jlb.0606409. [DOI] [PubMed] [Google Scholar]
- 22.Brillard E, Pallandre JR, Chalmers D, et al. Natural killer cells prevent CD28-mediated FoxP3 transcription in CD4+CD25- T lymphocytes. Exp Hematol. 2007;35:416–25. doi: 10.1016/j.exphem.2006.12.004. [DOI] [PubMed] [Google Scholar]
- 23.Le Prevost C, Levy-Leblond E, Virelizier JL, Dupuy JM. Immunopathology of mouse hepatitis virus type 3 infection. I. Role of humoral and cell-mediated immunity in resistance mechanism. J Immunol. 1975;114:221–5. [PubMed] [Google Scholar]
- 24.Dupuy JM, Levy-Leblond E, Le Prevost C. Immunopathology of mouse hepatitis virus type 3 infection. II. Effect of immunosuppression in resistant mice. J Immunol. 1975;114:226–30. [PubMed] [Google Scholar]
- 25.Martin JP, Chen W, Koehren F, Pereira CA. The virulence of mouse hepatitis virus 3, as evidenced by permissivity of cultured hepatic cells toward escaped mutants. Res Virol. 1994;145:297–302. doi: 10.1016/S0923-2516(07)80034-3. [DOI] [PMC free article] [PubMed] [Google Scholar]
- 26.Lamontagne L, Page C, Braunwald J, Martin JP. Pathogenicity of neutralization escape mutants of mouse hepatitis virus: correlation with T- and B-cell depletions. Res Immunol. 1994;145:553–65. doi: 10.1016/S0923-2494(94)80073-1. [DOI] [PMC free article] [PubMed] [Google Scholar]
- 27.Lamontagne L, Dupuy JM. Persistent infection with mouse hepatitis virus 3 in mouse lymphoid cell lines. Infect Immunol. 1984;44:716–23. doi: 10.1128/iai.44.3.716-723.1984. [DOI] [PMC free article] [PubMed] [Google Scholar]
- 28.Lehoux M, Jacques A, Lusignan S, Lamontagne L. Murine viral hepatitis involves NK cell depletion associated with virus-induced apoptosis. Clin Exp Immunol. 2004;137:41–51. doi: 10.1111/j.1365-2249.2004.02501.x. [DOI] [PMC free article] [PubMed] [Google Scholar]
- 29.Stohlman SA, Brayton PR, Harmon RC, Stevenson D, Ganges RG, Matsushima GK. Natural killer cell activity during mouse hepatitis virus infection: response in the absence of interferon. Int J Cancer. 1983;31:309–14. doi: 10.1002/ijc.2910310310. [DOI] [PubMed] [Google Scholar]
- 30.Dupuy JM, Rodrigue D. Heterogeneity in evolutive patterns of inbred mice infected with a cloned substrain of mouse hepatitis virus type 3. Intervirology. 1981;16:114–17. doi: 10.1159/000149255. [DOI] [PubMed] [Google Scholar]
- 31.Watanabe H, Ohtsuka K, Kimura M, et al. Details of an isolation method for hepatic lymphocytes in mice. J Immunol. 1992;146:145–54. doi: 10.1016/0022-1759(92)90223-g. [DOI] [PubMed] [Google Scholar]
- 32.Lamontagne L, Massicotte E, Page C. Mouse hepatitis viral infection induces and extrathymic differentiation of the specific intrahepatic alpha beta-TCRintermediate LFA-1high T-cell population. Immunology. 1997;90:402–10. doi: 10.1111/j.1365-2567.1997.00402.x. [DOI] [PMC free article] [PubMed] [Google Scholar]
- 33.Schröder M, Meisel C, Buhl K, et al. Different modes of IL-10 and TGF-β to inhibit cytokine-dependent IFN-γ production: consequences for reversal of lipopolysaccharide desensitization. J Immunol. 2003;170:5260–7. doi: 10.4049/jimmunol.170.10.5260. [DOI] [PubMed] [Google Scholar]
- 34.Lamontagne L, Descoteaux JP, Jolicoeur P. Mouse hepatitis virus 3 replication in T and B lymphocytes correlate with viral pathogenicity. J Immunol. 1989;142:4458–65. [PubMed] [Google Scholar]
- 35.Abecassis M, Falk J, Dindzans V, et al. Prostaglandin E2 prevents fulminant hepatitis and the induction of procoagulant activity in susceptible animals. Transplant Proc. 1987;19:1103–5. [PubMed] [Google Scholar]