

Abstract
We investigated the mechanism of action of LBH589, a novel broad-spectrum HDAC inhibitor belonging to the hydroxamate class, in Philadelphia chromosome–negative (Ph−) acute lymphoblastic leukemia (ALL). Two model human Ph− ALL cell lines (T-cell MOLT-4 and pre–B-cell Reh) were treated with LBH589 and evaluated for biologic and gene expression responses. Low nanomolar concentrations (IC50: 5-20 nM) of LBH589 induced cell-cycle arrest, apoptosis, and histone (H3K9 and H4K8) hyperacetylation. LBH589 treatment increased mRNA levels of proapoptosis, growth arrest, and DNA damage repair genes including FANCG, FOXO3A, GADD45A, GADD45B, and GADD45G. The most dramatically expressed gene (up to 45-fold induction) observed after treatment with LBH589 is GADD45G. LBH589 treatment was associated with increased histone acetylation at the GADD45G promoter and phosphorylation of histone H2A.X. Furthermore, treatment with LBH589 was active against cultured primary Ph− ALL cells, including those from a relapsed patient, inducing loss of cell viability (up to 70%) and induction of GADD45G mRNA expression (up to 35-fold). Thus, LBH589 possesses potent growth inhibitory activity against including Ph− ALL cells associated with up-regulation of genes critical for DNA damage response and growth arrest. These findings provide a rationale for exploring the clinical activity of LBH589 in the treatment of patients with Ph− ALL.
Introduction
Histone deacetylases (HDACs) are responsible for deacetylating histones and nonhistone proteins, thus regulating gene transcription, protein function, and stability.1,2 Aberrant recruitment of HDACs has been shown to have an important role in leukemogenesis, and alterations in the expression and/or activity of HDACs have been also observed in solid tumors.3–5 HDAC inhibitors have been widely studied, clinical trials with several of these have started, and HDAC inhibitor-responsive tumors have been observed.6–9 Clinical benefits of HDAC inhibitors may result from re-expressing and/or reactivating tumor suppressor genes and/or proteins, thereby inducing apoptosis, cell-cycle arrest, and differentiation.6–9
In most cases of acute lymphoblastic leukemia (ALL), chromosomal abnormalities are found such as the gain or loss of whole chromosomes, but more often, translocations, deletions, or inversions occur.10–12 Epigenetic alterations, including aberrant DNA methylation of promoter-associated CpG islands resulting in gene silencing, have been frequently observed in ALL both at presentation and at relapse.13,14 There is a need for new agents with efficacy in Ph− ALL, especially for patients who relapse where the treatment options are limited.15–18 Treatment of ALL cells with an HDAC inhibitor offers an appealing strategy, potentially promoting, in the resistant lymphoblasts, reactivation of genes responding to genomic instability and therefore elimination of the affected cells.
In this study, we evaluated the antitumor efficacy and mechanism of action of LBH589, an HDAC inhibitor belonging to the hydroxamate class, in Philadelphia chromosome–negative (Ph−) ALL cells. Two Ph− ALL cell lines (T-cell MOLT-4 and pre–B-cell Reh) were treated with LBH589. Our results show that LBH589, at clinically safe concentrations (approximately 10-50 nM), induces potent cell growth inhibition, cell-cycle arrest, and apoptosis in a time- and dose-dependent manner in both cell lines. We further show that the antitumor activities of LBH589 correlate with induction of histone (H3K9 and H4K8) hyperacetylation, activation of p21 and p27, and suppression of c-Myc in the 2 cell lines treated. Using polymerase chain reaction (PCR) arrays, we determined the effects of LBH589 on the expression of DNA damage and apoptosis genes. LBH589 treatment induced significant increases in mRNA levels of a number of genes with proapoptosis, growth arrest, and DNA repair functions. Some of these genes have been previously reported to be epigenetically down-regulated in human malignancies such as GADD45G.19 Furthermore, we demonstrate that LBH589 response correlates with induction of histone H2A.X phosphorylation. Importantly, LBH589 also induces apoptosis and elevated GADD45G expression in cultured primary human Ph− ALL cells. Thus, LBH589 represents a potential therapy for Ph− ALL patients, promoting the reactivation of DNA repair and other genes that suppress the growth of tumor cells.
Methods
Cell lines and cell culture conditions
Human Ph− acute lymphoblastic leukemia MOLT-4 (T cells) and Reh (pre-B cells) cell lines were obtained from ATCC (Manassas, VA). Cells were maintained in culture in RPMI-1640 medium containing 10% bovine growth serum and 50 units/mL penicillin and streptomycin at 37°C in a humidified atmosphere of 5% CO2 and passaged twice a week.
Primary Ph− ALL cells
Blasts from peripheral blood of 2 patients and from bone marrow of 4 patients were isolated with Ficoll-Hypaque, put in culture at a density of 500 000 cells/mL with RPMI-1640 medium containing 10% fetal bovine serum and 50 units/mL penicillin and streptomycin, and treated with different doses of LBH589 for up to 48 hours. All patients had given informed consent in accordance with the Declaration of Helsinki for sample acquisition as a part of a protocol approved by the City of Hope National Medical Center Institutional Review Board.
Drug treatments
LBH589 was provided by Novartis Pharmaceuticals (East Hanover, NJ) and prepared as a 5-mM stock in DMSO and stored at −80°C. Cells at a density of 250 000 cells/mL were exposed to the indicated concentrations of LBH589. Following these treatments, cells were pelleted and washed free of the drug prior to the performance of experiments.
Flow cytometry for cell-cycle analysis
Cells were harvested, washed twice with PBS, and fixed in 70% ethanol at −20°C. Cells were then washed twice with PBS and treated with 100 μg/mL RNase A and 100 μg/mL propidium iodide. Cell-cycle phase distributions of cells were analyzed with a MoFlo MLS sorter (Dako, Fort Collins, CO). At least 50 000 cells were collected and experiments were repeated 3 times. The cell-cycle profiles and sub-G1 apoptotic population of cells were determined using the Summit software (Dako).
Cell proliferation assays
Cells were seeded in 96-well plates at a density of 10 000 cells/well. After 24, 48, and 72 hours, cell viability was determined using the MTS (3-(4,5-dimethylthiazol-2-yl)-5-(3-carboxymethoxyphenyl)-2-(4-sulfophenyl)-2H-tetrazolium, inner salt) assay (Promega, Madison, WI). The MTS assay was performed according to instructions from the supplier. Absorbance was measured at 490 nm with a Chameleon plate reader (Bioscan, Washington, DC). Experiments were repeated 3 times.
Apoptosis and loss of cell viability assessment by annexin V/PI staining
Untreated and drug-treated cells were stained with annexin V and propidium iodide using annexin V–FITC Apoptosis Detection Kit I (BD Biosciences Pharmingen, San Diego, CA). The percentage of apoptotic and nonviable cells was determined by flow cytometry. At least 50 000 cells were collected with a CyAn ADP Violet (Dako) cytometer and calculated using the Summit software (Dako). Percentage apoptosis was calculated considering all the annexin V–positive plus the annexin V/PI-positive cells; percentage loss of cell viability was calculated considering all the annexin V–positive plus the PI-positive and the annexinV/PI-positive cells.
Western blotting
Cells were washed with ice-cold PBS containing 0.1 mM sodium orthovanadate, and total proteins were isolated using RIPA lysis buffer, which included protease inhibitors (leupeptin, antipain, and aprotinin), 0.5 mM PMSF, and 0.2 mM sodium orthovanadate. Protein amounts were quantified using the Bio-Rad protein assay (Bio-Rad Laboratories, Hercules, CA). Equal amounts of proteins were loaded onto an sodium dodecyl sulfate–polyacrylamide gel electrophoresis (SDS-PAGE) gel, transferred onto nitrocellulose membrane, and probed with the antibody of interest: mouse monoclonal c-Myc and mouse monoclonal p21 antibodies (Santa Cruz Biotechnology, Santa Cruz, CA); rabbit polyclonal phospho-Histone H2A.X (Ser139), rabbit polyclonal acetyl-Histone H3 (Lys9), and rabbit polyclonal acetyl-Histone H4 (Lys8) antibodies (Cell Signaling Technology, Danvers, MA); mouse monoclonal p27/KIP1 antibody (Biosource, Camarillo, CA); mouse monoclonal anti–β-actin (Sigma-Aldrich, St Louis, MO); and mouse monoclonal anti-GADD45G (Novus Biologicals, Littleton, CO). Membranes were then washed, reprobed with appropriate horseradish peroxidase–conjugated secondary antibodies (GE Healthcare, Little Chalfont, United Kingdom), and developed with SuperSignal chemiluminescent substrate (Pierce Biotechnology, Rockford, IL).
RNA isolation and cDNA synthesis
Total RNA was isolated from samples by Trizol Reagent (Invitrogen, Carlsbad, CA), treated with DNase I and purified with the RNeasy MinElute Cleanup Kit (Qiagen, Valencia, CA). After checking the purification and quality, RNA was reverse-transcribed into cDNA using the Omniscript Reverse Transcription Kit (Qiagen).
Quantitative real-time PCR array
cDNA transcribed from 100 to 1000 ng RNA was loaded per array to assess the expression of 84 genes included in the DNA Damage panel and 84 genes included in the Apoptosis panel (SuperArray Bioscience, Frederick, MD). Each PCR array reaction was carried out in a 25-μL final volume per well containing 1× RT Real-Time SYBR Green/Rox PCR Master Mix (SuperArray Bioscience). Thermal cycling was performed in 96-well format plates (SuperArray Bioscience) with optical adhesive covers (Applied Biosystems, Foster City, CA) using an ABI Prism 7900HT Sequence Detection System (Applied Biosystems). All data were captured using the ABI Prism 7900HT Sequence Detector Software version 2.1 (Applied Biosystems). β-Actin expression was quantified using 10-fold serial dilutions of each cDNA sample. The standard curve included 6 points starting at 105 copies of cDNA down to 1 copy. The mRNA levels of each gene were normalized to the levels of β-actin mRNA.
Quantitative TaqMan real-time PCR
TaqMan real-time PCR was carried out in MicroAmp optical 384-well reaction plates (Applied Biosystems) by an ABI Prism 7900HT Sequence Detection System (Applied Biosystems) using TaqMan Universal PCR Master Mix (Applied Biosystems) and following standard “TaqMan” procedures. For quantification, target gene expression was normalized by comparison with β-actin expression. Thermal cycling was performed for each gene on cDNA samples in a 20-μL final volume containing 1× TaqMan Universal PCR Master Mix, 400 nM forward primer, 400 nM reverse primer, and 300 nM probe. The probe was dual labeled, at the 3′ terminus with a quencher (TAMRA) and at the 5′ terminus with a fluorogenic reporter dye (FAM). Primers and probes were designed using the Primer Express Software version 2.0 (Applied Biosystems) as follows: β-actin forward: 5′-CGAGCGCGGCTACAGCTT-3′; β-actin reverse: 5′-CCTTAATGTCACGCACGATT-3′; β-actin probe: 5′-ACCACCACGGCCGAGCGG-3′; BCL2 forward: 5′-CATGTGTGTGGAGAGCGTCAA-3′; BCL2 reverse: 5′-CAGAGACAGCCAGGAGAAATCA-3′; BCL2 probe: 5′-CTGGTGGACAACATCGCCCTGT-3′; FANCG forward: 5′-GCCAGGATACCAAAGCCTTACAG-3′; FANCG reverse: 5′-CCCTCCGATCTAGCCTCTTCA-3′; FANCG probe: 5′-ACTTCCTCCTCAGTGTGCAGATGTGCC-3′; FOXO3A forward: 5′-CGTGCCCTACTTCAAGGATAAGG-3′; FOXO3A reverse: 5′-TCGACTATGCAGTGACAGGTTGT-3′; FOXO3A probe: 5′-CGACAGCAACAGCTCTGCCGG-3′; GADD45A forward: 5′-TGAGTCAGCGCACGATCAC-3′; GADD45A reverse: 5′-GCAGGCACAACACCACGTTA-3′; GADD45A probe: 5′-TGTACGAAGCGGCCAAGCTGCTC-3′; GADD45G forward: 5′-GCCGGCGTCTACGAGTCA-3′; GADD45G reverse: 5′-CCAGCACACAGAAGGTCACATT-3′; GADD45G probe: 5′-CCAAAGTCTTGAACGTGGACCCCGA-3′; HuPO forward: 5′-TGGACAGCGTGGGTATCGA-3′; HuPO reverse: 5′-CTGGGCAATGACGTCTTCAA-3′; HuPO probe: 5′-CGGACGACGACCGGCTCAACA-3′.
All data were captured using ABI Prism 7900HT Sequence Detector Software version 2.1 (Applied Biosystems). β-Actin expression was quantified using 10-fold serial dilutions of standard cDNA cloned in pBluescript SK obtained from ATCC freshly prepared from a stock solution. The standard curve included 7 points starting at 107 copies of cDNA down to 102 copies. Each sample value from 3 independent experiments was determined in triplicate. The mRNA levels of each target gene were calculated and presented as mRNA copies of target gene/β-actin ratio.
Chromatin immunoprecipitation
Chromatin immunoprecipitation analysis was conducted as described by EZ-ChIP Chromatin Immunoprecipitation Kit from Upstate Biotechnologies (Temecula, CA). The chromatin was immunoprecipitated with normal rabbit IgG, anti–acetyl-histone H3, and anti–acetyl-histone H4 antibodies (Upstate, Lake Placid, NY). Ten percent of the supernatant fraction from the sheared cross-linked chromatin lacking primary antibody was saved as the “input.” DNAs were purified and used as the PCR templates to amplify the GADD45G promoter regions from −567 to +6 relative to the translation initiation site. The sequences of the primers were as follows: forward: 5′-TCTGGCTCCAATGCAACAGTCTCA-3′; reverse: 5′-AGTCATAGTGCGATCAACCAGCAG-3′. PCR products were separated on a 2% agarose gel, and then stained with ethidium bromide.
siRNA design and transfection
The 27mer dicer substrate GADD45G siRNA was designed using the City of Hope siRNA Site Selector/Duplex-End Energy Difference Calculator.20,21 Cy3-labeled GADD45G siRNA (sense, 5′-GCCUAGGCUAGGACGUUGGCCUCAG; antisense, 5′-CUGAGGCCAACGUCCUAGCCUAGGCCU) was synthesized in the City of Hope DNA/RNA synthesis laboratory. The Cy3-labeled dicer substrate negative control siRNA was obtained from IDT (Coralville, IA). Transient transfections of MOLT-4 and Reh cells were performed with the Nucleofector Kit L, program C-05 and the Nucleofector Kit L, program L-29, respectively (Amaxa Biosystems, Gaithersburg, MD). siRNA (200 nM) was used in each transfection with 2 million cells. Twenty-four hours after transfection, Cy3-positive cells were sorted with MoFlo MLS sorter (Beckman Coulter, Fort Collins, CO) and calculated with the software Summit version 4.3. The Cy3 label was excited by 514-nm laser and the signal was detected with a 600/30-nm bandpass filter.
Statistical analysis
The data are mean values of at least 3 independent experiments and expressed as means (± SD). Statistical analysis was performed by the Student t test, using statistical software GraphPad Prism 4 (San Diego, CA). Statistical significance was set at a level of P less than .05. Six patients were selected based on the criteria that this is a sufficient sample size to rule out lack of drug action if there is consistent drug activity demonstrated in all samples (P < .02). Mann-Whitney test was used to calculate the P value in Figure 7.
Figure 7.

LBH589 induces expression of GADD45G mRNA in cultured primary Ph− ALL cells. Following treatment with 50 nM LBH589 for 24 hours, TaqMan real-time PCR was performed on the cDNA from 6 patient samples. The mRNA levels were normalized to levels of β-actin mRNA and represented in log10 scale. Median value is indicated by the horizontal line in each bar. The boxes represent 25th percentiles and the whiskers represent 75th percentiles.
Results
LBH589 induces apoptosis of ALL cells
We investigated the effects of treatment with LBH589 on 2 human ALL (MOLT-4 and Reh) cell lines. Figure 1 shows that exposure to LBH589 induces apoptosis of both MOLT-4 and Reh cells in a time- and dose-dependent manner. The data indicate that LBH589 is more potent in MOLT-4 (Figure 1A) than in Reh cells (Figure 1B) for induction of apoptosis. Treatment of MOLT-4 cells with LBH589 starts to be detectably effective at 10 nM, inducing approximately 20%, 40%, and 50% apoptosis at 24, 48, and 72 hours, respectively. In Reh cells, treatment with LBH589 starts to be detectably effective at 20 nM, inducing 25% to 30% apoptosis at 48 to 72 hours. The maximum effect in MOLT-4 cells is at 20 nM LBH589 with 85% apoptosis at 72 hours, and in Reh cells the maximum effect is at 50 nM LBH589 with 80% apoptosis at 72 hours.
Figure 1.

LBH589 induces apoptosis of MOLT-4 and Reh cells. MOLT-4 cells (A) and Reh cells (B) were treated with indicated concentrations of LBH589 for 24, 48, and 72 hours. Following this, the percentage of apoptotic cells was determined by flow cytometry using annexin V/propidium iodide staining. Values represented as bar graphs are the means of 3 independent experiments plus the standard deviation.
LBH589 inhibits proliferation and cell-cycle progression in ALL cells
We determined the effects of LBH589 on cell proliferation and cell-cycle progression of MOLT-4 and Reh cells (Figures 2, 3). MTS assays showed that LBH589 markedly inhibits the growth of both MOLT-4 and Reh cells in a dose-dependent manner at 48 hours (Figure 2A,B). The data also indicate that LBH589 is more potent in MOLT-4 (Figure 2A) than in Reh cells (Figure 2B) for inhibiting cell proliferation. The 50% inhibitory concentration (IC50) value for inhibition of proliferation in MOLT-4 cells is approximately 5 nM and for Reh cells is approximately 20 nM. Similar results were observed at 24 and 72 hours (data not shown). Figure 3 shows flow cytometric analysis of MOLT-4 and Reh cells after 24-hour treatment with LBH589. The data demonstrate that LBH589 treatment caused a 2- to 3-fold increase in the number of cells in the G2/M phase of the cell cycle compared with the control cells (Figure 3A,B). This was associated with a concomitant decline in the percentages of treated cells in S phase (more pronounced in Reh cells than MOLT-4 cells) and also was accompanied by an increase in the subdiploid apoptotic population of cells in both lines (more pronounced in MOLT-4 than Reh cells).
Figure 2.

LBH589 inhibits proliferation of MOLT-4 and Reh cells. MOLT-4 cells (A) and Reh cells (B) were treated with indicated concentrations of LBH589 for 48 hours. Following this, the percentage of cell proliferation inhibition was determined by MTS assay. Values represented as graphs are the means of 3 independent experiments plus the standard deviation.
Figure 3.

LBH589 blocks cell-cycle progression of MOLT-4 and Reh cells. MOLT-4 cells (A) and Reh cells (B) were treated with indicated concentrations of LBH589 for 24 hours. Following this, cell-cycle phase distribution was determined by flow cytometry using propidium iodide staining. Results summarized in the bar graphs are representative of 3 independent experiments; the standard deviation was up to 10% (ie, 30% ± 3%).
LBH589 treatment results in histone (H3K9 and H4K8) hyperacetylation and regulation of cell-cycle control genes
Because LBH589 is an HDAC inhibitor and inhibits cell proliferation, we determined its effect on the acetylation of histone H3 and histone H4 as well as c-Myc, p21, and p27 expression levels (Figure 4A,B). Treatment of MOLT-4 cells for 24 hours with LBH589 was associated with induction of histone H3K9 and histone H4K8 acetylation as well as decreasing levels of c-Myc expression in a dose-dependent manner (Figure 4A). LBH589 treatment also increased the levels of p21 expression; however, the levels of p27 increased at low doses (10 nM) and then decreased at higher doses (20 and 50 nM). Treatment of Reh cells for 24 hours with LBH589 was associated with induction of histone H3K9 and histone H4K8 acetylation as well as induction of p21 and p27 expression in a dose-dependent manner (Figure 4B). LBH589 treatment also decreased the levels of c-Myc after an initial increase at the lowest dose (10 nM) in Reh cells.
Figure 4.

LBH589 induces hyperacetylation of histones H3K9 and H4K8, and modulates expression of cell-cycle control genes. Cells were treated with indicated concentrations of LBH589 for 24 hours. After this, Western blot analyses of acetylated histones H3K9 and H4K8, p21, p27, and c-Myc were performed on the cell lysates from MOLT-4 cells (A) and Reh cells (B). The levels of β-actin served as loading control. Results are representative of 3 independent experiments.
Apoptosis and DNA damage response genes are induced by LBH589
To investigate the effects of LBH589 on apoptosis and DNA damage response–related gene expression, we performed PCR arrays on MOLT-4 and Reh cells after 24-hour treatment with 50 nM LBH589. Results demonstrate that LBH589 induced substantial increases in mRNA levels of proapoptosis and DNA repair genes (Table 1). We next validated, with quantitative real-time PCR using specific primers and probes, the gene expression of GADD45A, GADD45B, GADD45G, FANCG, and FOXO3A. We confirmed that FANCG, FOXO3A, and GADD45A are expressed 3- to 10-fold more after LBH589 treatment in Reh cells (data not shown). Furthermore, GADD45B and GADD45G are more highly expressed after LBH589 treatment in both MOLT-4 and Reh cells. GADD45B is up-regulated approximately 6- and 10-fold in MOLT-4 and Reh cells, respectively (data not shown). Moreover, GADD45G is approximately 20- and 45-fold up-regulated in MOLT-4 and Reh cells, respectively (Figure 5A).
Table 1.
LBH589 up-regulates expression of apoptosis and DNA damage response–related genes
| MOLT-4 cells |
Reh cells |
||
|---|---|---|---|
| Function/gene | Log10 fold up-regulation | Gene | Log10 fold up-regulation |
| Apoptosis | |||
| TP73, CASP8 | 2.75-3 | CASP8,CASP10,CASP5 | 1.75-2 |
| FAS, CASP5 | 3-4.9 | TP73,GADD45A | 2-3.9 |
| DNA damage response | |||
| FANCG | 1.25-1.5 | TP73,CHEK2,GADD45G | 1.25-1.5 |
| GADD45A, RBBP8, TREX1, GADD45G, TP73 | 1.5-2.5 | BRCA1,FANCG,TREX1,RBBP8 | 1.5-4.25 |
Following treatment with 50 nM LBH589 for 24 hours, PCR array analysis was performed on MOLT-4 and Reh cells. The values represent the ratios of treated versus control cells relative gene expression, normalized to the levels of β-actin mRNA.
Figure 5.

LBH589 induces expression of GADD45G mRNA and enhances acetylation of histones at the GADD45G promoter in MOLT-4 and Reh cells. (A) Following treatment with 50 nM LBH589 for 24 hours, TaqMan real-time PCR was performed on MOLT-4 and Reh cells. The mRNA levels were normalized to levels of β-actin mRNA. Results summarized in the bar graphs are representative of 3 independent experiments plus the standard deviation. (B) Following treatment with 50 nM LBH589 for 24 hours, ChIP assay was performed on MOLT-4 and Reh cells. DNAs purified from the sheared cross-linked chromatin lacking primary antibody (INPUT) and immunoprecipitated with anti–acetyl-histone H3 or anti–acetyl-histone H4 antibodies were used as PCR templates to amplify the GADD45G promoter regions from −567 to +6. Results are representative of 3 independent experiments. (C) Cells were transfected with Cy3-labeled GADD45G siRNA or negative control siRNA, and 24 hours later Cy3-positive cells were sorted and treated with 50 nM LBH589. At 48 hours after treatment, the percentage of nonviable cells was determined by annexin V/PI staining and flow cytometry. Values represented as bar graphs are the means of 3 independent experiments plus the standard deviation. Asterisks indicate statistical significance (P < .05).
LBH589 induces increased levels of acetylated histone H3 and H4 at the GADD45G promoter
To investigate whether GADD45G transcriptional activation was associated with acetylation of histone H3 or H4 at the promoter, chromatin immunoprecipitation (ChIP) assays were performed with 50 nM LBH589-treated and untreated MOLT-4 and Reh cells using antibodies against acetylated histone H3 or H4. The immunoprecipitated DNAs were analyzed by PCR using GADD45G-specific primers. As shown in Figure 5B, LBH589 treatment for 24 hours increased histone H3 and H4 acetylation associated with the GADD45G promoter region from −567 to +6, which encompasses the stress-responsive sequences in the core promoter.19 These data indicate that LBH589 induces more histone acetylation at the GADD45G promoter in MOLT-4 cells than in Reh cells. We also investigated the effect of LBH589 treatment on the levels of GADD45γ protein, which is the product of the GADD45G gene. Treatment of MOLT-4 and Reh cells with LBH589 for 24 hours induces expression of GADD45γ protein at the lowest dose (10 nM; data not shown).
GADD45G siRNA transfection confers partial protection from LBH589
Given the substantial up-regulation of GADD45G mRNA levels after LBH589 treatment, we explored whether GADD45G was responsible for LBH589 response. Following transfection of GADD45G siRNA into MOLT-4 and Reh cells, we observed a significantly increased viability (P < .05) after LBH589 treatment compared with the treated cells transfected with the negative control (Figure 5C). The siRNA transfections resulted in approximately 20% and 40% protection from loss of viability due to LBH589 in MOLT-4 and Reh cells, respectively, compared with the cells transfected with the negative control, suggesting that GADD45G at least partially contributes to LBH589 response.
LBH589 treatment results in histone H2A.X phosphorylation
To confirm that the induction of apoptosis and DNA repair genes correlated with induction of DNA damage, we examined the phosphorylation of histone H2A.X, an early cellular response to DNA damage.22 Figure 6 shows that LBH589 induced H2A.X phosphorylation in a dose-dependent manner following the treatment of MOLT-4 and Reh cells with LBH589.
Figure 6.

LBH589 induces phosphorylation of histone H2A.X. Cells were treated with the indicated concentrations of LBH589 for 24 hours. Subsequently, Western blot analysis of phosphorylated histone H2A.X was performed on the cell lysates from MOLT-4 and Reh cells. The levels of β-actin served as loading controls. Results are representative of 3 independent experiments.
LBH589 induces expression of GADD45G gene and causes loss of viability of primary Ph− ALL cells
We next determined whether LBH589 treatment could also be active against primary cells isolated from peripheral blood or bone marrow samples of Ph− ALL patients. Table 2 summarizes the characteristics of the patients. Table 3 indicates that all 6 patient samples analyzed responded to the LBH589 treatment with an increase in the percentage of nonviable cells, including the sample from a relapsed patient. Figure 7 shows that GADD45G mRNA levels are significantly increased (P = .028) in primary cells. The up-regulation of GADD45G in response to LBH589 treatment is around 5-fold (ratio between the median of the GADD45G relative expression of treated and untreated cells).
Table 2.
Clinical and cytogenetic characteristics of Ph− ALL patients
| Patient sample | Subtype | Sample type | Additional cytogenetic abnormality | Cytogenetic | WBC, ×109/L | Blast % in PB | Blast % in BM |
|---|---|---|---|---|---|---|---|
| 1 | Pre-B | PB | N | Female karyotype | 28.7 | 90.0 | 95.0 |
| 2 | Pre-T | PB | Y | TP15/TP16/9p21, 86% by FISH | 109.3 | 82.0 | 100.0 |
| 3 | Pre-B | BM | Y | Tetrasomy 9/22, 10.3% by FISH | 4.1 | 4.0 | 80.0 |
| 4* | Pre-T | BM | Y | Add(1);t(10;11), 13/20 | 1.2 | 18.0 | 98.0 |
| 5 | Pre-B | BM | Y | Trisomy 11, 5.0% by FISH; trisomy 22, 4.6% by FISH | 1.9 | 10.0 | 68.0 |
| 6 | Pre-B | BM | Y | Trisomy 22 | 75.3 | 96.0 | 89.0 |
FISH indicates fluorescent in situ hybridization.
Relapsed patient.
Table 3.
LBH589 causes loss of viability of primary Ph− ALL cells
| Patient sample | Loss of cell viability, % |
|
|---|---|---|
| LBH589, 5 nM | LBH589, 50 nM | |
| 1 | 52.9 | 65.3 |
| 2 | 73.9 | 75.6 |
| 3 | 74.1 | 82.6 |
| 4* | 33.5 | 57.8 |
| 5 | 27.6 | 52.6 |
| 6 | 12.1 | 53.9 |
Samples of primary Ph− ALL cells were treated in culture with the indicated concentrations of LBH589 for 48 hours. The percentage of nonviable cells was determined by annexin V/PI staining and flow cytometry. The values represent the percentages of loss of viability normalized to that of the untreated cells and are the means of two separate treatments.
Relapsed patient.
Discussion
Even though Ph+ ALL has worse prognosis than Ph− ALL, there are alternative therapies such as imatinib23 and dasatinib24 already approved for Ph+ ALL; in contrast, there is a pressing need for development of new drugs with more potent activity in Ph− ALL, given the paucity of effective salvage therapies for patients with relapsed or refractory disease.18 The novel broad-spectrum HDAC inhibitor LBH589 has been already studied in several refractory hematologic malignancies,25,26 including Ph+ leukemia cells,27 but not in Ph− ALL.
In the present study, we examined the in vitro and ex vivo effects of LBH589 on human Ph− ALL cells. Our results demonstrate that LBH589 possesses potent growth inhibitory activity against the 2 Ph− ALL cell lines, MOLT-4 (T-cell) and Reh (pre–B-cell), and the 6 patient samples studied. Treatment of MOLT-4 and Reh cells with LBH589 causes induction of apoptosis, inhibition of cell proliferation, and cell-cycle arrest in G2/M phase at low nanomolar dosages, with IC50 values in the 5- to 20-nM range. HDAC inhibitors have previously been tested in ALL cells; however, most of them are of limited therapeutic value due to their IC50 values in the micromolar to millimolar range in vitro.28–31 In primary cells, we observed significant loss of viability following treatment with as little as 5 nM after 24 hours. Thus, the increased potency of LBH589 makes it a promising therapeutic agent for treatment of Ph− ALL. Previously, a phase 1 trial was published in which LBH589 was tested in patients with refractory hematologic malignancies32; however, the authors studied only one ALL patient and did not specify if the tumor was Ph positive or negative. In the present report, we provide strong evidence for the biologic and molecular effects of LBH589 in Ph− ALL cells.
MOLT-4 cells appear to be more sensitive than Reh cells in apoptosis and cell growth inhibition in response to LBH589; by contrast, LBH589 induces more G2/M arrest than apoptosis in Reh cells. These biologic effects are associated with hyperacetylation of histone H3K9 and H4K8, induction of p21 and p27, and depletion of c-Myc. In MOLT-4 cells, there is already a decreasing cell percentage in G1 phase at the lowest dose (10 nM) and this correlates with a substantial decrease in c-Myc protein levels. Moreover, the larger cell percentage accumulation in G2/M-phase in Reh cells was accompanied by a greater up-regulation of the cyclin-dependent kinase inhibitors p21 (Waf1/CIP1) and p27 (Kip1) protein levels than in MOLT-4. In MOLT-4 cells, while the amount of the p21 protein increased in response to LBH589 treatment, the level of p27 increased at the lowest dose used and subsequently decreased. This is in agreement with other studies33 showing that down-regulation of p27 makes cells more prone to apoptosis, potentially explaining why the LBH589 response involves more G2/M arrest in Reh cells and more apoptosis in MOLT-4 cells.
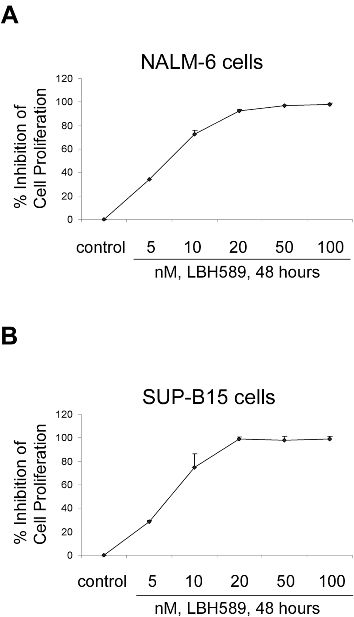
MTS assay results in another Ph− cell line (NALM-6) and in a Ph+ cell line (SUP-B15) show that LBH589 has similar efficacy in terms of cell growth inhibition, with IC50 values in the 5- to 10-nM range (Figure S1A,B, available on the Blood website; see the Supplemental Materials link at the top of the online article). Importantly, we confirmed that LBH589 has no effect on normal lymphocytes (Figure S2), in agreement with previous studies.26,34
PCR array data indicate that LBH589 up-regulates expression of apoptosis and DNA damage response–related genes, such as TP73, CHEK2, RBBP8, TREX1, BRCA1, FANCG, FOXO3A, GADD45A, GADD45B, and GADD45G. There are limited prior studies showing the induction of GADD45A and GADD45B, but not GADD45G, by HDAC inhibitors.35,36 Moreover, previous gene expression profiling studies used LBH589 and a different HDAC inhibitor in multiple myeloma cells, but GADD45G did not emerge as an up-regulated gene.26,37 With quantitative real-time PCR, we confirmed up-regulation of FANCG, FOXO3A, GADD45A, GADD45B, and GADD45G in Reh cells and up-regulation of GADD45B and GADD45G in MOLT-4 cells. A recent report from a different group identifies FANCG, FOXO3A, and GADD45G as genes significantly down-regulated in the progression of chronic myeloid leukemia (CML) from chronic to accelerated phase.38 Interestingly, our results show that the gene whose transcript levels were the most dramatically increased in ALL cell lines following LBH589 treatment is GADD45G.
GADD45G is a member of the growth arrest and DNA damage-inducible gene family that functions as a negative regulator of cell-cycle progression and a positive mediator of apoptosis in response to genetic and environmental stresses.39–41 Although current studies indicate that members of the GADD45 family are infrequently mutated in cancer, reduced GADD45 expression due to gene and/or promoter methylation has been frequently observed in several types of human cancers. For example, it has been reported that GADD45G mRNA expression is down-regulated in hepatocellular carcinoma, and that GADD45G causes cell-cycle arrest at the G2/M transition when transfected into Hep-G2 cells.42,43 GADD45G has been defined as a powerful growth suppressor controlling pituitary cell proliferation, and the first identified gene whose expression is lost in the majority of human pituitary tumors.44,45 Therefore, GADD45G can act as a functional tumor suppressor and is frequently inactivated epigenetically in multiple tumors.19
ChIP assay results demonstrate that LBH589 treatment increased histone acetylation at the GADD45G promoter associated with increased GADD45G gene expression. Our siRNA experiments indicate that GADD45G siRNA transfection partially protects ALL cells from LBH589-induced apoptosis, suggesting that GADD45G only partially mediates the LBH589 apoptosis response in ALL cells. These results indicate that GADD45G may be necessary, but not sufficient, for cell death induction in response to LBH589 treatment. In addition, LBH589 may act directly or indirectly in the regulation of GADD45G. It is possible that LBH589 regulates GADD45G through the inhibition of c-Myc, an established endogenous transcriptional repressor of GADD45,46,47 or through up-regulation of BRCA1, an established activator of GADD45.48,49 Importantly, this is the first report that demonstrates induction of the GADD45G gene in tumor cells following HDAC inhibitor treatment.
Histone H2A.X phosphorylation is one of the earliest responses to DNA damage.50 The induction of histone H2A.X phosphorylation that we observed correlates with the induction of DNA repair genes, including GADD45G, within the context of DNA damage pathways. Moreover, this result is in agreement with other studies describing the phosphorylation of H2A.X following HDAC inhibitor exposure.51–53 The confirmation of GADD45G up-regulation also in primary tumor cells suggests that GADD45G mRNA levels could be a potential biomarker for LBH589 response in patients.
In summary, LBH589 possesses potent growth inhibitory activities against Ph− ALL cells that correlate with induction of histone hyperacetylation and regulation of genes critical for cell growth inhibition, cell-cycle arrest, apoptosis, and DNA repair. Therefore, LBH589 represents a novel and promising therapeutic option for Ph− ALL patients that may provide clinical benefit in combination with conventional therapies. Our findings provide a rationale for clinical trials of LBH589 in relapsed patients with Ph− ALL.
Supplementary Material
Acknowledgments
We thank members of our laboratories for stimulating discussion, the Analytical Cytometry Core at City of Hope, Dr Piotr Swiderski from the DNA/RNA synthesis Core at City of Hope, and Allen Lin for coordinating the patient sample data management.
This work was supported by a grant from the National Institutes of Health (R01-CA-055652; R.J.). A.S. is a W. M. Keck Foundation Fellow.
Footnotes
The online version of this article contains a data supplement.
The publication costs of this article were defrayed in part by page charge payment. Therefore, and solely to indicate this fact, this article is hereby marked “advertisement” in accordance with 18 USC section 1734.
Authorship
Contribution: A.S. designed and performed the experiments, analyzed and interpreted the data, performed statistical analyses, made the figures, and wrote the paper; M.K. advised on the research, helped in supervising, and critically read the paper; C.K. designed the GADD45G siRNA and optimized the transfection protocol for Reh cells; L.K. performed the MTS assays for Figure S1A,B; A.J. helped in designing the PCR array experiments, designing the primers, and analyzing the data; P.A. provided valuable suggestions; V.P. and R.B. advised on the research, assisted with studies on patient samples, and critically read the paper; S.F. and Y.Y. advised on the research and critically read the paper; R.J. was overall responsible for this research and edited the paper.
Conflict-of-interest disclosure: P.A. is employed by and has declared a financial interest in Novartis Pharmaceuticals, whose product, LBH589, was studied in the present work. The remaining authors declare no competing financial interests.
Correspondence: Richard Jove, Beckman Research Institute, City of Hope National Medical Center, 1500 East Duarte Rd, Duarte, CA 91010; e-mail: rjove@coh.org.
References
- 1.Caron C, Boyault C, Khochbin S. Regulatory cross-talk between lysine acetylation and ubiquitination: role in the control of protein stability. Bioessays. 2005;27:408–415. doi: 10.1002/bies.20210. [DOI] [PubMed] [Google Scholar]
- 2.Sengupta N, Seto E. Regulation of histone deacetylase activities. J Cell Biochem. 2004;93:57–67. doi: 10.1002/jcb.20179. [DOI] [PubMed] [Google Scholar]
- 3.Minucci S, Pelicci PG. Histone deacetylase inhibitors and the promise of epigenetic (and more) treatments for cancer. Nat Rev Cancer. 2006;6:38–51. doi: 10.1038/nrc1779. [DOI] [PubMed] [Google Scholar]
- 4.Claus R, Lubbert M. Epigenetic targets in hematopoietic malignancies. Oncogene. 2003;22:6489–6496. doi: 10.1038/sj.onc.1206814. [DOI] [PubMed] [Google Scholar]
- 5.Melnick A, Licht JD. Histone deacetylases as therapeutic targets in hematologic malignancies. Curr Opin Hematol. 2002;9:322–332. doi: 10.1097/00062752-200207000-00010. [DOI] [PubMed] [Google Scholar]
- 6.Johnstone RW, Licht JD. Histone deacetylase inhibitors in cancer therapy: is transcription the primary target? Cancer Cell. 2003;4:13–18. doi: 10.1016/s1535-6108(03)00165-x. [DOI] [PubMed] [Google Scholar]
- 7.Dokmanovic M, Marks PA. Prospects: histone deacetylase inhibitors. J Cell Biochem. 2005;96:293–304. doi: 10.1002/jcb.20532. [DOI] [PubMed] [Google Scholar]
- 8.Acharya MR, Sparreboom A, Venitz J, Figg WD. Rational development of histone deacetylase inhibitors as anticancer agents: a review. Mol Pharmacol. 2005;68:917–932. doi: 10.1124/mol.105.014167. [DOI] [PubMed] [Google Scholar]
- 9.Drummond DC, Noble CO, Kirpotin DB, Guo Z, Scott GK, Benz CC. Clinical development of histone deacetylase inhibitors as anticancer agents. Annu Rev Pharmacol Toxicol. 2005;45:495–528. doi: 10.1146/annurev.pharmtox.45.120403.095825. [DOI] [PubMed] [Google Scholar]
- 10.Pui CH, Evans WE. Acute lymphoblastic leukemia. N Engl J Med. 1998;339:605–615. doi: 10.1056/NEJM199808273390907. [DOI] [PubMed] [Google Scholar]
- 11.Johansson B, Mertens F, Mitelman F. Clinical and biological importance of cytogenetic abnormalities in childhood and adult acute lymphoblastic leukemia. Ann Med. 2004;36:492–503. doi: 10.1080/07853890410018808. [DOI] [PubMed] [Google Scholar]
- 12.Randolph TR. Advances in acute lymphoblastic leukemia. Clin Lab Sci. 2004;17:235–245. [PubMed] [Google Scholar]
- 13.Garcia-Manero G, Daniel J, Smith TL, et al. DNA methylation of multiple promoter-associated CpG islands in adult acute lymphocytic leukemia. Clin Cancer Res. 2002;8:2217–2224. [PubMed] [Google Scholar]
- 14.Garcia-Manero G, Bueso-Ramos C, Daniel J, Williamson J, Kantarjian HM, Issa JP. DNA methylation patterns at relapse in adult acute lymphocytic leukemia. Clin Cancer Res. 2002;8:1897–1903. [PubMed] [Google Scholar]
- 15.Thomas DA, Kantarjian H, Smith TL, et al. Primary refractory and relapsed adult acute lymphoblastic leukemia: characteristics, treatment results, and prognosis with salvage therapy. Cancer. 1999;86:1216–1230. doi: 10.1002/(sici)1097-0142(19991001)86:7<1216::aid-cncr17>3.0.co;2-o. [DOI] [PubMed] [Google Scholar]
- 16.Garcia-Manero G, Thomas DA. Salvage therapy for refractory or relapsed acute lymphocytic leukemia. Hematol Oncol Clin North Am. 2001;15:163–205. doi: 10.1016/s0889-8588(05)70204-5. [DOI] [PubMed] [Google Scholar]
- 17.Yavuz S, Paydas S, Disel U, Sahin B. IDA-FLAG regimen for the therapy of primary refractory and relapse acute leukemia: a single-center experience. Am J Ther. 2006;13:389–393. doi: 10.1097/01.mjt.0000181690.21601.09. [DOI] [PubMed] [Google Scholar]
- 18.Fielding AK, Richards SM, Chopra R, et al. Outcome of 609 adults after relapse of acute lymphoblastic leukemia (ALL): an MRC UKALL12/ECOG 2993 study. Blood. 2007;109:944–950. doi: 10.1182/blood-2006-05-018192. [DOI] [PubMed] [Google Scholar]
- 19.Ying J, Srivastava G, Hsieh WS, et al. The stress-responsive gene GADD45G is a functional tumor suppressor, with its response to environmental stresses frequently disrupted epigenetically in multiple tumors. Clin Cancer Res. 2005;11:6442–6449. doi: 10.1158/1078-0432.CCR-05-0267. [DOI] [PubMed] [Google Scholar]
- 20.Heale BS, Soifer HS, Bowers C, Rossi JJ. siRNA target site secondary structure predictions using local stable substructures. Nucleic Acids Res. 2005;33:e30. doi: 10.1093/nar/gni026. http://nar.oxfordjournals.org. [DOI] [PMC free article] [PubMed] [Google Scholar]
- 21.Scherer LJ, Yildiz Y, Kim J, Cagnon L, Heale B, Rossi JJ. Rapid assessment of anti-HIV siRNA efficacy using PCR-derived Pol III shRNA cassettes. Mol Ther. 2004;10:597–603. doi: 10.1016/j.ymthe.2004.05.003. [DOI] [PubMed] [Google Scholar]
- 22.Thiriet C, Hayes JJ. Chromatin in need of a fix: phosphorylation of H2AX connects chromatin to DNA repair. Mol Cell. 2005;18:617–622. doi: 10.1016/j.molcel.2005.05.008. [DOI] [PubMed] [Google Scholar]
- 23.Wassmann B. Imatinib in relapsed or refractory Philadelphia chromosome-positive acute lymphoblastic leukaemia: a viewpoint by Barbara Wassmann [Letter]. Drugs. 2007;67:2656. doi: 10.2165/00003495-200767170-00016. [DOI] [PubMed] [Google Scholar]
- 24.Steinberg M. Dasatinib: a tyrosine kinase inhibitor for the treatment of chronic myelogenous leukemia and philadelphia chromosome-positive acute lymphoblastic leukemia. Clin Ther. 2007;29:2289–2308. doi: 10.1016/j.clinthera.2007.11.005. [DOI] [PubMed] [Google Scholar]
- 25.George P, Bali P, Annavarapu S, et al. Combination of the histone deacetylase inhibitor LBH589 and the hsp90 inhibitor 17-AAG is highly active against human CML-BC cells and AML cells with activating mutation of FLT-3. Blood. 2005;105:1768–1776. doi: 10.1182/blood-2004-09-3413. [DOI] [PubMed] [Google Scholar]
- 26.Maiso P, Carvajal-Vergara X, Ocio EM, et al. The histone deacetylase inhibitor LBH589 is a potent antimyeloma agent that overcomes drug resistance. Cancer Res. 2006;66:5781–5789. doi: 10.1158/0008-5472.CAN-05-4186. [DOI] [PubMed] [Google Scholar]
- 27.Scuto A, Annavarapu S, Bali P, et al. Synergistic cytotoxic effects of a combination of a novel tyrosine kinase inhibitor AMN107 and histone deacetylase inhibitor LBH589 against Bcr-Abl expressing human leukemia cells [abstract]. Blood (ASH Annual Meeting Abstracts) 2004;104:546a. Abstract no. 1977. [Google Scholar]
- 28.Bernhard D, Ausserlechner MJ, Tonko M, et al. Apoptosis induced by the histone deacetylase inhibitor sodium butyrate in human leukemic lymphoblasts. Faseb J. 1999;13:1991–2001. doi: 10.1096/fasebj.13.14.1991. [DOI] [PubMed] [Google Scholar]
- 29.Murata M, Towatari M, Kosugi H, et al. Apoptotic cytotoxic effects of a histone deacetylase inhibitor, FK228, on malignant lymphoid cells. Jpn J Cancer Res. 2000;91:1154–1160. doi: 10.1111/j.1349-7006.2000.tb00899.x. [DOI] [PMC free article] [PubMed] [Google Scholar]
- 30.Batova A, Shao LE, Diccianni MB, et al. The histone deacetylase inhibitor AN-9 has selective toxicity to acute leukemia and drug-resistant primary leukemia and cancer cell lines. Blood. 2002;100:3319–3324. doi: 10.1182/blood-2002-02-0567. [DOI] [PubMed] [Google Scholar]
- 31.Romanski A, Bacic B, Bug G, et al. Use of a novel histone deacetylase inhibitor to induce apoptosis in cell lines of acute lymphoblastic leukemia. Haematologica. 2004;89:419–426. [PubMed] [Google Scholar]
- 32.Giles F, Fischer T, Cortes J, et al. A phase I study of intravenous LBH589, a novel cinnamic hydroxamic acid analogue histone deacetylase inhibitor, in patients with refractory hematologic malignancies. Clin Cancer Res. 2006;12:4628–4635. doi: 10.1158/1078-0432.CCR-06-0511. [DOI] [PubMed] [Google Scholar]
- 33.Ouwehand K, de Ruijter AJ, van Bree C, Caron HN, van Kuilenburg AB. Histone deacetylase inhibitor BL1521 induces a G1-phase arrest in neuroblastoma cells through altered expression of cell cycle proteins. FEBS Lett. 2005;579:1523–1528. doi: 10.1016/j.febslet.2005.01.058. [DOI] [PubMed] [Google Scholar]
- 34.Catley L, Weisberg E, Kiziltepe T, et al. Aggresome induction by proteasome inhibitor bortezomib and alpha-tubulin hyperacetylation by tubulin deacetylase (TDAC) inhibitor LBH589 are synergistic in myeloma cells. Blood. 2006;108:3441–3449. doi: 10.1182/blood-2006-04-016055. [DOI] [PMC free article] [PubMed] [Google Scholar]
- 35.Chen Z, Clark S, Birkeland M, et al. Induction and superinduction of growth arrest and DNA damage gene 45 (GADD45) alpha and beta messenger RNAs by histone deacetylase inhibitors trichostatin A (TSA) and butyrate in SW620 human colon carcinoma cells. Cancer Lett. 2002;188:127–140. doi: 10.1016/s0304-3835(02)00322-1. [DOI] [PubMed] [Google Scholar]
- 36.Hirose T, Sowa Y, Takahashi S, et al. p53-independent induction of Gadd45 by histone deacetylase inhibitor: coordinate regulation by transcription factors Oct-1 and NF-Y. Oncogene. 2003;22:7762–7773. doi: 10.1038/sj.onc.1207091. [DOI] [PubMed] [Google Scholar]
- 37.Mitsiades CS, Mitsiades NS, McMullan CJ, et al. Transcriptional signature of histone deacetylase inhibition in multiple myeloma: biological and clinical implications. Proc Natl Acad Sci U S A. 2004;101:540–545. doi: 10.1073/pnas.2536759100. [DOI] [PMC free article] [PubMed] [Google Scholar]
- 38.Radich JP, Dai H, Mao M, et al. Gene expression changes associated with progression and response in chronic myeloid leukemia. Proc Natl Acad Sci U S A. 2006;103:2794–2799. doi: 10.1073/pnas.0510423103. [DOI] [PMC free article] [PubMed] [Google Scholar]
- 39.Vairapandi M, Balliet AG, Hoffman B, Liebermann DA. GADD45b and GADD45g are cdc2/cyclinB1 kinase inhibitors with a role in S and G2/M cell cycle checkpoints induced by genotoxic stress. J Cell Physiol. 2002;192:327–338. doi: 10.1002/jcp.10140. [DOI] [PubMed] [Google Scholar]
- 40.Jiang F, Wang Z. Gadd45gamma is androgen-responsive and growth-inhibitory in prostate cancer cells. Mol Cell Endocrinol. 2004;213:121–129. doi: 10.1016/j.mce.2003.10.050. [DOI] [PubMed] [Google Scholar]
- 41.Zerbini LF, Czibere A, Wang Y, et al. A novel pathway involving melanoma differentiation associated gene-7/interleukin-24 mediates nonsteroidal anti-inflammatory drug-induced apoptosis and growth arrest of cancer cells. Cancer Res. 2006;66:11922–11931. doi: 10.1158/0008-5472.CAN-06-2068. [DOI] [PubMed] [Google Scholar]
- 42.Sun L, Gong R, Wan B, et al. GADD45gamma, down-regulated in 65% hepatocellular carcinoma (HCC) from 23 chinese patients, inhibits cell growth and induces cell cycle G2/M arrest for hepatoma Hep-G2 cell lines. Mol Biol Rep. 2003;30:249–253. doi: 10.1023/a:1026370726763. [DOI] [PubMed] [Google Scholar]
- 43.Chung HK, Yi YW, Jung NC, et al. Gadd45gamma expression is reduced in anaplastic thyroid cancer and its reexpression results in apoptosis. J Clin Endocrinol Metab. 2003;88:3913–3920. doi: 10.1210/jc.2002-022031. [DOI] [PubMed] [Google Scholar]
- 44.Bahar A, Bicknell JE, Simpson DJ, Clayton RN, Farrell WE. Loss of expression of the growth inhibitory gene GADD45gamma, in human pituitary adenomas, is associated with CpG island methylation. Oncogene. 2004;23:936–944. doi: 10.1038/sj.onc.1207193. [DOI] [PubMed] [Google Scholar]
- 45.Zhang X, Sun H, Danila DC, et al. Loss of expression of GADD45 gamma, a growth inhibitory gene, in human pituitary adenomas: implications for tumorigenesis. J Clin Endocrinol Metab. 2002;87:1262–1267. doi: 10.1210/jcem.87.3.8315. [DOI] [PubMed] [Google Scholar]
- 46.Amundson SA, Zhan Q, Penn LZ, Fornace AJ., Jr Myc suppresses induction of the growth arrest genes gadd34, gadd45, and gadd153 by DNA-damaging agents. Oncogene. 1998;17:2149–2154. doi: 10.1038/sj.onc.1202136. [DOI] [PubMed] [Google Scholar]
- 47.Marhin WW, Chen S, Facchini LM, Fornace AJ, Jr, Penn LZ. Myc represses the growth arrest gene gadd45. Oncogene. 1997;14:2825–2834. doi: 10.1038/sj.onc.1201138. [DOI] [PubMed] [Google Scholar]
- 48.Jin S, Zhao H, Fan F, et al. BRCA1 activation of the GADD45 promoter. Oncogene. 2000;19:4050–4057. doi: 10.1038/sj.onc.1203759. [DOI] [PubMed] [Google Scholar]
- 49.Fan W, Jin S, Tong T, et al. BRCA1 regulates GADD45 through its interactions with the OCT-1 and CAAT motifs. J Biol Chem. 2002;277:8061–8067. doi: 10.1074/jbc.M110225200. [DOI] [PubMed] [Google Scholar]
- 50.Fillingham J, Keogh MC, Krogan NJ. GammaH2AX and its role in DNA double-strand break repair. Biochem Cell Biol. 2006;84:568–577. doi: 10.1139/o06-072. [DOI] [PubMed] [Google Scholar]
- 51.Vavrova J, Janovska S, Rezacova M, et al. Proteomic analysis of MOLT-4 cells treated by valproic acid. Mol Cell Biochem. 2007;303:53–61. doi: 10.1007/s11010-007-9455-0. [DOI] [PubMed] [Google Scholar]
- 52.Sanchez-Gonzalez B, Yang H, Bueso-Ramos C, et al. Antileukemia activity of the combination of an anthracycline with a histone deacetylase inhibitor. Blood. 2006;108:1174–1182. doi: 10.1182/blood-2005-09-008086. [DOI] [PMC free article] [PubMed] [Google Scholar]
- 53.Geng L, Cuneo KC, Fu A, Tu T, Atadja PW, Hallahan DE. Histone deacetylase (HDAC) inhibitor LBH589 increases duration of gamma-H2AX foci and confines HDAC4 to the cytoplasm in irradiated non-small cell lung cancer. Cancer Res. 2006;66:11298–11304. doi: 10.1158/0008-5472.CAN-06-0049. [DOI] [PubMed] [Google Scholar]
Associated Data
This section collects any data citations, data availability statements, or supplementary materials included in this article.