

Abstract
Friedreich’s ataxia, the most frequent inherited ataxia, is caused, in the vast majority of cases, by large GAA repeat expansions in the first intron of the frataxin gene. The normal sequence corresponds to a moderately polymorphic trinucleotide repeat with bimodal size distribution. Small normal alleles have approximately eight to nine repeats whereas a more heterogeneous mode of large normal alleles ranges from 16 to 34 GAA. The latter class accounts for ≈17% of normal alleles. To identify the origin of the expansion mutation, we analyzed linkage disequilibrium between expansion mutations or normal alleles and a haplotype of five polymorphic markers within or close to the frataxin gene; 51% of the expansions were associated with a single haplotype, and the other expansions were associated with haplotypes that could be related to the major one by mutation at a polymorphic marker or by ancient recombination. Of interest, the major haplotype associated with expansion is also the major haplotype associated with the larger alleles in the normal size range and was almost never found associated with the smaller normal alleles. The results indicate that most if not all large normal alleles derive from a single founder chromosome and that they represent a reservoir for larger expansion events, possibly through “premutation” intermediates. Indeed, we found two such alleles (42 and 60 GAA) that underwent cataclysmic expansion to pathological range in a single generation. This stepwise evolution to large trinucleotide expansions already was suggested for myotonic dystrophy and fragile X syndrome and may relate to a common mutational mechanism, despite sequence motif differences.
Friedreich’s ataxia (FRDA), an autosomal recessive disease, is the most frequent inherited ataxia, with a prevalence estimated at ≈1 to 50,000 and a calculated carrier frequency of ≈1 into 120 in the Caucasian population (1–5). We identified recently by positional cloning the defective gene, named frataxin, that encodes a protein of unknown function (6). FRDA is caused, in nearly all cases (97%), by an unstable GAA repeat expansion in the first intron of the frataxin gene. The normal sequence corresponds to a polymorphic repeat of ≈8–30 GAA. Pathological alleles were shown to have 120-1700 repeats (6–8). The disease is caused by a loss of function of the frataxin protein, as shown by reduction of mRNA level in lymphoblastoid cell lines of patients, and in few cases by point mutations leading to a truncated protein (6).
The fragile X syndrome and myotonic dystrophy are also due to large expansions of trinucleotide repeats. They are characterized by the existence of unstable alleles (named premutations in fragile X syndrome) that have no pathologic effect but that may lead in one or two generations to the disease-causing alleles (9). Furthermore, in these diseases, linkage disequilibrium between disease alleles and flanking markers results from ancestral events that create normal alleles predisposed to mutate, over many generations, to truly unstable alleles (10, 11). We wanted to see if similar mechanisms occurred in FRDA. In particular, because this is a recessive disease, there is no strong selection pressure on pathological alleles (unlike in myotonic dystrophy or fragile X syndrome). Significant linkage disequilibrium was initially detected in French and Italian FRDA patients using markers now known to lie at 700 and 500 kb from the frataxin gene (12–14). A stronger disequilibrium, suggestive of a major founder effect, was detected further by analysis of a biallelic marker located 120 kb telomeric to the frataxin GAA repeat (15). To define the origin of the founder event, we analyzed a haplotype of five polymorphic markers within or close to the frataxin gene in normal and expanded repeats. Our data indicate that a founder event, accounting for more than 85% of present mutations, was related to the occurrence of large normal (LN) alleles rather than disease-causing expansion. We also found evidence for premutation alleles in two families and could estimate by direct analysis the frequency of heterozygotes for large expansions in the French population.
MATERIALS AND METHODS
Population Studied.
The frequency of the GAA expansion in the normal population was evaluated from available Southern blots carrying EcoRI digests from 730 independent French individuals and by PCR analysis of 121 parents or grandparents from 39 families from Centre d’Étude du Polymorphisme Humain (CEPH). Analysis of GAA repeat length in normal alleles was performed in 258 families (175 FRDA families and 83 control families including the 39 from CEPH). Inheritance of the GAA repeat expansion was studied by PCR in the FRDA families. The PCR technique did not allow the identification of intrafamilial size variation of large expansions but allowed the identification of large alleles (normal or premutation).
Sixty five FRDA families and 23 control families (including 19 CEPH families) were selected for haplotype analysis to have important representation for each of the three GAA repeat groups: small normal (SN), LN, and expansion; 95% of families analyzed for haplotyping were of French or Western European origin. The remaining families were from Yemen (one family) and North Africa (four families).
Analysis of GAA Repeats.
Identification of normal alleles, premutations, and expansions was done by PCR analysis, using the primers described (8). Cycling conditions were 30 cycles with the following steps: 94°C for 10 s, 60°C for 20 s, and 68°C for 2 min, in PTC-100 (MJ Research, Cambridge, MA). PCR products were separated on a 1% agarose gel and transferred onto a Nytran N+ membrane (Schleicher & Schuell). Blots were hybridized with a (GAA)10 oligoprobe end labeled with (γ32-P)ATP and autoradiographed.
Twenty six SN and 65 LN alleles identified on agarose gels were further sized on sequencing 5% polyacrylamide gels, using end labeling of the forward primer. The number of GAA repeats was estimated by comparison with PCR fragments of known GAA repeat length. The size of the repeat was estimated with plus or minus one GAA repeat accuracy due to the variable poly A track (n = 14–17) preceding the GAA repeat.
The number and nature of the repeats in different normal, premutated alleles and in a small pathological expansion were determined by direct sequencing (Applied Biosystems). The PCR fragments were separated on agarose gel and purified with the Geneclean kit (Bio 101) before sequencing.
Haplotype Analysis.
For three markers previously described, FAD1 (15, 16), F5225, and CS2 (17), new primers were designed (Table 1). Glycerol (10%) was added for CS2 and FAD1 PCR. SSCP analysis of frataxin exons 3 and 5 (6) revealed two C/T polymorphisms, ITR3 and ITR4, located immediately after frataxin exon 3 and immediately before exon 5, respectively (Table 1). Polymorphism analysis of ITR3, ITR4, and FAD1 was performed by allele-specific oligonucleotide hybridization (Table 1 and refs. 18 and 19). CS2 polymorphism was analyzed by Fnu4HI digestion of the PCR products (17). Haplotypes were constructed by inspection of pedigrees. In <10% of cases, haplotypes could not be completed because of uncertain phase determination.
Table 1.
Polymorphic markers close or within the frataxin gene
| Marker | Polymorphism | PCR
|
Polymorphism detection | ||||
|---|---|---|---|---|---|---|---|
| Primers | Annealing, °C | Size, bp | ASO
|
||||
| Probes | Washing | ||||||
| CS2 | C/T | F: AGCCTTTTCCATCACAGCA | 50 | 137 | FnuH4I; RFLP | ||
| R: GGTCACATTCTGTGGTGACA | |||||||
| ITR3 | C/T | F: AAAATGGAAGCATTTGGTAATCA | 55 | 231 | ASO | TTTTATTTTTCTGTTTCC | RT |
| R: AGTGAACTAAAATTCTTAGAGGG | TTTTACTTTTCTGTTTCC | ||||||
| F5225 | (TCTA)n(TCCA)n | F: AGAGTCACAACAAGCCTGGTA | 58 | 225 | Acrylamide gel | ||
| R: CGGGAGGTGAAGGTTGCAGT | |||||||
| ITR4 | C/T | F: TCGTATAACTCTTCTTAGATGC | 53 | 340 | ASO | TTACTCCAGTTAATTTCTTGG | 54°C |
| R: TGTCCTTAAAACGGGGCT | TTACTCCAGTCAATTTCTTGG | ||||||
| FAD1 | A/C | F: TCCCAAAATCTTACCATTGC | 51 | 225 | ASO | TCATCTCCCTGTGAG | RT |
| R: ACCAGTAACTAGGTTGATGAG | TCATATCCCTGTGAG | ||||||
F, forward primer; R, reverse primer; RT, room temperature; ASO, allele-specific oligonucleotide hybridization; RFLP, restriction fragment length polymorphism.
Statistical Analysis.
Frequencies of alleles and haplotypes were compared between samples by χ2 test of homogeneity or by Yates corrected χ2 when appropriate. Significance levels were corrected for multiple comparison Bonferroni correction as follows: α′ = αk, where α′ is the corrected significant level and k is the number of comparisons. Corrected significance levels are indicated as P levels.
RESULTS
Distribution of the GAA Repeats in the Population.
We screened 851 independent individuals from non-FRDA families for large GAA expansions in the frataxin gene. Seven hundred and thirty French individuals were analyzed on Southern blots of EcoRI digests. Because of the size of the normal EcoRI fragment (8.2 kb), only expanded alleles with more than 100 GAA can be discriminated from the normal ones. One hundred and twenty-one independent parents or grandparents from 39 CEPH families were analyzed by a more discriminating PCR/blot method (see Materials and Methods). We found 11 expansions, 10 by Southern blot and one by PCR. One of them, carrying 95 pure GAA, might not be disease-causing (the smallest expansion we found in a patient was ≈112 GAA; ref. 7).
Sizing of normal alleles was performed by PCR analysis on 498 independent chromosomes from 258 families (see Materials and Methods). This showed a bimodal distribution: 414 (83%) contained ≈9 GAA repeats, and 84 (17%) were LN alleles of 16 or more repeats. A more accurate sizing was performed on sequencing polyacrylamide gels on 26 SN alleles and on 65 LN alleles. SN alleles ranged from 7 to 12 repeats, [(GAA)9 accounting for 50% of them], and LN alleles ranged from 16 to 34 repeats (Fig. 1). Five SN and 12 LN alleles were sequenced. All contained pure GAA repeats except two, a 33-repeat allele [(GAA)15(GAGGAA)7(GAA)4] and a 55-repeat allele [(GAA)14 (GAG GAA)7 (GAA)8 G (GAA)19]. The last one was found on the normal chromosome of a healthy 50-year-old carrier of a pathological expansion on the other chromosome. The first of these repeats was carried on a haplotype (CT3CC) very rarely found on expanded alleles (see below). For the second allele, the haplotype could not be determined unambiguously in its entirety [AT3C(C/T)]. The presence of a common internal T3C haplotype suggests that these two imperfect repeat alleles may have a common origin.
Figure 1.

Distribution of the GAA repeat sizes observed in control chromosomes. The GAA repeat is moderately polymorphic among normal alleles. The distribution is bimodal; most (83%) alleles contain around nine repeats (7–12), and 17% are LN alleles of 16 repeats or more. Accurate sizing was determined on 26 SN and 65 LN GAA alleles by denaturing polyacrylamide gel migration.
Unstable GAA Repeat Transmission.
Analysis of parents of patients homozygous for the expansion also revealed that two (of 193 parents tested) did not have an expansion in the disease-causing range. Transmission of these alleles was studied in these families by Southern blot using the BsiHKAI digest (which is more discriminating than the EcoRI digest; ref. 7) (Fig. 2). In the first case, the father had a LN allele (≈20 GAA) and an allele of ≈60 GAA repeats. Equal intensity of the bands suggests that there was no mosaïcism for larger repeats. His two affected children were homozygous for large expansions, the smallest one being 400 and 630, respectively (Fig. 2A). In family B, the father had a SN allele and an allele of 42 pure GAA. His affected child was homozygous for large expansions, with 300 GAA in the smallest allele. A paternal aunt had a 38-GAA allele that increased to 62 GAA upon transmission to her son (Fig. 2B). In both families, the mother carried a large expansion (≈800 GAA). We thus assumed that the fathers contributed to the smallest pathological alleles in affected children. There were no healthy siblings in the two families to look for additional segregation of the paternal intermediate allele. In both families, transition of the intermediate allele (premutation) to a large expansion within the pathological range was confirmed by haplotype analysis (data not shown), excluding false paternity. On the other hand, in another family, a pathological allele of about 112 repeats (the smallest disease causing one) did not change appreciably in four transmission events (Fig. 2C). Sequencing of this stable expansion revealed that it is interrupted by a (GAAAGAA)2 sequence at ≈20 repeats from the 3′ end, leaving a stretch of ≈90 pure GAA. We also verified transmission of LN alleles (16–33 GAA) in 18 meioses and found size variation in only one case corresponding to a paternal change from 28 to 29 repeat units (data not shown).
Figure 2.

Transition from premutation to pathological expansion documented by BsiHKAI Southern blot analysis. (A and B) Transition of paternal intermediate alleles (not in the disease-causing range) to pathological size expansions in offspring. In both families, haplotype analysis allowed us to exclude false paternity (data not shown). (A) In this family, the father has an allele of ≈60 repeats and his two children are homozygous for expansions in the pathological range. (B) Variable transmission of a premutation within a family. A patient homozygous for GAA expansion inherited an allele from his father carrying a 42 pure GAA repeat allele. A paternal aunt has a 38-GAA allele that increased to 62 GAA upon transmission to her son. Analysis was on a single blot, and the picture was cropped for clarity. (C) Stable transmission of the smallest pathological allele. The half black symbols correspond to the transmission of large expansions and the half shaded symbols to the small expansions, as demonstrated by haplotype segregation (not shown). The small expansion (arrow) was transmitted relatively stably to two siblings (lanes 2 and 3) carrying ≈112 repeats, to the third sister (deduced) and one of her daughters (lane 6) carrying ≈135 repeats. Lanes: 4 and 5, affected children homozygous for larger expansions, in the same family; 1, unrelated individual heterozygous for the GAA expansion; and 7, unrelated control. Samples were analyzed on two separate blots, and unrelated lines were cut out.
Pathological Expansions and LN Alleles Share the Same Linkage Disequilibrium.
A strong linkage disequilibrium recently was reported using a single biallelic marker (FAD1) located 120 kb telomeric to the GAA repeat. The A allele associated to 83% of FRDA chromosomes (not typed for the GAA expansion) was present only on 23% of normal chromosomes (15). To clarify the origin of this linkage disequilibrium and of the GAA expansions, we analyzed haplotypes of five markers (Fig. 3 and Table 1): FAD1 and four markers that are closer to the GAA repeat, including two intragenic biallelic polymorphisms that were not previously described (ITR3 and ITR4). A third intragenic marker is the microsatellite F5225 (17). The last marker, CS2 is biallelic and located 40 kb centromeric to the GAA repeat (17).
Figure 3.
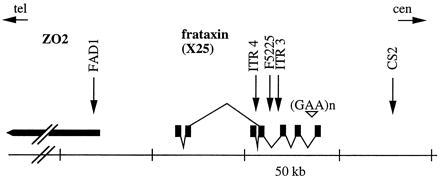
Localization of the markers used for haplotype analysis. Transcription map of the frataxin gene (6) and ZO2 gene (16) is represented. The GAA repeat in intron 1 is indicated (▿). The localization of the five polymorphic markers used for linkage disequilibrium analysis is indicated (arrows). FAD1 is located in a 5′ exon of the ZO2 gene (15). The exons and splicing pattern of the frataxin (X25) gene are represented.
Because normal alleles show a bimodal distribution of GAA repeats, we analyzed separately haplotypes associated to each mode (SN and LN) and compared them to the haplotypes linked to pathological expansions (E). All markers but CS2 showed strong linkage disequilibrium with E when compared with SN chromosomes, and a similar linkage disequilibrium appeared for LN compared with SN chromosomes. No significant difference was observed between LN and E chromosomes (Table 2).
Table 2.
Distribution of allele markers in each class of GAA repeat length
| Marker | Allele | Chromosome
|
|||||
|---|---|---|---|---|---|---|---|
| SN
|
LN
|
E
|
|||||
| n | % | n | % | n | % | ||
| FAD1 | C | 144 | 91.1 | 8 | 12.9 | 11 | 10.3 |
| A* | 14 | 8.8 | 54 | 87.1 | 96 | 89.7 | |
| ITR4 | T* | 49 | 30.4 | 57 | 91.9 | 103 | 95.4 |
| C | 112 | 69.6 | 5 | 8.0 | 5 | 4.6 | |
| F5225† | −1 | 3 | 0 | 0 | |||
| 0 | 2 | 1 | 0 | ||||
| 1 | 42 | 27.3 | 7 | 11.5 | 4 | 3.74 | |
| 2* | 57 | 37.0 | 46 | 75.4 | 78 | 72.9 | |
| 3 | 44 | 28.6 | 7 | 5.8 | 25 | 11.7 | |
| 4 | 3 | 0 | 0 | ||||
| 5 | 2 | 0 | 0 | ||||
| 6 | 1 | 0 | 0 | ||||
| ITR3 | C* | 76 | 49.4 | 58 | 96.7 | 107 | 100 |
| T | 78 | 50.6 | 2 | 3.3 | 0 | ||
| CS2 | C | 114 | 75.0 | 43 | 71.7 | 89 | 84.0 |
| T | 38 | 25.0 | 17 | 28.3 | 17 | 16.0 | |
In a minority of cases, alleles could not be characterized because of noninformative markers for phase determination.
Significantly associated with LN (P < 0.001) and E (P < 0.001) chromosomes.
Alleles are numbered by decreasing number of (TCTA)n + (TCCA)n repeats, with allele −1 having 19 tetranucleotide repeats, according to the initial description of this microsatellite (17). χ2 calculation was performed with the allele 2 compared to the pooled other alleles.
Haplotypes of the five markers (FAD1-ITR4-F5225-ITR3-CS2) were constructed for 139 SN, 57 LN, and 106 E repeat alleles (Table 3). A single haplotype, AT2CC, was found associated with 50.9% of the E and 45.6% of the LN chromosomes whereas it was very rare among SN repeats (0.7%; P << 0.001; Table 3). Two others haplotypes, AT3CC and AT2CT, although less common, also were associated with the LN (respectively, 8.8 and 21.1%) and E alleles (20.8 and 14.2%) (Table 3); the association is significant at P < 0.001 (corrected for multiple comparison) when the SN alleles are compared with pooled LN and E alleles. These three haplotypes that differ from each other at a single marker (either the intragenic microsatellite or the flanking centromeric polymorphism) account collectively for 75.4% and 85.8% of LN and E alleles, respectively, and only for 3.6% of SN alleles. The same major haplotypes were found among the LN and E alleles in European and in a small number of non-European families tested. On the other hand, the four major haplotypes associated with the SN alleles [CC2TC (18.0%) CC3TC (15.8%), CT1CC (10.8%) and CC1CC (7.2%)] were rarely or never associated with the E or LN alleles. These results suggest that the same initial event that occurred on the AT2CC haplotype is at the origin of the LN alleles and the expanded alleles.
Table 3.
Frequencies of haplotypes on SN, LN, and E GAA repeat alleles
| Chromosome
|
|||||||||||||
|---|---|---|---|---|---|---|---|---|---|---|---|---|---|
| Haplotype
|
SN
|
LN
|
E
|
||||||||||
| GSF1 | ITR4 | F5225 | ITR3 | CS2 | n | % | n | % | n | % | |||
| A | T | 2 | C | C | 1 | 0.7 | 26 | 45.6 | 54 | 50.9 | |||
| A | T | 3 | C | C | 0 | 5 | 8.8 | 22 | 20.8 | ||||
| A | T | 1 | C | C | 1 | 2 | 1 | ||||||
| A | T | 2 | C | T | 4 | 2.9 | 12 | 21.1 | 15 | 14.2 | |||
| A | T | 3 | C | T | 1 | 0 | 1 | ||||||
| A | T | 1 | C | T | 1 | 4 | 0 | ||||||
| C | T | 2 | C | C | 7 | 1 | 3 | ||||||
| C | T | 3 | C | C | 4 | 2 | 2 | ||||||
| C | T | 1 | C | C | 15 | 10.8 | 0 | 0 | 3 | 2.8 | |||
| C | T | * | C | C | 3 | 0 | 0 | ||||||
| C | T | 2 | C | T | 1 | 1 | 1 | ||||||
| C | T | † | C | T | 6 | 0 | 0 | ||||||
| ‡ | T | ‡ | C | ‡ | 44 | 31.7 | 53 | 93.0 | 102 | 96.2 | |||
| C | C | 2 | C | C | 6 | 0 | 2 | ||||||
| C | C | 3 | C | C | 1 | 0 | 0 | ||||||
| C | C | 1 | C | C | 10 | 7.2 | 0 | 0 | 0 | 0 | |||
| C | C | * | C | C | 1 | 1 | 0 | ||||||
| C | C | ‡ | C | T | 3 | 0 | 0 | ||||||
| A | C | ‡ | C | C | 3 | 1 | 2§ | ||||||
| ‡ | C | ‡ | C | ‡ | 24 | 17.3 | 2 | 3.6 | 4 | 3.8 | |||
| C | C | 2 | T | C | 25 | 18.0 | 2 | 3.6 | 0 | 0 | |||
| C | C | 3 | T | C | 22 | 15.8 | 0 | 0 | 0 | 0 | |||
| C | C | 1 | T | C | 2 | 0 | 0 | ||||||
| C | C | * | T | C | 1 | 0 | 0 | ||||||
| C | C | 2 | T | T | 6 | 0 | 0 | ||||||
| C | C | 3 | T | T | 8 | 0 | 0 | ||||||
| C | C | 1 | T | T | 0 | 0 | 0 | ||||||
| C | C | * | T | T | 4 | 0 | 0 | ||||||
| A | C | ‡ | T | T | 2 | 0 | 0 | ||||||
| ‡ | C | ‡ | T | ‡ | 70 | 50.0 | 2 | 3.6 | 0 | ||||
| ‡ | T | ‡ | T | ‡ | 1 | 0 | 0 | ||||||
| Total | 139 | 57 | 106 | ||||||||||
Frequent haplotypes are indicated in bold. Frequencies of AT2CC, AT3CC, AT2CT, and the other pooled haplotypes are significantly different among SN, LN, and E chromosomes (χ2 = 195.91, 6 df P ≪ 0.001). They are not significantly different between LN and E, and we compared their frequencies between SN and pooled LN/E chromosomes. Therefore, four comparisons were made, and we used the corrected significance level α′ = 4α for calculation of the P values. AT2CC, AT3CC, and AT2CT were each significantly associated with pooled LN and E chromosomes (corrected P < 0.001 in each case).
Not 1, 2, or 3.
Not 2.
All alleles.
AC2CC.
DISCUSSION
Trinucleotide repeat expansion is a mutational mechanism found in an increasing number of inherited diseases, including the fragile X syndrome, myotonic dystrophy, and Huntington disease (9). In the majority of these, decreased genetic fitness of patients and anticipation associated with a propensity for increased repeat length in succeeding generations leads to loss of expanded alleles over generations. It was therefore unexpected to find strong linkage disequilibrium between disease alleles and close flanking markers, which are an indication of a founder effect (10, 20–26). This led to the conclusion that the negative selection may be compensated by a (continual) renewal of the larger expansions from a pool of smaller, nonpathologic alleles near the upper limit of the normal size range (10, 11, 27). In myotonic dystrophy, the LN alleles were shown by linkage disequilibrium analysis to have arisen most likely from a single initial event [a jump from a (CTG)5 allele to a 20- to 30-CTG allele] in Caucasian populations (11, 24, 28). Similarly, in Huntington disease, dentatorubral–palidoluysian atrophy (DRPLA) and spinocerebellar ataxia type 3/Machado-Joseph disease, haplotypes associated preferentially or uniquely with pathological alleles also are associated preferentially to LN alleles (29–32). Furthermore, in myotonic dystrophy, Huntington disease, and DRPLA, the incidence of the disease in various populations is strongly correlated with the frequency of the LN alleles. This accounts for instance for the very low incidence of myotonic dystrophy in African populations or of DRPLA in European populations (29, 31, 33, 34).
In FRDA, however, there should be very little negative selection on the expansion mutation because of the autosomal recessive inheritance of the disease. Heterozygote carriers may have propagated unselected expansion mutations in the European population at a relatively high frequency. Because the nature of the trinucleotide repeat GAA is different from the CGG or CAG/CTG repeats found in the other diseases, it was of interest to analyze the natural history of the expansion process in FRDA.
Detection of the FRDA expansion mutation allows a direct measurement of carrier frequency in the general population. The number of disease-causing expansions found in the Caucasian population we studied (10/851) predicts a carrier frequency of 1/85 (confidence interval of 1/53–1/222) and a disease incidence of 1/29,000 (with, however, a wide confidence interval of 1/11,000 to 1/200,000), which is within the upper range of previous estimations based on epidemiological studies (1–5). In fact, FRDA expansions have been found associated with a broader spectrum of clinical presentation than the classic form of the disease (35), including patients with adult onset, incomplete presentation, or retained reflexes (7, 8). This suggests that the true incidence of FRDA may be higher than previously estimated. Furthermore, premutations of 40 or more pure GAA may give rise, in a single generation, to pathological alleles, as we have observed in two Friedreich ataxia families. One such intermediate-sized allele (95 GAA) was found in the general population, but pure alleles in the 40–90 range were not discriminated in our screening of EcoRI blots and were not found in 498 normal chromosomes analyzed by PCR. Contribution of such premutations to the disease incidence will require definition of both the frequency of such alleles and their risk to expand in the next generation. One would also have to take into account the small proportion of point mutations that can cause the disease.
We traced back the origin of FRDA expansions by analysis of linkage disequilibrium with five markers present in a 160-kb region encompassing the GAA repeat. We found that haplotype AT2CC is associated with 45–50% of E and LN alleles whereas it is extremely rare in SN alleles. The two second most frequent haplotypes associated with both E and LN alleles differ from the major AT2CC haplotype at only one position and most likely are derived by marker mutation rather than by independent events on distinct haplotypes. Haplotype AT3CC can be accounted by slippage at microsatellite marker F5225, and haplotype AT2CT may be accounted by C-to-T mutations at the CS2 CpG dinucleotide or by recombination. Linkage disequilibrium with haplotypes AT2CC, AT3CC, and AT2CT, which account for ≈80% of LN and E alleles and only 4% of SN alleles, therefore represents a founder event that is related to the transition from a SN to a LN GAA repeat, which in turn served as a pool for further repeat length variations, including transition to disease-causing expansions. Most or all of the remaining few haplotypes that were found associated with GAA expansion may also derive from the same founder haplotype. Most can be accounted by a single event occurring on the AT2CC haplotype, either by slippage at the F5225 microsatellite (AT1CC) or by distal recombination either with the distant FAD1 marker (CT2CC) or with marker ITR4, which is ≈40 kb telomeric to the GAA repeat (CC2CC, AC2CC). Recombination can indeed occur between FAD1 or CS2 and the intragenic markers as indicated by their linkage equilibrium with adjacent markers on the SN alleles. The other rare haplotypes might be related by double mutational or recombination events on the AT2CC haplotype because they always share allele T at ITR4 and allele C at ITR3. It is interesting to note that the smallest linkage disequilibrium was observed for the microsatellite F5225 and the CS2 CpG polymorphism, which are only 25 kb telomeric and 40 kb centromeric to the GAA repeat. This is most likely due to the relative instability of such markers. Although the greater informativeness of microsatellites is an asset in linkage studies, they are not as reliable as biallelic markers for linkage disequilibrium studies related to ancient events. The frequency of the LN alleles in the normal population (17%) indicates that the initial founder event is very ancient. We indeed found similar haplotypes (AT[2/3]C[C/T]) in a small number of North African and Yemenite individuals carrying LN or expanded alleles. This suggests that the founder event dates before the split of these populations.
We found no significant difference between haplotype distribution of LN alleles and expansions. Although the number of haplotypes tested is still relatively small, this suggests that unstable alleles derive from LN alleles by recurrent events rather than by a very small number of secondary founder events. On the other hand, the previous finding of significant linkage disequilibrium with markers located 700 to 500 kb from the GAA in French, Italian, Tunisian, Reunion island, and Cajun patients (12, 14, 36) suggests that such secondary events generating unstable alleles (premutated) are not very frequent. By comparison with estimates made on the age of BRCA1 mutations showing linkage disequilibrium over comparable distances (37), we suggest that the secondary events accounting for the most frequent extended haplotypes seen in FRDA patients of such populations could be at least 30 generations old.
We have identified, in two families, alleles at 42 and 60 GAA that have undergone expansion to pathological size in a single paternal transmission. In one of the two families, a 38-GAA allele expanded to 62 by maternal transmission. This gives a lower size limit for the truly unstable alleles that appear to be in the same range than for myotonic dystrophy (38) or pure CGG repeats (39, 40) in fragile X syndrome. These two families, selected by the occurrence of affected siblings, may however not be representative of premutation instability but rather represent extreme cases of dramatic size change between two generations. Because of this selection bias, it is not possible to infer the risk of alleles in the premutated size range to expand during offspring transmission. Other factors may influence stability; we observed a fairly stable transmission of a ≈112 pure GAA repeat through two generations, indicating that not all GAA premutations or small expansions undergo important size increase. However the GAA repeats of this stable allele were interrupted by a (GAAAGAA)2 sequence that might stabilize the expansion. It remains to be seen whether there are significant parental sex differences in the instability of such alleles.
We have shown that the FRDA expansion mutations are derived from a pool of LN alleles that accounts for ≈17% of the normal alleles in Caucasian population. In dominant expansion diseases such as myotonic dystrophy, Huntington disease or DRPLA or in the fragile X syndrome, the frequency of the disease in a given population is correlated with the frequency of the LN alleles (29, 31, 33, 34, 41). However, in these diseases, there is a significant decrease of genetic fitness in carriers of pathological alleles, which is not the case in a recessive disease. It will thus be of interest to see if there is population variation in the frequency of the LN alleles at the FRDA locus and if this is correlated with the disease frequency. If the correlation is poor, this would suggest that the transition of a LN allele to an unstable one is a very limiting step. It will be important to test if, in non-Caucasian populations, FRDA also is caused predominantly by GAA expansions, as point mutations in the gene can have the same consequences, and whether such expansions share the same ancestral haplotype. In conclusion, despite the different nature of the repeat, we can conclude that the repeat size ranges showing instability at the population level (reservoir for recurrent mutations) or showing instability within a family are very similar in FRDA and in the fragile X syndrome, myotonic dystrophy, and the CAG/polyglutamine expansion diseases.
Acknowledgments
We thank F. Plewniak for his help in statistical analysis, S. Vicaire for sequencing, F. Ruffenach for oligonucleotide synthesis, and V. Biancalana and J. C. Bouix. We are grateful to the clinicians who referred their patients to us, particularly A. Brice, A. Dürr, F. Carteau, E. Bieth, and P. Trouillas. This work was supported by funds from the Association Française contre les Myopathies, Centre National de la Recherche Scientifique, Institut National de la Santé et de la Recherche Médicale, Centre Hospitalier Régional Universitaire de Strasbourg and the Ministère de l’Enseignement Supérieur et de la Recherche. M.C. was a recipient of a fellowship from the Association Française Contre les Myopathies. V.C. was a recipient of a fellowship of the European Community. C.M. was a recipient of a fellowship of the Association pour la Recherche sur le Cancer.
ABBREVIATIONS
- FRDA
Friedreich’s ataxia
- CEPH
Centre d’Étude du Polymorphisme Humain
- SN
small normal
- LN
large normal
- E
expanded GAA repeat
References
- 1.Skre H. Epidemiology of Spinocerebellar Degeneration in Western Norway: Hereditary Diseases. Tokyo: Univ. of Tokyo Press; 1980. p. 103. [Google Scholar]
- 2.Campanella G, Filla A, De Falco F, Mansi D, Durivage A, Barbeau A. Can J Neurol Sci. 1980;7:351–357. doi: 10.1017/s0317167100022873. [DOI] [PubMed] [Google Scholar]
- 3.Winter R M, Harding A E, Baraitser M, Bravery M B. Clin Genet. 1981;20:419–427. doi: 10.1111/j.1399-0004.1981.tb01052.x. [DOI] [PubMed] [Google Scholar]
- 4.Romeo G, Menozzi P, Ferlini A, Fadda S, Di Donato S, Uziel G, Lucci B. Am J Hum Genet. 1983;35:523–529. [PMC free article] [PubMed] [Google Scholar]
- 5.Leone M, Brignolio F, Rosso M G, Curtoni E S, Moroni A, Tribolo A, Schiffer D. Clin Genet. 1990;38:161–169. doi: 10.1111/j.1399-0004.1990.tb03566.x. [DOI] [PubMed] [Google Scholar]
- 6.Campuzano V, Montermini L, Moltó M D, Pianese L, Cossée M, et al. Science. 1996;271:1423–1427. doi: 10.1126/science.271.5254.1423. [DOI] [PubMed] [Google Scholar]
- 7.Dürr A, Cossée M, Agid Y, Campuzano V, Mignard C, Penet C, Mandel J-L, Brice A, Koenig M. N Engl J Med. 1996;335:1169–1175. doi: 10.1056/NEJM199610173351601. [DOI] [PubMed] [Google Scholar]
- 8.Filla A, De Michele G, Cavalcanti F, Pianese L, Monticelli A, Campanella G, Cocozza S. Am J Hum Genet. 1996;59:554–560. [PMC free article] [PubMed] [Google Scholar]
- 9.Paulson H L, Fischbeck K H. Annu Rev Neurosci. 1996;19:79–107. doi: 10.1146/annurev.ne.19.030196.000455. [DOI] [PubMed] [Google Scholar]
- 10.Richards R I, Holman K, Friend K, Kremer E, Hillen D, Staples A, Brown W T, Goonewardena P, Tarleton J, Schwartz C, Sutherland G R. Nat Genet. 1992;1:257–260. doi: 10.1038/ng0792-257. [DOI] [PubMed] [Google Scholar]
- 11.Imbert G, Kretz C, Johnson K, Mandel J-L. Nat Genet. 1993;4:72–76. doi: 10.1038/ng0593-72. [DOI] [PubMed] [Google Scholar]
- 12.Fujita R, Hanauer A, Sirugo G, Heilig R, Mandel J L. Proc Natl Acad Sci USA. 1990;87:1796–1800. doi: 10.1073/pnas.87.5.1796. [DOI] [PMC free article] [PubMed] [Google Scholar]
- 13.Pandolfo M, Sirugo G, Antonelli A, Weitnauer L, Ferreti L, Leone M, Dones I, Cerino A, Fujita R, Hanauer A, Mandel J-L, Di Donato S. Am J Hum Genet. 1990;47:228–235. [PMC free article] [PubMed] [Google Scholar]
- 14.Sirugo G, Cocoza S, Mandel J L, Brice A, Cavalcanti F, De Michele G, Dones I, Filla A, Koenig M, Lorenzetti D, Monticelli A, Pianese L, Redolfi E, Rousseau F, Di Donato S, Pandolfo M. Eur J Hum Genet. 1993;1:133–143. doi: 10.1159/000472400. [DOI] [PubMed] [Google Scholar]
- 15.Monros E, Cañizares J, Moltó M D, Rodius F, Montermini L, Cossée M, Martinez F, Smeyers P, Prieto F, de Frutos R, Koenig M, Pandolfo M, Bertranpetit J, Palau F. Eur J Hum Genet. 1996;4:191–198. doi: 10.1159/000472198. [DOI] [PubMed] [Google Scholar]
- 16.Duclos F, Rodius F, Wrogemann K, Mandel J-L, Koenig M. Hum Mol Genet. 1994;3:909–914. doi: 10.1093/hmg/3.6.909. [DOI] [PubMed] [Google Scholar]
- 17.Montermini L, Rodius F, Pianese L, Moltó M D, Cossée M, Campuzano V, Cavalcanti F, Monticelli A, Palau F, Gyapay G, Wenhert M, Zara F, Patel P I, Cocozza S, Koenig M, Pandolfo M. Am J Hum Genet. 1995;57:1061–1067. [PMC free article] [PubMed] [Google Scholar]
- 18.Sambrook J, Fritsch E F, Maniatis T. Molecular Cloning: A Laboratory Manual. Plainview, NY: Cold Spring Harbor Lab. Press; 1989. [Google Scholar]
- 19.Stoneking M, Hedgecock D, Higuchi R G, Vigilant L, Erlich H A. Am J Hum Genet. 1991;48:370–382. [PMC free article] [PubMed] [Google Scholar]
- 20.Oudet C, Mornet E, Serre J L, Thomas F, Lentes-Zengerling S, Kretz C, Deluchat C, Tejada I, Boue J, Boue A, Mandel J L. Am J Hum Genet. 1993;52:297–304. [PMC free article] [PubMed] [Google Scholar]
- 21.Oudet C, von Koskull H, Nordstrom A M, Peippo M, Mandel J L. Eur J Hum Genet. 1993;1:181–189. doi: 10.1159/000472412. [DOI] [PubMed] [Google Scholar]
- 22.Mahadevan M S, Foitzik M A, Surh L C, Korneluk R G. Genomics. 1993;15:446–448. doi: 10.1006/geno.1993.1087. [DOI] [PubMed] [Google Scholar]
- 23.Harley H G, Brook J D, Floyd J, Rundle S A, Crow S, Walsh K V, Thibault M C, Harper P S, Shaw D J. Am J Hum Genet. 1991;49:68–75. [PMC free article] [PubMed] [Google Scholar]
- 24.Yamagata H, Miki T, Nakagawa M, Johnson K, Deka R, Ogihara T. Hum Genet. 1996;97:145–147. doi: 10.1007/BF02265255. [DOI] [PubMed] [Google Scholar]
- 25.MacDonald M E, Novelletto A, Lin C, Tagle D, Barnes G, Bates G, Taylor S, Allitto B, Altherr M, Myers R, Lehrach H, Collins F S, Wasmuth J J, Frontali M, Gusella J F. Nat Genet. 1992;1:99–103. doi: 10.1038/ng0592-99. [DOI] [PubMed] [Google Scholar]
- 26.Barron L H, Rae A, Holloway S, Brock D J, Warner J P. Hum Mol Genet. 1994;3:173–175. doi: 10.1093/hmg/3.1.173. [DOI] [PubMed] [Google Scholar]
- 27.Kunst C B, Warren S T. Cell. 1994;77:853–861. doi: 10.1016/0092-8674(94)90134-1. [DOI] [PubMed] [Google Scholar]
- 28.Neville C E, Mahadevan M S, Barcelo J M, Korneluk R G. Hum Mol Genet. 1994;3:45–51. doi: 10.1093/hmg/3.1.45. [DOI] [PubMed] [Google Scholar]
- 29.Squitieri F, Andrew S E, Goldberg Y P, Kremer B, Spence N, et al. Hum Mol Genet. 1994;3:2103–2114. doi: 10.1093/hmg/3.12.2103. [DOI] [PubMed] [Google Scholar]
- 30.Rubinsztein D C, Leggo J, Goodburn S, Barton D E, Ferguson-Smith M A. Hum Mol Genet. 1995;4:203–206. doi: 10.1093/hmg/4.2.203. [DOI] [PubMed] [Google Scholar]
- 31.Yanagisawa H, Fujii K, Nagafuchi S, Nakahori Y, Nakagome Y, et al. Hum Mol Genet. 1996;5:373–379. doi: 10.1093/hmg/5.3.373. [DOI] [PubMed] [Google Scholar]
- 32.Limprasert P, Nouri N, Rock A H, Nopparatana C, Kamonsilp M, Deininger P L, Keats B J B. Hum Mol Genet. 1996;5:207–213. doi: 10.1093/hmg/5.2.207. [DOI] [PubMed] [Google Scholar]
- 33.Novelli G, Spedini G, Destro-Bisol G, Gennarelli M, Fattorini C, Dallapiccola B. Hum Mutat. 1994;4:79–81. doi: 10.1002/humu.1380040115. [DOI] [PubMed] [Google Scholar]
- 34.Goldman A, Ramsay M, Jenkins T. J Med Genet. 1994;31:37–40. doi: 10.1136/jmg.31.1.37. [DOI] [PMC free article] [PubMed] [Google Scholar]
- 35.Harding A E. Brain. 1981;104:589–620. doi: 10.1093/brain/104.3.589. [DOI] [PubMed] [Google Scholar]
- 36.Rodius F, Duclos F, Wrogemann K, Le Paslier D, Ougen P, Billault A, Belal S, Musenger C, Brice A, Dürr A, Mignard C, Sirugo G, Weissenbach J, Cohen D, Hentati F, Ben Hamida M, Mandel J L, Koenig M. Am J Hum Genet. 1994;54:1050–1059. [PMC free article] [PubMed] [Google Scholar]
- 37.Neuhausen S L, Mazoyer S, Friedman L, Stratton M, Offit K, et al. Am J Hum Genet. 1996;58:271–280. [PMC free article] [PubMed] [Google Scholar]
- 38.Yamagata H, Miki T, Sakoda S, Yamanaka N, Davies J, Shelbourne P, Kubota R, Takenaga S, Nakagawa M, Ogihara T, Johnson K. Hum Mol Genet. 1994;3:819–820. doi: 10.1093/hmg/3.5.819. [DOI] [PubMed] [Google Scholar]
- 39.Eichler E E, Holden J J, Popovich B W, Reiss A L, Snow K, Thibodeau S N, Richards C S, Ward P A, Nelson D L. Nat Genet. 1994;8:88–94. doi: 10.1038/ng0994-88. [DOI] [PubMed] [Google Scholar]
- 40.Zhong N, Yang W, Dobkin C, Brown W T. Am J Hum Genet. 1995;57:351–361. [PMC free article] [PubMed] [Google Scholar]
- 41.Falik-Zaccai T C, Shachak E, Yalon M, Lis Z, Borochowitz Z, Macpherson J N, Nelson D L, Eichler E E. Am J Hum Genet. 1997;60:103–112. [PMC free article] [PubMed] [Google Scholar]