

Abstract
We applied a recently developed multilocus association testing method (localized haplotype clustering) to Wellcome Trust Case Control Consortium data (14,000 cases of seven common diseases and 3,000 shared controls genotyped on the Affymetrix 500K array). After rigorous data quality filtering, we identified three disease-associated loci with strong statistical support from localized haplotype cluster tests but with only marginal significance in single marker tests. These loci are chromosomes 10p15.1 with type 1 diabetes (p = 5.1 × 10⁻⁹), 12q15 with type 2 diabetes (p = 1.9 × 10⁻⁷) and 15q26.2 with hypertension (p = 2.8 × 10⁻⁸). We also detected the association of chromosome 9p21.3 with type 2 diabetes (p = 2.8 × 10⁻⁸), although this locus did not pass our stringent genotype quality filters. The association of 10p15.1 with type 1 diabetes and 9p21.3 with type 2 diabetes have both been replicated in other studies using independent data sets. Overall, localized haplotype cluster analysis had better success detecting disease associated variants than a previous single-marker analysis of imputed HapMap SNPs. We found that stringent application of quality score thresholds to genotype data substantially reduced false-positive results arising from genotype error. In addition, we demonstrate that it is possible to simultaneously phase 16,000 individuals genotyped on genome-wide data (450K markers) using the Beagle software package.
Keywords: Genome-wide association studies, whole genome association studies, genetic association testing, multilocus analysis, localized haplotype clustering, BEAGLE
Introduction
Single marker and multilocus association-testing methods are to some extent complementary, as single marker methods have good power to detect common disease-susceptibility variants while multilocus methods can have markedly higher power than single marker methods to detect low frequency disease-susceptibility variants (Schaid 2004). In previous work we investigated localized haplotype clustering, a multilocus method that for each marker creates a partition of the set of haplotypes based on local patterns of linkage disequilibrium (LD). Using simulated data we showed that testing both single markers and localized haplotype clusters for association with a disease gives increased power to detect low frequency disease susceptibility variants while maintaining power to detect high frequency disease susceptibility variants (Browning and Browning 2007a).
In this work we confirm the utility of localized haplotype cluster analysis using data from the Wellcome Trust Case Control Consortium (WTCCC) on 14,000 cases of 7 common diseases and 3,000 shared controls (The Wellcome Trust Case Control Consortium 2007). The diseases studied were bipolar disorder (BD), coronary artery disease (CAD), Crohn's disease (CD), hypertension (HT), rheumatoid arthritis (RA), type 1 diabetes (T1D), and type 2 diabetes (T2D). The WTCCC study used a significance threshold of 5 × 10⁻⁷ and identified 25 susceptibility loci with a significant p-value on an allelic or genotypic single marker test: 1 for BD, 1 for CAD, 9 for CD, 3 for RA, 7 for T1D, 3 for T2D, and 1 for RA + T1D (combined analysis). Using localized haplotype cluster analysis, we are able to identify an additional four loci that were not significantly associated in the WTCCC's primary analysis, but that have strong statistical support for association from localized haplotype cluster analysis: chromosome 10p15.1 with type 1 diabetes (p = 5.1 × 10⁻⁹), chromosome 15q26.2 with hypertension (p = 2.8 × 10⁻⁸), chromosome 12q15 with type 2 diabetes (p = 1.9 × 10⁻⁷) and chromosome 9p21.3 with type 2 diabetes (p = 2.8 × 10⁻⁸).
In our analysis we applied stringent quality control filters to remove most of the hundreds of significant results that were artifacts of differential genotyping error in cases and controls. While this was very successful in removing many artifacts, we expect it also removed a number of true signals. As a case in point, we have included a locus in chromosome 9p21.3 in our results that has been shown to be significantly associated with type 2 diabetes in several studies (Saxena et al. 2007; Scott et al. 2007; Zeggini et al. 2007). A localized haplotype cluster at this locus (localizing to SNP rs10811661) is significantly associated with type 2 diabetes in the WTCCC data (p = 2.8 × 10⁻⁸); however, this result did not pass our stringent quality control filters because one of the key markers had too much missing data.
We show that localized haplotype cluster analysis can have better success detecting disease associated variants than single-marker analysis of imputed SNPs, we demonstrate that the use of rigorous genotype quality control filters can substantially reduce the number of false positive associations due to genotyping artifacts, and we give a cautionary example demonstrating that some genotyping artifacts cannot be detected by visual inspection of genotype cluster plots. In addition we demonstrate that more than 16,000 individuals can be phased simultaneously on genome-wide data (450K markers) using the localized haplotype clustering-based haplotype inference method implemented in the Beagle software package.
Materials and Methods
Wellcome Trust Case Control Consortium study data (The Wellcome Trust Case Control Consortium 2007) were accessed from the Wellcome Trust Case Control Consortium web site in July 2007. There are 2000 individuals in each of the seven disease cohorts and 3000 common controls. Half of the controls are from the 1958 UK Birth Control Cohort (58C) and half are from the UK Blood Services (NBS).
The study participants were genotyped on the Affymetrix GeneChip® Human Mapping 500K Array Set (Matsuzaki et al. 2004), and genotypes were called using the Chiamo genotype calling algorithm (The Wellcome Trust Case Control Consortium 2007). Genotypes with less than 0.90 posterior probability were not called (i.e. set to missing) as suggested by the WTCCC. We excluded 815 individuals and 30,586 autosomal markers which failed to pass the WTCCC's quality control filters (The Wellcome Trust Case Control Consortium 2007). After the WTCCC's quality control filtering, the data set consisted of 16,179 individuals genotyped on 459,446 autosomal markers.
Haplotypic Analysis
Inference of haplotype phase, imputation of missing data, combined single marker and localized haplotype cluster association analysis, and permutation testing were performed using Beagle version 2.1.2 (Browning and Browning 2007a; Browning and Browning 2007b). For each chromosome, we inferred haplotype phase and imputed missing data for the entire set of 16,179 individuals simultaneously using Beagle, with 1 sample per individual and 10 (the default) number of iterations (Browning and Browning 2007b). Haplotype phasing was performed blind to trait and cohort status.
For each disease, we created a case-control data set using phased data for the disease cohort and for the two control cohorts (58C and NBS), and constructed a localized haplotype cluster model using Beagle with default parameters (Browning and Browning 2007a; Browning 2006). In a localized haplotype cluster model, each haplotype cluster is localized to a specific marker. At the k-th marker locus, the model clusters haplotypes which have similar probability distributions for their alleles at markers > k. For each cluster of haplotypes, cluster membership defines a diallelic marker since each haplotype in the sample is either present or absent from the cluster. Thus testing localized haplotype clusters for association with a trait status is conceptually equivalent to testing SNPs since the cluster is represented by a diallelic marker (Browning and Browning 2007a). Localized haplotype clusters can be tested using standard allelic and genotypic tests.
The construction of the localized haplotype cluster model from the phased haplotypes was performed blind to trait and cohort status. We tested the original markers and localized haplotype clusters for case-control allele frequency differences using Fisher's exact test. The total number of allelic tests performed for each disease was between 2.02 and 2.05 million of which 459,446 were single marker tests and approximately 1.5 million were localized haplotype cluster tests.
For each disease, we used 1000 permutations of the trait status to determine a multiple-testing adjusted p-value for each single marker and haplotype cluster test (Browning and Browning 2007a). The multiple-testing adjustment was applied separately to each disease, rather than to all tests over all diseases simultaneously, so it controls for multiple testing within each disease only. We identified all regions which contained at least one localized haplotype cluster with a multiple-testing adjusted p-value <0.2, but which contained no SNP whose allelic or genotypic test was significant at the p = 5 × 10⁻⁷ threshold used by the WTCCC. The multiple-testing adjusted p-value threshold of 0.2 corresponds to a slightly different nominal p-value for each disease, ranging between p = 2.0 × 10⁻⁷ and p=2.4 × 10⁻⁷.
Quality Control Filtering
We then subjected the identified regions to a series of increasingly stringent quality control filters. The filtering process is summarized by the flowchart in Figure 1.
Figure 1.

Flowchart summarizing the genotype quality filters applied to the data to screen out results that may be false positive due to poor genotype quality. A detailed description of each filter is given in the Materials and Methods section. The flowchart also shows the number of regions containing highly significant localized haplotype clusters after each filtering step; full details are given in the Results section.
Filter 1 used WTCCC genotype cluster summary data. The WTCCC had visually inspected approximately 100 SNPs per disease with apparent associations, and identified 578 SNPs with bad genotype clustering (of which 481 had p < 10-5 on a genotypic or allelic test for at least one disease). We excluded any region in which a haplotype cluster with a multiple-testing adjusted p-value < 0.2 localized to a marker which was within a radius of 10 markers from a SNP with bad genotype clustering identified by the WTCCC.
We applied Filter 2 to all regions which passed Filter 1. The WTCCC used the Chiamo program to call genotypes and reported that the best indicator of data quality for a SNP is the proportion of missing genotypes (The Wellcome Trust Case Control Consortium 2007). Previous work had shown that the Beagle haplotype phasing software can impute missing alleles in the WTCCC genotype data with >99.2% accuracy. So our second filter set all Chiamo genotypes with < 99% posterior probability to missing and then excluded markers with more than 2% missing data. The choice of a 2% missing threshold was motivated by the observation that cluster plots with obvious clustering problems tended to be associated with SNPs which had more than 2% missing data. To apply this filter we extracted the genotype data for the 251 markers which were in a 125 marker radius of the localized haplotype cluster giving the smallest allelic test p-value in the region. We set all genotypes in the 251 marker set with less than 0.99 posterior probability to missing, and we then excluded markers with more than 2% missing genotypes. We phased, imputed missing alleles, and tested extracted data for association with the trait status using Beagle with default parameters. Any region with no localized haplotype cluster allelic test p-value < 6 × 10⁻⁷ was discarded (a higher p-value threshold was used than in our primary analysis because discarding markers with >2% missing reduced the information content of the data). The analysis of these 251 marker sets differed from the primary analysis in some particulars: we required called genotypes to have a 0.99 probability (instead of a 0.9 probability), we excluded markers with more than 2% missing genotypes in addition to the markers excluded by the WTCCC, we phased only the disease cohort and the two control cohorts (instead of all nine cohorts), and we used default Beagle phasing parameters (four samples per individual instead of one sample per individual).
All regions which passed Filter 2 were then subjected to two additional quality control filters which gave similar results. For Filter 3A, we used R (R Development Core Team 2006) and the read.wtccc.signals() function in the snpMatrix R package (Clayton and Leung 2007) to create genotype cluster plots for the 21 markers in a 10 marker radius of the localized haplotype cluster in each region which gave the smallest allelic test p-value. We discarded any region with a genotype cluster plot that exhibited poor genotype clustering. For Filter 3B, we repeated Filter 2 with a lower missing genotype threshold. All markers in a 125 marker radius of the localized haplotype cluster with the smallest p-value in each region were extracted, all genotypes with less than 0.99 posterior probability (as reported by Chiamo) were set to missing, and markers with more than 0.5% missing genotypes were excluded. The filtered data were reanalyzed, and any region with no localized haplotype cluster allelic test p-value < 6 × 10⁻⁷ was discarded.
Results
The preliminary analysis identified 349 regions (18-89 regions/disease) which had an allelic localized haplotype cluster test with a multiple-testing adjusted p-value < 0.2, but which contained no single markers with an allelic or genotypic test p-value less than the WTCCC significant threshold of p = 5 × 10⁻⁷. Our haplotype phasing and model building were performed blind to trait status to avoid introducing artificial differences between cases and controls. Thus these results reflect real case-control differences in genotype data, although most are in fact due to differential genotyping bias between cases and controls (Clayton et al. 2005) rather than to association with a disease-susceptibility locus. Nonetheless, this successful identification of a large number of regions with genuine case-control differences confirms that localized haplotype cluster analysis is capable of detecting case-control differences that are not detectable with single-marker analysis.
Quality Control Filtering
The quality control filtering process is described in detail in the Materials and Methods section and the results of the filtering are summarized in Figure 1.
Filter 1 excluded 107 regions in which the localized haplotype cluster with smallest p-value was near one of the 578 SNPs with bad genotype cluster which had been identified by the WTCCC. In most instances the marker with bad genotype clustering is the same as the marker corresponding to the location of the localized haplotype cluster with the smallest p-value. This left 242 regions showing at least one haplotype cluster with multiple-testing adjusted p-value < 0.2.
Filter 2 involved reanalysis of the data after setting Chiamo genotypes with < 99% probability to missing and excluded markers with > 2% missing data. 219 regions that had markedly increased p-values were excluded, leaving 23 regions. The mean number of markers per 251 marker data set with > 2% missing data was 34 (range 19-49).
Filter 3A involved visual inspection of genotype cluster plots. We observed that if there was a bad cluster in a 10 marker radius of the signal, invariably the bad cluster was either the same marker as the localized haplotype cluster giving the signal or the immediately preceding marker. Five of the 23 regions had good clustering. In these five regions with good clustering only two SNPs had a Hardy-Weinberg equilibrium p-value < 0.01 in the 10-marker radius of the localized haplotype cluster with the smallest p-value, and both of these SNPs had more than 2% missing data and had been excluded by our second filter.
We also investigated whether we could achieve similar results without visual inspection of cluster plots by requiring more rigorous genotype quality filtering. Filter 3B resulted in an average of 102 of 251 markers being removed from each region (range 89-115). The 17 excluded regions had markedly increased p-values (p > 1.5 × 10⁻⁴), and the remaining 6 regions included the 5 regions with good genotype clustering that passed Filter 3A. So use of a stricter genotype quality threshold could have been used to substantially reduce the number of genotype cluster plots inspected, but stricter genotype quality filters would also be more likely to filter out true disease susceptibility variants. However, it is still possible for markers to have fewer than 0.5% genotypes with less than 99% probability and still exhibit bad clustering (see Supplementary Figure 1).
Additional Genotyping Artifacts
After careful examination we ruled out two of the five regions. These two regions were found on two different chromosomes for CAD and corresponded to a two and a three marker haplotype with localized haplotype cluster p-values of 1.5 × 10⁻⁷ and 1.9 × 10⁻⁸. The significant haplotype clusters contained 23 and 24 individuals, of whom 22 were cases in each cluster. Seventeen individuals (all affected individuals) were common to both haplotype clusters, even though the clusters were on different chromosomes. Consequently, these two regions almost certainly represent either an artifact or a strong interaction since the probability of this degree of overlap in independently selected subsets of individuals is miniscule. We think these two regions are an artifact since the genotype cluster plots show that the affected individuals in the significantly associated haplotype clusters appear to be over-represented on the extremities of the genotype clusters, for one marker in each haplotype. These two cluster plots are shown in Supplementary Figure 2. Interestingly, we also observed that 8 pairs of the 27 affected individuals in the union of these two clusters had consecutive sample identifiers, and for 7 of the 8 pairs, one or both individuals were from the North Midlands geographic region. Since four of the eight pairs were split between separate plates and the 27 affected individuals were distributed across 15 plates for genotyping, it is unlikely that plate effects explain this apparent artifact.
If we hadn't detected both of these CAD loci and noticed that the associated haplotype clusters shared many of the same individuals, these artifacts would have gone undetected in our analysis since the loci passed standard quality control filters based on proportion of missing data, HWE p-value, and visual inspection of clustering on genotype signal plots. For both loci, there is less than 0.5% missing data for the markers defining the haplotype, the markers are in HWE (p > 0.10), and the genotypes appear to cluster satisfactorily on the cluster plots.
Associated Regions
After discarding the two regions associated with CAD that appear to be artifacts, there are three remaining regions that showed association following our rigorous quality control filters. We will next examine these 3 associations along with a fourth region (9p21.3) associated with T2D. This fourth region is included as an example of a well-replicated association that has a highly significant p-value with Beagle, although failing to pass our stringent quality control filters, and that is not detected by single marker tests in these data. Figure 2 shows p-values for genotyped SNPs, imputed HapMap SNPs, and localized haplotype clusters in these 4 associated regions. P-values are calculated after excluding SNPs with > 2% of Chiamo genotypes having < 99% posterior probability (except for the 9p21.3 region for T2D where one of the key markers had 4% of genotypes with < 99% probability). All plots show 251 contiguous genotyped markers, except for chromosome 12q15 (T2D), for which one marker in the region was identified by the WTCCC as having bad clustering and was discarded (the marker with the bad genotype clustering was ∼100 markers away from the localized haplotype cluster with the signal). Table 1 gives the genomic region, allelic test p-value, allelic odds ratio and case and control frequency for the localized haplotype cluster showing strongest association in each region. For three of the four regions, the localized haplotype clusters showing the strongest association correspond to single haplotypes: the C-C haplotype for rs2104286 - rs12722489 (10p15.1; T1D), the C-A-A haplotype for rs11632637 - rs7182413 - rs11037474 (15q26.2; HT), and the G-A-T haplotype for rs2891169 - rs2383208 - rs10811661 (9p21.3; T2D). The localized haplotype cluster associated with T2D on chromosome 12q15 is not easily characterized due to the extensive LD in the region.
Figure 2.
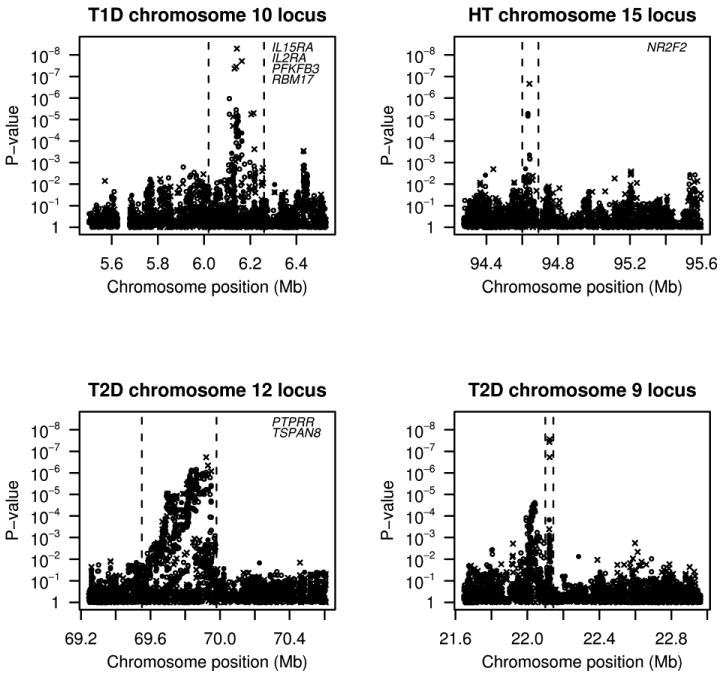
Single genotyped marker (filled circle), single imputed marker (open circle) and localized haplotype cluster (cross) p-values in 4 regions showing strong evidence of association between trait and localized haplotype clusters Allelic and genotypic test p-values are shown for single markers, and allelic test p-values are shown for localized haplotype clusters. All p-values were calculated using Fisher's exact test. . The candidate region, delimited by the dashed vertical lines, contains all markers that are in moderate to strong linkage disequilibrium with the signal based on pairwise linkage disequilibrium data and recombination hotspot data from phase 2 of the HapMap. Genes in each delimited candidate region are listed the upper right corner of the plot. Positions are in NCBI Build 35 coordinates.
Table 1.
Four genetic associations described in the Results section. The candidate regions are specified in NCBI Build 35 coordinates and contain all markers that are in moderate to strong linkage disequilibrium with the signal based on pairwise linkage disequilibrium data and recombination hotspot data from phase 2 of the HapMap. For each region, the localized haplotype cluster with the smallest allelic test p-value was selected and case and control allele counts for that cluster were used to calculate allelic odds ratios with 95% confidence intervals, and minor allele frequencies (MAF) in controls and cases.
| Trait | Chr | Region (Mb) | Allelic Test p-value | Odds Ratio | Control MAF | Case MAF |
|---|---|---|---|---|---|---|
| T1D | 10p15.1 | 6.02-6.26 | 5.10 × 10⁻⁹ | 0.66 (0.57-0.76) | 0.113 | 0.078 |
| HT | 15q26.2 | 94.60-94.69 | 2.19 × 10⁻⁷ | 0.76 (0.68-0.84) | 0.210 | 0.168 |
| T2D | 12q15 | 69.55-69.98 | 1.88 × 10⁻⁷ | 1.26 (1.15-1.37) | 0.314 | 0.365 |
| T2D | 9p21.3 | 22.11-22.13 | 2.79 × 10⁻⁸ | 1.30 (1.19-1.43) | 0.237 | 0.288 |
The association of variants in the IL2RA gene region in chromosome 10p15.1 with type 1 diabetes has been well established (Lowe et al. 2007; Qu et al. 2007; Vella et al. 2005). Although single marker allelic and genotypic tests of genotyped SNPs and imputed HapMap SNPs only showed marginal significance for this loci (genotyped SNP minimum p = 7.3 × 10⁻⁶; imputed SNP minimum p = 1.1 × 10⁻⁶), the localized haplotype cluster tests yielded strong evidence of association (p = 5.1 × 10⁻⁹) with a p-value more than 2 orders of magnitude smaller than the smallest single marker p-value in the region.
The second associated region (chromosome 15q26.2 with HT), contains only one gene, NR2F2 (nuclear receptor subfamily 2, group F, member 2). A study using the Dahl salt-sensitive rat has identified the homologous gene Nr2f2 as involved in control of blood pressure in the rat (Joe et al. 2005). The most significant localized haplotype cluster had an allelic test p-value of 2.2 × 10⁻⁷, and a p-value of 2.8 × 10⁻⁸ when heterozygotes and minor allele homozygotes were grouped together. For comparison, the smallest single marker p-value from a genotyped or imputed SNP in the region was a genotypic test p-value that was two orders of magnitude larger (p = 5.3 × 10⁻⁶).
The third associated region (chromosome 12q15 with T2D) has been implicated in two linkage scans of type 2 diabetes (Bektas et al. 2001; Ehm et al. 2000). Localized haplotype cluster analysis provided improved evidence for association (p = 1.88 × 10⁻⁷) to 12q15 compared to single marker tests (genotyped SNP minimum p = 1.5 × 10⁻⁶; imputed SNP minimum p = 7.0 × 10⁻⁷). Initial replication studies of this region have not found association: data from two UK cohorts for five SNPs (Zeggini et al. 2007) and from two Finnish cohorts for one SNP (Scott et al. 2007) did not show significant association with type 2 diabetes at the 0.05 level.
The fourth associated region (chromosome 9p21.3 with T2D) has been convincingly replicated in several independent data sets (Saxena et al. 2007; Scott et al. 2007; Zeggini et al. 2007). For the WTCCC data in this region, the smallest single marker p-values were non-significant in the context of a genomewide study (genotyped SNP minimum p = 1.5 × 10⁻⁴; imputed SNP minimum p = 2.4 × 10⁻⁵), but the minimum localized haplotype cluster p-value (p= 2.8 × 10⁻⁸) was significantly associated after adjusting for all single marker tests of genotyped SNPs and all localized haplotype cluster tests (multiple testing adjusted p < 0.05).
Discussion
Localized haplotype cluster analysis identified four regions with significant (p < 3 × 10⁻⁷) or highly significant (p < 3 × 10⁻⁸) associations that were only marginally significant (p > 5 × 10⁻⁷) using single marker tests of genotyped and imputed SNPs. Performing localized haplotype cluster tests in addition to single marker tests of genotyped markers increased the number of tests by a factor of 4.5, but decreased the minimum p-values in these four regions by factors of 8, 200, 1400, and 5000.
Three of these associations passed our stringent quality control filters and are unlikely to be a consequence of genotyping artifacts. The genotype cluster plots within a 10 marker radius of the strongest signal were visually inspected and all three regions showed good clustering. Furthermore, the signal was still present after requiring called genotypes to have 99% posterior probability and removing markers with more than 0.5% missing genotypes. The WTCCC found very little evidence of population stratification in their extensive analysis. So we believe that these results are unlikely to be artifacts of population stratification. We also note that each of these three regions has either been replicated or has additional evidence for association from previous studies. The fourth association (9p21.3 with diabetes) did not pass our rigorous quality control filters, but is unlikely to be a genotyping artifact because it has been well-replicated in independent studies using a variety of genotyping platforms (Saxena et al. 2007; Scott et al. 2007; Zeggini et al. 2007).
In our analysis, we have used the most likely haplotype for each individual conditional on the individual's genotype data and the haplotype model. The results from the current study demonstrate that the most likely inferred haplotypes for this data set are sufficiently accurate to detect associations without incorporating phase uncertainty into the analysis.
In this study we restricted our focus to regions which did not show significant association (p < 5 × 10⁻⁷) in single marker tests. However, localized haplotype cluster analysis should be viewed as a complement to single marker analysis, not a replacement for single marker analysis (Browning and Browning 2007a). For example, some of the significant regions identified by single marker analysis of the WTCCC data were not significantly associated with a localized haplotype cluster at the 5 × 10⁻⁷ significance threshold.
Comparison with Analysis of Imputed HapMap SNPs
Recently, there has been interest in multilocus methods which impute data for ungenotyped markers that have been genotyped on a reference panel, such as the HapMap SNPs. The imputed data for the ungenotyped markers are then tested for association with a trait. The WTCCC performed an imputation-based analysis (Marchini et al. 2007; The Wellcome Trust Case Control Consortium 2007). Phased haplotypes obtained from phase 2 of the HapMap (The International HapMap Consortium 2007) were used to impute SNPs that were present in the phased haplotypes, but not in the Affymetrix 500K array. The imputation approach had limited success detecting disease associated variants when applied to the WTCCC data. It identified two regions which had no single marker p-values less than their 5 × 10⁻⁷ threshold, but at least one imputed marker p-value less than this threshold. The imputation gave a trivial decrease in single marker p-values in one of these regions (from p = 5.0 × 10⁻⁷ to 4.5 × 10⁻⁷). In the other region there was a larger change, from a genotyped marker p-value of 7.2 × 10⁻⁷ to an imputed marker p-value of 5.1 × 10⁻⁸ (The Wellcome Trust Case Control Consortium 2007), but replication studies of the imputed SNP in the second region have given inconsistent results (Lowe et al. 2007). Interestingly, the number of single markers tested by the imputation approach was 2.1M which is approximately the same as the total number of tests (single markers and localized haplotype clusters) performed by Beagle, yet imputation was not able to find significant association for four regions in this data set which were detected by localized haplotype cluster analysis (see Figure 2). Two of these four regions have been convincingly replicated: the IL2RA gene region in chromosome 10p15.1 associated with type 1 diabetes (Lowe et al. 2007; Qu et al. 2007; Vella et al. 2005) and the chromosome 9p21.3 region associated with type 2 diabetes (Saxena et al. 2007; Scott et al. 2007; Zeggini et al. 2007). Thus the localized haplotype cluster analysis had greater success detecting disease-associated variants than the analysis of non-genotyped, imputed HapMap SNPs: a greater number of truly associated regions were identified and the localized haplotype clusters had a much more marked decrease in p-values relative to single marker analysis.
Although imputation analysis and localized haplotype cluster analysis are both multilocus analyses, they should be viewed as complementary analyses with important differences. Imputation analysis tests for association with known variants, while localized haplotype cluster analysis tests for association with haplotype clusters that are proxies for variants that can be either known or unknown. Although knowledge of variation in the genome is improving rapidly, it is still limited at present, and our analysis indicates there are benefits to employing methods designed to detect “unknown” variants. For example, according to supplementary information in Zeggini et al. (2007), the haplotype in chromosome 9p21.3 that is associated with type 2 diabetes cannot be accounted for by any single SNP genotyped in the in the Caucasian HapMap samples. The p-values from single marker tests of association with type 2 diabetes in 9p21.3 were unremarkable for both genotyped SNPs (p > 10-4) and imputed HapMap SNPs (p > 10-5) in the context of a genome-wide study, whereas the localized haplotype cluster test result was highly significant (p = 2.8 × 10⁻⁸, multiple testing adjusted p < 0.05). The association detected between 9p21.3 and type 2 diabetes demonstrates that localized haplotype cluster analysis can detect additional disease-associated variants that are not detected by HapMap-based imputation analysis.
Another difference between HapMap-based imputation analysis and localized haplotype cluster analysis is related to marker ascertainment. The SNPs genotyped in the HapMap are enriched for high frequency variants (The International HapMap Consortium 2007), and so multilocus imputation methods that impute SNPs genotyped in the HapMap may not yield substantial power to detect low frequency susceptibility variants. Servin and Stephens (2007) found that imputation was not powerful for detecting untyped low frequency (< 5%) variants. In contrast, previous work has shown that localized haplotype cluster analysis is particularly powerful to detect low frequency susceptibility variants, and consequently should generally be combined with single marker analysis (Browning and Browning 2007a).
Of these differences, we believe the first one (limited knowledge of genotype variation) is the most likely explanation for the greater success of localized haplotype clustering relative to imputation seen in our results. The four significant localized haplotype clusters that were not detected through single marker tests of genotyped and imputed SNPs are not particularly rare (Table 1).
This study demonstrates that localized haplotype cluster analysis can identify additional associated regions that are not detected by single marker tests using whole genome association study data. Our intention was to demonstrate the utility of localized haplotype cluster analysis. Undoubtedly, additional associated variants could be found by using less stringent quality control filters. We only considered loci with which were also associated after excluding markers which had more than 2% of genotypes with posterior probability < 0.99. Use of genotypic tests in addition to allelic tests and use of more liberal genotype quality filters would result in fewer disease-associated variants escaping our net, but one would expect that a larger number of genotyping artifacts would need to be identified by visual inspection of genotype cluster plots or by genotyping using an alternative genotype assay.
Supplementary Material
Acknowledgments
This study makes use of data generated by the Wellcome Trust Case Control Consortium. A full list of the investigators who contributed to the generation of the data is available from www.wtccc.org.uk. Funding for the Wellcome Trust Case Control Consortium project was provided by the Wellcome Trust under award 076113.
The authors thank three anonymous reviewers for their comments which helped improve the manuscript, Werner Schmidt for his patient assistance with our demanding computing requirements and Hin-Tak Leung for pointing us to his software for creating genotype cluster plots for the WTCCC data set. This work was supported by a grant from the University of Auckland Research Committee (SRB), and by NIH grant 3R01GM075091-02S1 (SRB and BLB).
Nutrigenomics New Zealand is a collaboration between AgResearch Ltd., Crop & Food Research, HortResearch and The University of Auckland, with funding through the Foundation for Research Science and Technology.
Footnotes
WEB RESOURCES
http://www.stat.auckland.ac.nz/∼browning/beagle/beagle.html (Beagle website).
http://www.wtccc.org (the Wellcome Trust Case Control Consortium web site).
This manuscript is a preprint of an article published online by Human Genetics on 26 Jan 2008 [Epub ahead of print]. The published version can be downloaded from http://dx.doi.org/10.1007/s00439-008-0472-1 or from www.springerlink.com.
References
- Bektas A, Hughes JN, Warram JH, Krolewski AS, Doria A. Type 2 diabetes locus on 12q15. Further mapping and mutation screening of two candidate genes. Diabetes. 2001;50:204–8. doi: 10.2337/diabetes.50.1.204. [DOI] [PubMed] [Google Scholar]
- Browning BL, Browning SR. Efficient multilocus association testing for whole genome association studies using localized haplotype clustering. Genet Epidemiol. 2007a;31:365–75. doi: 10.1002/gepi.20216. [DOI] [PubMed] [Google Scholar]
- Browning SR. Multilocus association mapping using variable-length Markov chains. Am J Hum Genet. 2006;78:903–13. doi: 10.1086/503876. [DOI] [PMC free article] [PubMed] [Google Scholar]
- Browning SR, Browning BL. Rapid and accurate haplotype phasing and missing-data inference for whole-genome association studies by use of localized haplotype clustering. Am J Hum Genet. 2007b;81:1084–97. doi: 10.1086/521987. [DOI] [PMC free article] [PubMed] [Google Scholar]
- Clayton D, Leung HT. An R package for analysis of whole-genome association studies. Hum Hered. 2007;64:45–51. doi: 10.1159/000101422. [DOI] [PubMed] [Google Scholar]
- Clayton DG, Walker NM, Smyth DJ, Pask R, Cooper JD, Maier LM, Smink LJ, Lam AC, Ovington NR, Stevens HE, Nutland S, Howson JM, Faham M, Moorhead M, Jones HB, Falkowski M, Hardenbol P, Willis TD, Todd JA. Population structure, differential bias and genomic control in a large-scale, case-control association study. Nat Genet. 2005;37:1243–6. doi: 10.1038/ng1653. [DOI] [PubMed] [Google Scholar]
- Ehm MG, Karnoub MC, Sakul H, Gottschalk K, Holt DC, Weber JL, Vaske D, Briley D, Briley L, Kopf J, McMillen P, Nguyen Q, Reisman M, Lai EH, Joslyn G, Shepherd NS, Bell C, Wagner MJ, Burns DK. Genomewide search for type 2 diabetes susceptibility genes in four American populations. Am J Hum Genet. 2000;66:1871–81. doi: 10.1086/302950. [DOI] [PMC free article] [PubMed] [Google Scholar]
- Joe B, Letwin NE, Garrett MR, Dhindaw S, Frank B, Sultana R, Verratti K, Rapp JP, Lee NH. Transcriptional profiling with a blood pressure QTL interval-specific oligonucleotide array. Physiol Genomics. 2005;23:318–26. doi: 10.1152/physiolgenomics.00164.2004. [DOI] [PubMed] [Google Scholar]
- Lowe CE, Cooper JD, Brusko T, Walker NM, Smyth DJ, Bailey R, Bourget K, Plagnol V, Field S, Atkinson M, Clayton DG, Wicker LS, Todd JA. Large-scale genetic fine mapping and genotype-phenotype associations implicate polymorphism in the IL2RA region in type 1 diabetes. Nat Genet. 2007;39:1074–1082. doi: 10.1038/ng2102. [DOI] [PubMed] [Google Scholar]
- Marchini J, Howie B, Myers S, McVean G, Donnelly P. A new multipoint method for genome-wide association studies by imputation of genotypes. Nat Genet. 2007;39:906–13. doi: 10.1038/ng2088. [DOI] [PubMed] [Google Scholar]
- Matsuzaki H, Dong S, Loi H, Di X, Liu G, Hubbell E, Law J, Berntsen T, Chadha M, Hui H, Yang G, Kennedy GC, Webster TA, Cawley S, Walsh PS, Jones KW, Fodor SP, Mei R. Genotyping over 100,000 SNPs on a pair of oligonucleotide arrays. Nat Methods. 2004;1:109–11. doi: 10.1038/nmeth718. [DOI] [PubMed] [Google Scholar]
- Qu HQ, Montpetit A, Ge B, Hudson TJ, Polychronakos C. Toward further mapping of the association between the IL2RA locus and type 1 diabetes. Diabetes. 2007;56:1174–6. doi: 10.2337/db06-1555. [DOI] [PubMed] [Google Scholar]
- R Development Core Team. R: A Language and Environment for Statistical Computing. R Foundation for Statistical Computing; Vienna, Austria: 2006. [Google Scholar]
- Saxena R, Voight BF, Lyssenko V, Burtt NP, de Bakker PI, Chen H, Roix JJ, Kathiresan S, Hirschhorn JN, Daly MJ, Hughes TE, Groop L, Altshuler D, Almgren P, Florez JC, Meyer J, Ardlie K, Bengtsson Bostrom K, Isomaa B, Lettre G, Lindblad U, Lyon HN, Melander O, Newton-Cheh C, Nilsson P, Orho-Melander M, Rastam L, Speliotes EK, Taskinen MR, Tuomi T, Guiducci C, Berglund A, Carlson J, Gianniny L, Hackett R, Hall L, Holmkvist J, Laurila E, Sjogren M, Sterner M, Surti A, Svensson M, Svensson M, Tewhey R, Blumenstiel B, Parkin M, Defelice M, Barry R, Brodeur W, Camarata J, Chia N, Fava M, Gibbons J, Handsaker B, Healy C, Nguyen K, Gates C, Sougnez C, Gage D, Nizzari M, Gabriel SB, Chirn GW, Ma Q, Parikh H, Richardson D, Ricke D, Purcell S. Genome-wide association analysis identifies loci for type 2 diabetes and triglyceride levels. Science. 2007;316:1331–6. doi: 10.1126/science.1142358. [DOI] [PubMed] [Google Scholar]
- Schaid DJ. Evaluating associations of haplotypes with traits. Genet Epidemiol. 2004;27:348–64. doi: 10.1002/gepi.20037. [DOI] [PubMed] [Google Scholar]
- Scott LJ, Mohlke KL, Bonnycastle LL, Willer CJ, Li Y, Duren WL, Erdos MR, Stringham HM, Chines PS, Jackson AU, Prokunina-Olsson L, Ding CJ, Swift AJ, Narisu N, Hu T, Pruim R, Xiao R, Li XY, Conneely KN, Riebow NL, Sprau AG, Tong M, White PP, Hetrick KN, Barnhart MW, Bark CW, Goldstein JL, Watkins L, Xiang F, Saramies J, Buchanan TA, Watanabe RM, Valle TT, Kinnunen L, Abecasis GR, Pugh EW, Doheny KF, Bergman RN, Tuomilehto J, Collins FS, Boehnke M. A genome-wide association study of type 2 diabetes in Finns detects multiple susceptibility variants. Science. 2007;316:1341–5. doi: 10.1126/science.1142382. [DOI] [PMC free article] [PubMed] [Google Scholar]
- Servin B, Stephens M. Imputation-based analysis of association studies: candidate regions and quantitative traits. PLoS Genet. 2007;3:e114. doi: 10.1371/journal.pgen.0030114. [DOI] [PMC free article] [PubMed] [Google Scholar]
- The International HapMap Consortium A second generation human haplotype map of over 3.1 million SNPs. Nature. 2007;449:851–61. doi: 10.1038/nature06258. [DOI] [PMC free article] [PubMed] [Google Scholar]
- The Wellcome Trust Case Control Consortium Genome-wide association study of 14,000 cases of seven common diseases and 3,000 shared controls. Nature. 2007;447:661–78. doi: 10.1038/nature05911. [DOI] [PMC free article] [PubMed] [Google Scholar]
- Vella A, Cooper JD, Lowe CE, Walker N, Nutland S, Widmer B, Jones R, Ring SM, McArdle W, Pembrey ME, Strachan DP, Dunger DB, Twells RC, Clayton DG, Todd JA. Localization of a type 1 diabetes locus in the IL2RA/CD25 region by use of tag single-nucleotide polymorphisms. Am J Hum Genet. 2005;76:773–9. doi: 10.1086/429843. [DOI] [PMC free article] [PubMed] [Google Scholar]
- Zeggini E, Weedon MN, Lindgren CM, Frayling TM, Elliott KS, Lango H, Timpson NJ, Perry JR, Rayner NW, Freathy RM, Barrett JC, Shields B, Morris AP, Ellard S, Groves CJ, Harries LW, Marchini JL, Owen KR, Knight B, Cardon LR, Walker M, Hitman GA, Morris AD, Doney AS, McCarthy MI, Hattersley AT. Replication of genome-wide association signals in UK samples reveals risk loci for type 2 diabetes. Science. 2007;316:1336–41. doi: 10.1126/science.1142364. [DOI] [PMC free article] [PubMed] [Google Scholar]
Associated Data
This section collects any data citations, data availability statements, or supplementary materials included in this article.