

Abstract
The iron-regulated surface determinants (Isd) of Staphylococcus aureus, including surface proteins IsdA, IsdB, IsdC, and IsdH and ATP-binding cassette transporter IsdDEF, constitute the machinery for acquiring heme as a preferred iron source. Herein we report hemin transfer from hemin-containing IsdA (holoIsdA) to hemin-free IsdC (apoIsdC). The reaction has an equilibrium constant of 10 ± 5 at 22°C in favor of holoIsdC formation. During the reaction, holoIsdA binds to apoIsdC and then transfers the cofactor to apoIsdC with a rate constant of 54.3 ± 1.8 s−1 at 25°C. The transfer rate is >70,000 times greater than the rate of simple hemin dissociation from holoIsdA into solvent (ktransfer = 54.3 s−1 versus k-hemin = 0.00076 s−1). The standard free energy change, ΔG°, is −27 kJ/mol for the formation of the holoIsdA:apoIsdC complex. IsdC has a higher affinity for hemin than IsdA. These results indicate that the IsdA-to-IsdC hemin transfer is through the activated holoIsdA:apoIsdC complex and is driven by the higher affinity of apoIsdC for the cofactor. These findings demonstrate, for the first time in the Isd system, that heme transfer is rapid, direct, and affinity-driven from IsdA to IsdC. These results also provide the first example of heme transfer from one surface protein to another surface protein in Gram-positive bacteria, and perhaps most importantly, indicate that the mechanism of activated heme transfer, which we previously demonstrated between the streptococcal proteins Shp and HtsA, may apply in general to all bacterial heme transport systems.
Bacterial pathogens have evolved acquisition machinery for heme as a preferred source of essential iron. In Gram-negative pathogens, specific outer membrane receptors (1, 2) sequester heme from heme-hemophore complexes or host hemoproteins and bring it into the periplasmic space in a TonB-dependent process (3). Specific ATP-binding cassette (ABC) transporters then transport heme across the cytoplasmic membrane (4). A heme-specific ABC transporter is also a component of the heme acquisition machinery in Gram-positive pathogens such as Corynebacterium diphtheriae (5), Streptococcus pyogenes (6, 7), Staphylococcus aureus (8), and Streptococcus equi (9). In addition, cell-surface heme-binding proteins have been identified in S. pyogenes (10), S. aureus (11), Streptococcus equi (9), and Bacillus anthracis (12), suggesting that, besides ABC transporters, cell surface heme-binding proteins are required for heme acquisition by Gram-positive bacteria.
The S. aureus heme uptake system consists of the iron-regulated surface determinants (Isd)1, including the surface proteins IsdA, IsdB, IsdH or HarA, and IsdC, and ABC transporters IsdDEF and HtsABC (8, 11). The S. pyogenes heme uptake machinery consists of the surface proteins, Shr and Shp, and ABC transporter HtsABC (6, 7, 10, 13–16). The surface protein components, Shr and Shp of the GAS acquisition machinery and IsdA, IsdB, IsdH, and IsdC of the S. aureus system, do not share significant sequence homology. Thus, the S. pyogenes and S. aureus systems represent two distinct heme acquisition pathways in Gram-positive bacteria. The S. pyogenes system has a homologue in S. equi (9), while the homologue of the S. aureus system is present in Bacillus anthracis (12). These surface proteins, but not Shp, contain the NEAT (NEAr Transporter) domains (17), though the structure of the Shp heme-binding domain (18) is similar to that of the NEAT domains of IsdA (19) and IsdC (20).
Previous characterization of the Isd system from S. aureus indicated that the system takes up hemin as an iron source (11). IsdB is a hemoglobin receptor and is required for uptake of hemin from methemoglobin (21). IsdH binds haptoglobin-hemoglobin, though it appears not to be critical for using methemoglobin hemin as an iron source in vitro (22). IsdA and the B. anthracis homologue of IsdC are also important for hemin uptake (12, 19). IsdB, IsdA, and IsdC binds heme (11, 19, 20, 23, 24), and structural studies show that IsdA and IsdC bind hemin in a pentacoordinate complex with a tyrosine residue as the only axial ligand (19, 20), in contrast to the hexacoordination of the heme iron in Shp and HtsA (14, 15). It has been proposed that IsdH and IsdB capture haptoglobin-hemoglobin and hemoglobin, respectively, and heme is transferred from bound hemoglobin to IsdA, then IsdC, and finally to ABC transporters IsdDEF and/or HtsABC (25, 26). This hypothesis has not been experimentally tested, and little is known about the biochemical mechanism of heme acquisition by this system. This report describes the rapid and direct hemin transfer from holoIsdA to heme-free IsdC (apoIsdC). This affinity-driven transfer occurs in two steps, the formation of a holoIsdA:apoIsdC complex and subsequent hemin transfer. This study not only unveils the first hemin transfer reaction of the Isd system but also documents the first example of hemin transfer from one surface protein to another surface protein in Gram-positive bacteria.
EXPERIMENTAL PROCEDURES
Gene Cloning
The isdA and isdC genes were PCR-cloned from S. aureus subsp. aureus NW2 using paired primers 5′-TACCATGGACAG CCAACAAGTCAATGCG -3′/5′-TGAATTCTTAAGTTTTTGGTAATTGTTTAGC-3′ and 5′-ACCATGGATAGCGGTACTTTGAATTATG-3′/5′-AGAATTCTTATGTTTGTGGATTTTCTACTTT GTC-3′, respectively. The isdA and isdC PCR products were digested with NcoI/EcoRI and cloned into pET-His2 (6) at the same sites, yielding pISDA and pISDC. Recombinant IsdA and IsdC proteins produced from the constructs had 11 amino acid residues (MHHHHHHLETM) fused to Asp30 and Asp40, respectively, and lacked their transmembrane domain and charged tail at the C-terminus (amino acids 317-350 and 193-227 for IsdA and IsdC, respectively). Both gene clones were sequenced to rule out spurious mutations.
Protein Purification
Both IsdA and IsdC were expressed in Escherichia coli BL21 (DE3) containing pISDA and pISDC, respectively. Bacteria were grown at 37°C in 6 l of Luria-Bertani broth supplemented with 100 mg/l ampicillin to optical density at 600 nm of about 1.0, and the production of the proteins were induced by 0.4 mM isopropyl β-D-thiogalactopyranoside for 6 h. Bacteria were harvested by centrifugation. The bacterial pellet was suspended in 60 ml of 20 mM Tris-HCl, pH 8.0, and sonicated on ice for 15 min. IsdA and IsdC in the lysate were purified according to the manufacturer’s protocol using a Ni-NTA agarose column.
Preparation of ApoIsdA and ApoIsdC
Purified recombinant IsdC was a mixture of apo-form and a complex with iron-free protoporphyrin. To prepare apoIsdC, the mixture in 20 mM Tris-HCl, pH 8.0, was loaded onto a DEAE Sepharose column (1.5 × 5 cm). ApoIsdC was eluted with 30 mM NaCl in Tris-HCl, dialyzed against 3 l Tris-HCl. ApoIsdA was prepared using the methyl ethyl ketone method (27).
Preparation of HoloIsdA and HoloIsdC
HoloIsdC was obtained by reconstitution of its apo-form with hemin. One ml apoIsdC was incubated with excess hemin, loaded onto a Sephadex G-25 column (0.5 × 30 cm), and eluted with 10 mM Tris-HCl, pH 8.0. The holoprotein without free hemin was collected. Purified IsdA was a mixture of apo-and holo-forms. Homogeneous holoIsdA was similarly prepared by reconstituting apoIsdA in the mixture with hemin.
Determination of Protein Concentration and Heme Content
Protein concentration was determined using a modified Lowry protein assay kit purchased from Pierce (Rockford, Illinois) with bovine serum albumin as a standard. Heme content was measured using the pyridine hemochrome assay with the extinction coefficient ε418 = 191.5 mM−1 cm−1 (28).
Rates of Hemin Association to and Dissociation from IsdA and IsdC
The rates of hemin dissociation from holoIsdA and holoIsdC were measured using H64Y/V68F whale sperm apomyoglobin as a hemin scavenger according to the previous method (29) with slight modification. Each protein (3 μM) was incubated with 48 μM apomyoglobin in 1 ml of 20 mM Tris-HCl, pH 8.0, and the changes in absorbance at 600 and 554 nm were monitored. Sucrose in the original method was not used in this study. The Δ(A600-A554) time courses were fit to a single exponential equation to obtain the first-order rate constants for hemin dissociation.
The rates of hemin binding to the apoproteins were measured using a stopped-flow spectrophotometer equipped with a photodiode array detector (SX20; Applied Photophysics). Hemin (2 μM) in one syringe was mixed with apoprotein at ≥ 3x [hemin] in another syringe. Entire spectra were recorded over time in each reaction. Changes in absorbance at the indicated wavelengths were analyzed as described in the Results section.
Hemin Transfer
HoloIsdA and apoIsdC or holoIsdC and apoIsdA at indicated concentrations were incubated in 0.1 ml 20 mM Tris-HCl, pH 8.0, at room temperature (22°C) for 2 or 20 min. Each mixture was then loaded onto a small DEAE Sepharose column (0.2 ml resin), and the column was first eluted with 0.3 ml Tris-HCl to recover IsdA, which did not bind to the column, and then washed with 1 ml Tris-HCl. IsdC bound to the column was eluted with 0.3 ml of 0.2M NaCl in Tris-HCl. Separation of the two proteins was confirmed by SDS-PAGE analysis. The concentrations of holoIsdA and holoIsdC in the isolated samples were calculated from A406 using the extinction coefficients of 9.5 × 10⁴ and 1.1 × 10⁵ M−1·cm−1, respectively. The concentrations of apoIsdA and apoIsdC in the same samples were calculated from A280 after subtracting the contribution from the holo-form using the extinction coefficients of 1.6 × 10⁴ and 1.8 × 10⁴ M−1·cm−1, respectively.
Kinetics of Hemin Transfer from HoloIsdA to ApoIsdC
The spectral changes associated with hemin transfer from holoIsdA to apoIsdC were used to measure the transfer rate using the stopped-flow spectrophotometer at the indicated temperatures. HoloIsdA (2.4 μM) in one syringe was mixed with apoIsdC at > 5x [holoIsdA] in another syringe. Entire spectra were recorded over a range of 250 to 800 nm against time in each reaction. Changes in absorbance at the appropriate wavelengths were analyzed.
RESULTS
IsdA and IsdC Proteins
Purified recombinant IsdA was a mixture of apo- and holo-forms. Homogeneous holoIsdA was prepared by reconstitution of apoIsdA with hemin, and 95% apoIsdA was prepared by extraction with methyl ethyl ketone. HoloIsdA exhibits absorption peaks at 406, 503, 529, and 622 nm in the visible region (Fig. 1A). Reduction of holoIsdA with dithionite shifted the Soret peak from 406 nm to 430 nm and abolished the A622 peak but did not result in the resolved α and β absorption bands seen in hemochrome (Fig. 1A). These absorption features are consistent with the previous observation that the heme iron in IsdA is pentacoordinate (19, 24).
FIGURE 1. Optical absorption spectra of oxidized and reduced IsdA (A) and IsdC (B) each at 8 μM.

The reduced spectra were recorded in the presence of excess dithionite.
Purified recombinant IsdC was also a mixture of apoprotein and a complex that displays absorption peaks at 407, 511, 547, 570, and 625 nm (data not shown) in the visible region. This feature is almost identical to that of the GST-IsdC fusion protein, which was found to bind iron-free protoporphyrin (23), indicating that the chromophore associated with IsdC was protoporphyrin. ApoIsdC was readily separated from the IsdC-protoporphyrin complex by anion exchange chromatography. HoloIsdC reconstituted from apoIsdC and hemin displays the broad Soret peak at 402 nm and charge transfer bands at 501, 532, and 626 nm (Fig. 1B). HoloIsdC treated with dithionite possesses the Soret peak at 417 nm and lacks the dominant α and β bands, and the reduction of holoIsdC appears not to be complete (Fig. 1B). These spectral characteristics are consistent with the pentacoordination of the heme iron in the crystal structure of IsdC (20).
Relative Affinity of IsdA and IsdC for Hemin
To determine the affinity of IsdA for hemin, the rates of hemin binding and dissociation from IsdA were measured. When hemin was mixed with apoIsdA, the spectrum of the reaction shifted from that of free hemin to those of holoIsdA (Fig. 2A). The time course of Δ(A406-A374) could be described by a two exponential equation, resulting in two observed rate constants. The fast and slower phases contributed to approximate 70% and 30% of the total spectral change, respectively (Fig. 2C). The value of observed rate constant in the fast phase (kobs1) varies hyperbolically with [apoIsdA]; whereas the observed rate constant in the slower phase (kobs2) does not display a clear dependence on [apoIsdA] (Fig. 2D). Using the method of de Villiers et al. (30), monomeric Fe(III)-protoporphrin IX was approximately 60% of total hemin at 2 μM in 20 mM Tris-HCl, pH 8.0. Thus, the fast phase is most likely the reaction of apoIsdA with monomeric hemin. If this is true, the results of the fast-phase reaction suggest a two-step binding process involving the formation of a hemin-apoprotein intermediate that is followed by axial coordination to form the final holoprotein as proposed below in Scheme 1.
FIGURE 2. Hemin association to apoIsdA and IsdC.
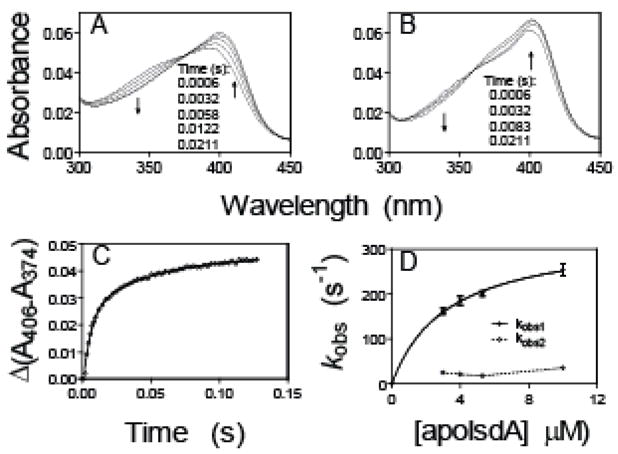
A and B, spectral shifts over time in the reactions of 1.0 μM hemin with 10 μM apoIsdA (A) or 3.9 μM apoIsdC (B). C, time courses of Δ(A406-A374) in panel A. The symbol and curve are the observed data and two-exponential fitting curve, respectively. D, the observed rate constants of the fast (kobs1) and slow (kobs2) phases for hemin binding to apoIsdA as a function of [apoIsdA]. The curve for kobs1 is a theoretical line obtained by fitting the data to Equation 1.
Scheme 1.

where k1 and k2 are the rate constants for bimolecular formation and unimolecular dissociation of the initial apoprotein-hemin complex, respectively, and kcoordination and k-hemin are the internal first-order rate constants for iron coordination to and dissociation from the final protein ligands, respectively.
If k1 and k2 are much greater than kcoordination, and k-hemin is much smaller than kcoordination, the observed constant in the fast phase (kobs1) is described by Equation 1
| (Eq. 1) |
where Kd is k2/k1. The values for Kd and kcoordination from fitting the kobs1 data in Fig. 2D to Equation 1 are 3.3 ± 0.7 μM and 330 ± 27 s−1, respectively. At low apoprotein concentrations where the reaction appears bimolecular, the apparent second-order rate constant (kcoordination/Kd) is 100 μM−1·s−1.
To determine the rate of dissociation of hemin from IsdA, IsdA was mixed with excess H64Y/V68F apomyoglobin, and dissociated hemin was captured by apomyoglobin. At 6 h after mixing holoIsdA and apoMb, the mixture displayed the spectrum of H64Y/V68F holomyoglobin, as evidenced by the formation of the A600 peak (Fig. 3A), indicating the loss of hemin from IsdA. Δ(A600-A544) time course associated with the hemin dissociation was fitted to a single exponential equation (Fig. 3C), obtaining k-hemin of 0.95 ± 0.02 h−1. Since the dissociation of hemin is extremely slow, k-hemin in Scheme 1 must be ≪ k1 or k2. Therefore, the rate constant of IsdA obtained from the time course in Fig. 3 are directly equal to k-hemin in Scheme 1.
FIGURE 3. Dissociation of hemin from IsdA and IsdC.
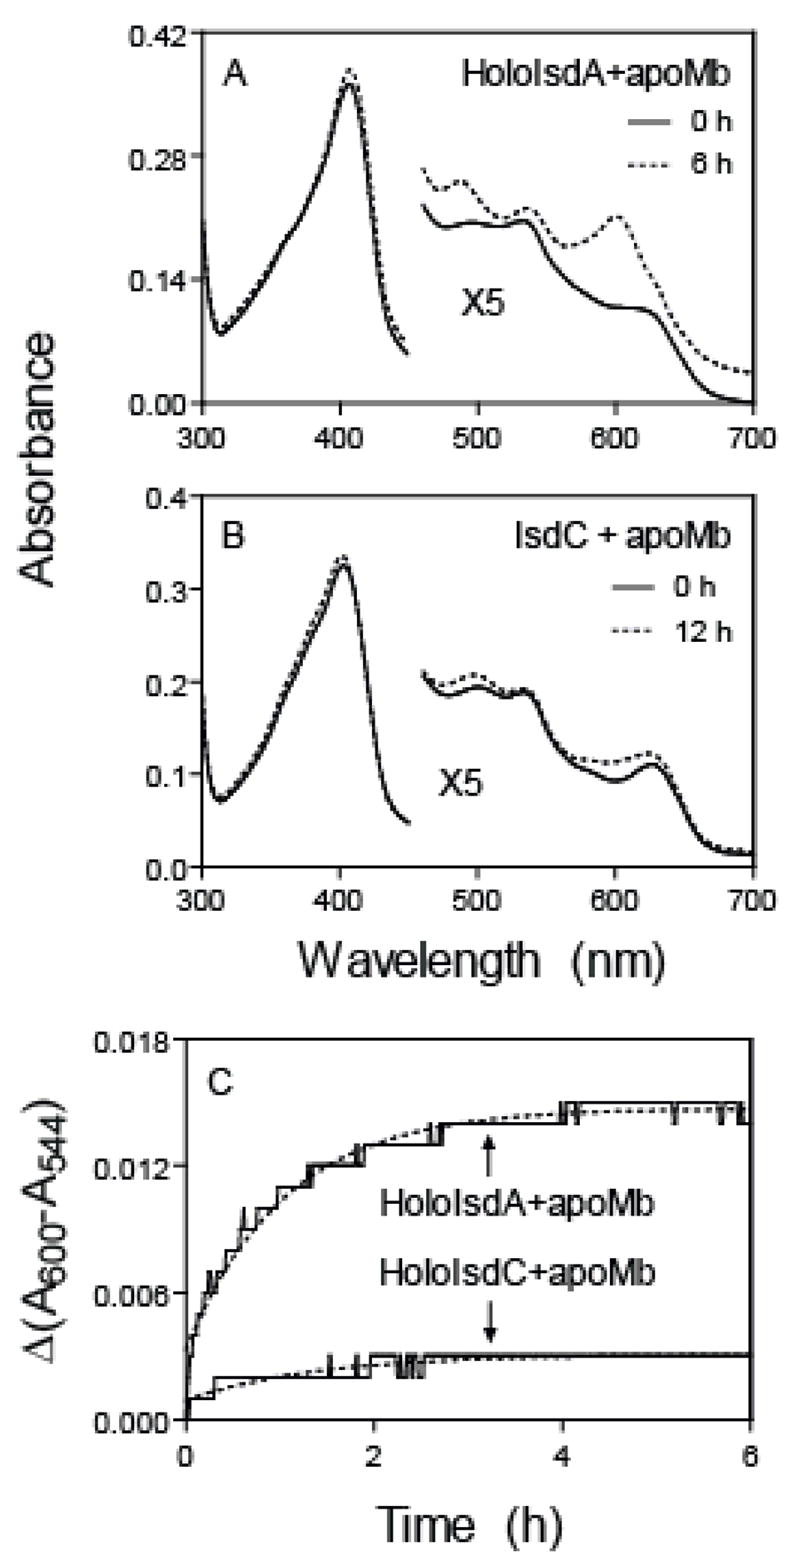
HoloIsdA or holoIsdC at 3 μM was incubated with 48 μM H64Y/V68F apomyoglobin in 20 mM Tris-HCl, pH 8.0, at 25°C. A and B, spectra of the mixture at 0 h and 6 or 12 h after mixing. C, time courses of Δ(A600-A544) in these reactions of hemin dissociation. The grey lines are the theoretical curves obtained by fitting the data to a single exponential equation.
The association equilibrium constants (Khemin) for hemin binding to apoIsdA can be estimated by the ratio of the apparent second order association rate constant (k′hemin = kcoordination/Kd) and the hemin dissociation rate constant k-hemin. The Khemin value for IsdA is 3.8 × 10¹¹ M−1 (Table 1)
TABLE 1.
Rate and equilibrium constants for hemin binding to IsdA
| Kinetic parameter | IsdA |
|---|---|
| or Kd (hemin binding)a | 3.3 ± 0.7 μM |
| kcoordinatioina | 330 ± 27 s−1 |
| k′hemin ≈ kcoordination/Kd, apparent bimolecular rate constant at low [Protein], | 100 μM−1s−1 |
| k-heminb | 0.95 ± 0.02 h−1 |
| Khemin ≈ k′hemin/k-hemin | 3.8 ×10¹¹ M−1 |
The values of the parameters were derived from the fast phase of the reaction of hemin with apoIsdA at 25°C in 20 mM Tris-HCl at pH 8.0 according to Scheme 1 and Equation 1.
The hemin dissociation rate constant from holoIsdA was determined by the H64Y/V68F apomyoglobin assay.
Attempt was also made to determine the affinity of IsdC for hemin. The spectral changes of the hemin/apoIsdC mixture indicate that most of hemin already bound to IsdC when the first spectrum was recorded in a stopped-flow spectrophotometer (Fig. 2B). Because the reaction is too fast, the kcoordination and Kd of hemin association with apoIsdC could not be reliably measured. Unlike in the reaction of holoIsdA and apomyoglobin, the 3.2-μM holoIsdC/48-μM apomyoglobin mixture at 12 h after mixing had a spectrum that was still more close to that of holoIsdC than to that of holomyoglobin (Fig. 3B), and Δ(A600-A544) associated with the holoIsdC/apomyoglobin reaction was 20% of the expected change (Fig. 3C). These results indicate that IsdC has higher affinity for hemin than both IsdA and H64Y/V68F myoglobin.
Hemin transfer from IsdA to apoIsdC
We next tested whether IsdA transfers its hemin to apoIsdC. HoloIsdA (36 μM) and 47 μM apoIsdC were incubated at room temperature for 2 min, and the two proteins were separated on a small DEAE column. SDS-PAGE analysis confirmed the separation of the two proteins (Fig. 4A). The normalized spectra of IsdA and IsdC before and after the reaction are shown in Fig. 4B and 4C, respectively. The ratio of A406/A280 of the treated IsdA was 29% of that of the starting holoIsdA. A406 is the absorption by the bound hemin, and A280 is mainly absorbance of the protein moiety. The lower A406/A280 ratio of treated IsdA indicates that IsdA lost hemin in its reaction with apoIsdC. Consistent with this result, holoIsdC was present in treated IsdC based on the presence of the absorbance of bound hemin (Fig. 4C). Measurements of protein and hemin contents of these samples indicated that 90% of the holoIsdA and 65% of the apoIsdC lost and gained hemin, respectively. These results indicate that IsdA efficiently transfers its hemin to apoIsdC.
FIGURE 4. Efficient hemin transfer from holoIsdA to apoIsdC.
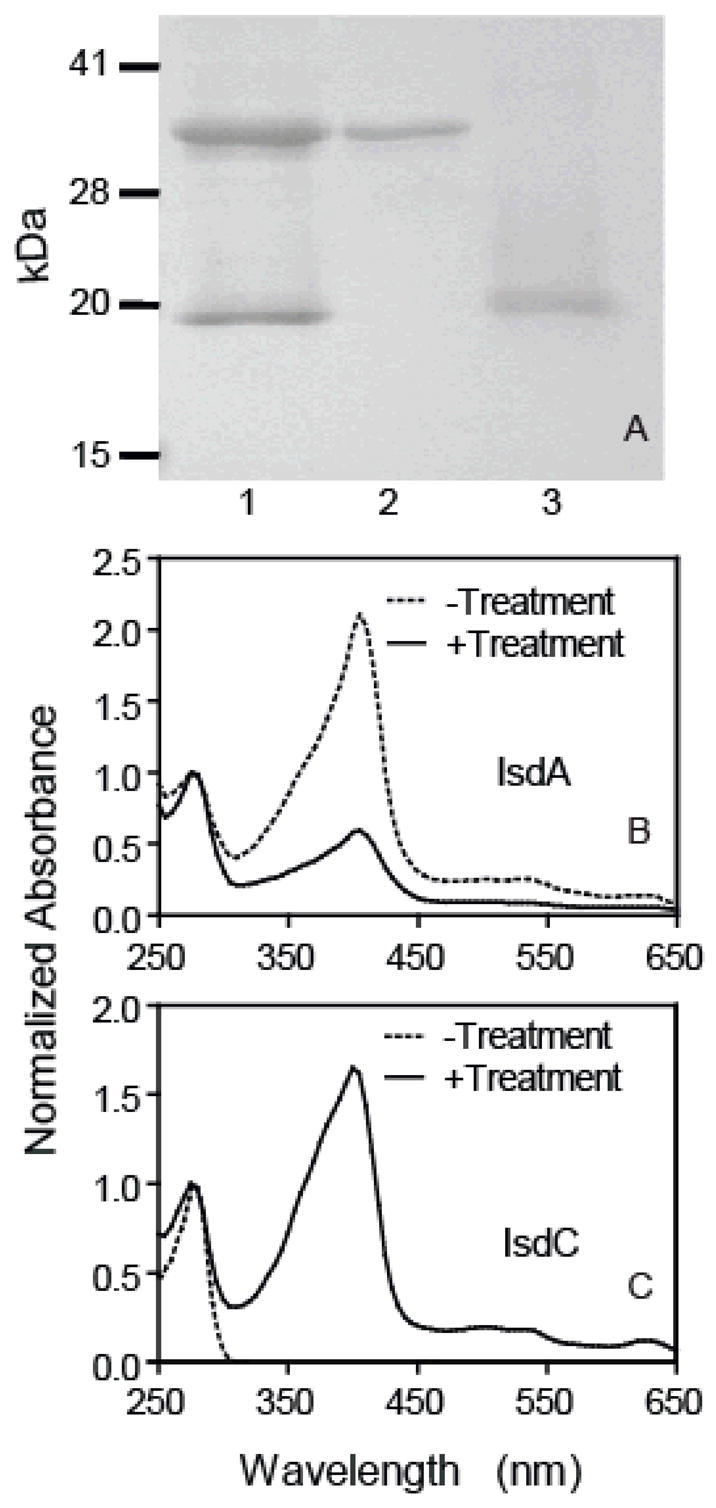
ApoIsdC (47 μM) was incubated with 36 μM holoIsdA in 0.1 ml of 20 mM Tris-HCl, pH 8.0, at room temperature for 2 min. The two proteins were separated as described in the text. A, SDS-PAGE analysis showing separation of IsdA and IsdC from their mixture. Lanes: 1, holoIsdA/apoIsdC mixture before separation; 2, IsdA isolated from the mixture; 3, IsdC isolated from the mixture. B, spectra of holoIsdA (dashed curve) and treated IsdA (solid curve). C, spectra of apoIsdC (dashed curve) and treated IsdC (solid curve).
Equilibrium Constant of the HoloIsdA/apoIsdC Reaction
To demonstrate whether the hemin transfer reaction is reversible, 15 μM holoIsdC was incubated with 56 μM apoIsdA for 2 min, and the two proteins were separated as described above. Based on the spectra of the separated proteins (Fig. 5) and the extinction coefficients, 24% of holoIsdC transferred hemin to apoIsdA. Thus, the reaction is reversible. To estimate the equilibrium constant of this reversible reaction, 33 μM holoIsdA was incubated with apoIsdC at 12, 24, 48, 71, or 95 μM at room temperature (22°C) for 20 min, and the two proteins were separated. The concentrations of apo- and holo-forms of each isolated protein were calculated using the corresponding extinction coefficients, which were then used to determine the concentrations of apo- and holo-forms of each protein in the reaction mixture on the assumption that the separation did not shift the equilibrium. Fig. 6 represents the concentrations of holoIsdA, apoIsdA, and holoIsdC as a function of initial [apoIsdC]/[holoIsdA]. Based on these data, the mean value ± standard deviation of the equilibrium constant of the reaction was found to be 10 ± 5. The results indicate that the equilibrium is in favor of holoIsdC formation, being consistent with the higher affinity of IsdC for hemin than IsdA.
FIGURE 5. Inefficient hemin transfer from holoIsdC to apoIsdA.
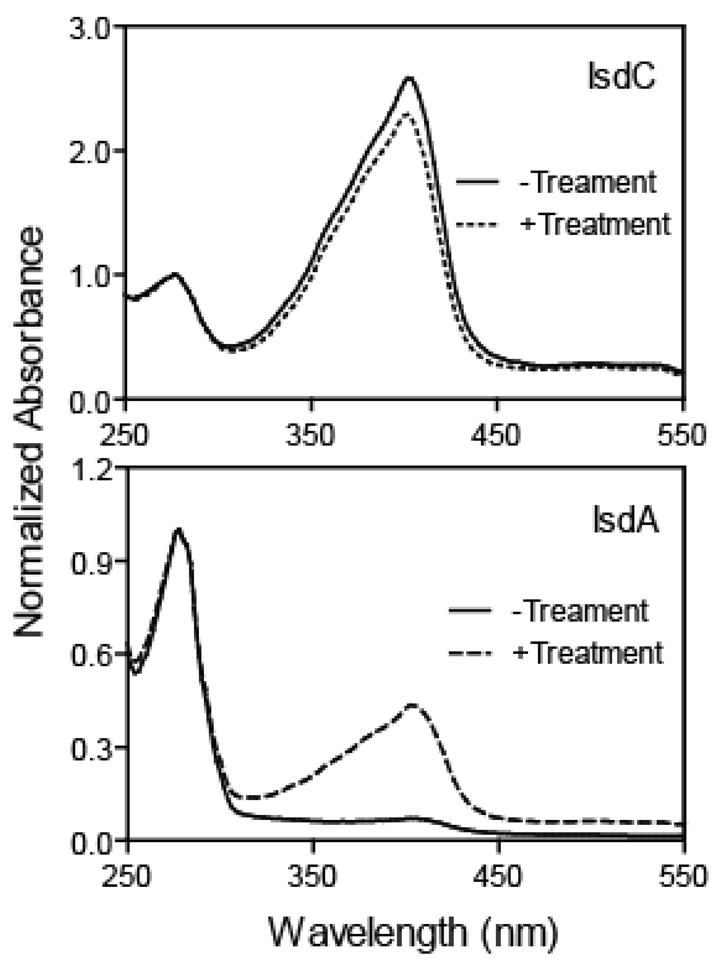
ApoIsdA (56 μM) was incubated with 15 mM holoIsdC in 0.1 ml of 20 mM Tris-HCl, pH 8.0, at room temperature for 2 min, and the two proteins were separated. Shown are the normalized spectra of IsdC (A) and IsdA (B) without and with the treatment.
FIGURE 6. ApoIsdC titration in hemin transfer from holoIsdA to apoIsdC.
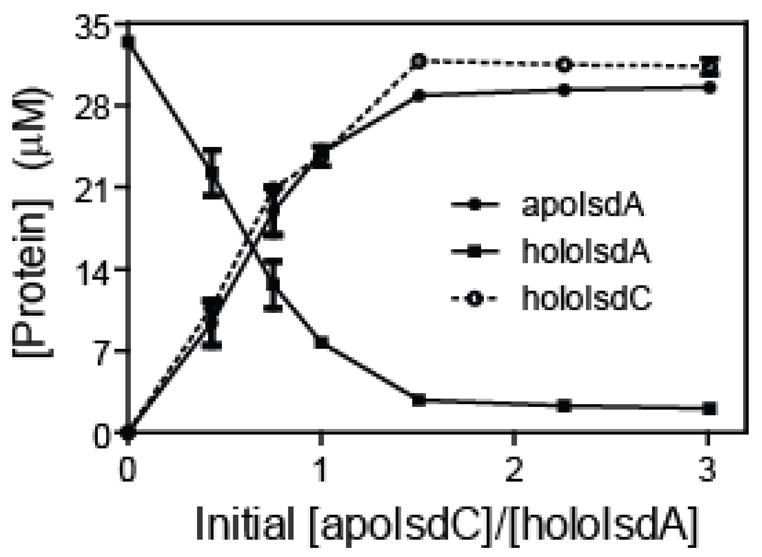
HoloIsdA (33 μM) was incubated with 12, 24, 48, 71, or 95 μM apoIsdC in 20 mM Tris-HCl, pH 8.0, at 22°C for 20 min. Shown are the concentrations of holoIsdA, apoIsdA, and holoIsdC in the mixtures as a function of the ratio of initial [apoIsdC]/[holoIsdA].
Kinetics of hemin transfer from IsdA to apoIsdC
Although oxidized holoIsdA and holoIsdC have similar Soret absorption peaks, holoIsdC does have higher absorbance than holoIsdA in the region between 350 and 405 nm (Fig. 7A). Since holoIsdA transfers its hemin to apoIsdC, there should be increase in absorbance in the region of 350–405 nm during the transfer, and this increase could be used to determine the kinetics of the hemin transfer reaction. Thus, limited holoIsdA was reacted with apoIsdC at various concentrations in a stopped-flow spectrophotometer, and spectra were recorded over time. The absorbance in the region of 350–405 nm was indeed rapidly increased after mixing holoIsdA and apoIsdC (Fig. 7B). The difference in absorbance between 374 and 344 nm (A374-A344) was used to determine the kinetics of the transfer. A374-A344 increases rapidly and fits a single exponential equation (Fig. 7C), resulting in an observed first-order rate constant (kobs). The kobs value depends hyperbolically on [apoIsdC] (Fig. 7D).
FIGURE 7. Spectral evidence for and kinetics of direct hemin transfer from holoIsdA to apoIsdC.

A, comparison of the spectra of 4.5 μM holoIsdA and holoIsdC in 20 mM Tris-HCl, pH 8.0. B, absorption spectra of a mixture of 1.3 μM holoIsdA and 7.4 μM apoIsdC as a function of time after mixing in a stopped-flow spectrophotometer. C, time course of A374-A344 for the reaction in panel B. The black trace and grey curve represent the observed data and single exponential fitting curve, respectively. D, the observed rate constant plotted as a function of [apoIsdC]. The rate constants at different [apoIsdC] were obtained from single exponential fitting as in C, and the curve is the theoretical curve obtained by fitting the data to Equation 2.
Attempt was also made to kinetically characterize hemin transfer from holoIsdC to apoIsdA. However, the spectral change was too little to be monitored because the reverse reaction is not efficient. Thus, the kinetics of the reverse reaction could not be determined by the analysis used in the forward reaction.
The data can be interpreted by a minimal model for hemin transfer from holoIsdA to apoIsdC given in the following scheme:
In this model, holoIsdA forms a complex with apoIsdC, and hemin is then reversibly and directly transferred to apoIsdC to yield apoIsdA:holoIsdC, which is subsequently dissociate into apoIsdA and holoIsdC. The reversible reaction can be neglected under the conditions in Fig. 7. When the initial [apoIsdC] is ≥5[holoIsdA] and ktransfer presumably ≫ k1, k2, and k3, the hemin transfer from holoIsdA to apoIsdC is a pseudo-first-order process. The observed rate constant, kobs, is given by Equation 2,
| (Eq. 2) |
where Kd is the dissociation constant of the holoIsdA:apoIsdC complex, and k1, k2, and ktransfer are the rate constants of the individual reactions proposed in Scheme 2. Fitting of the data in Fig. 7D to Equation 2 yielded values of ktransfer and Kd equal to 54.3 ± 1.8 s−1 and 17 ± 1.3 μM, respectively (Table 2).
Scheme 2.

TABLE 2.
Comparison of rate constants and activation parameters for hemin transfer in the holoIsdA/apoIsdC and holoShp/apoHtsA reactions
| Kinetic parameter | holoIsdA/apoIsdC | holoShp/apoHtsA |
|---|---|---|
| or Kda | 17 ± 1.3 μM | 48 ± 7 μM |
| ktransfera | 54.3 ± 1.8 s−1 | 43 ± 3 s−1 |
| ΔH°complexb,c | −68 ± 11 kJ/mol | −37 ± 6 kJ/mol |
| ΔS°complex,b,d | −136 ± 39 J/mol K | −37 ± 18 J/mol K |
| ΔG°complexb,d | −27 kJ/mol | −26 kJ/mol |
| ΔS≠for ktransferc,d | 15 ± 7 J/mol K | 35 ± 4 J/mol K |
| ΔH≠for ktransferc,d | 67 ± 12 kJ/mol | 75 ± 9 kJ/mol |
| ΔG≠for ktransferc,d | 63 kJ/mol | 64.9 kJ/mol |
| ktransfer/Kd, apparent bimolecular rate constant at low [Proteins], | 3.2 μM−1s−1 | 0.8 μM−1s−1 |
The values for k2/k1 and ktransfer at 25° in 20 mM Tris-HCl at pH 8.0 were obtained from fits of the dependence of the observed rate constants of transfer on [apoprotein] to Equation 2.
The standard entropy, enthalpy, and free energy for the formation of the holoIsdA:apoIsdC complexes were obtained by analyzing the dependence of Kassociation (1/Kd) on temperature according to the van’t Hoff plot.
The activation entropy, enthalpy, and free energy were obtained by analyzing the dependence of ktransfer on temperature according to the Eyring equation.
The data for the holoShp/apoHtsA reaction were from reference 14.
Activation Parameters for Hemin Transfers from IsdA to ApoIsdC
To estimate the activation parameters for hemin transfer from IsdA to apoIsdC, the values of ktransfer at different temperatures from 17 to 25°C were determined as described above. The ktransfer could not be measured at ≥30°C because the reaction was too fast. The data were analyzed according to the Eyring equation (Eq. 3).
| (Eq. 3) |
where kB, h, and R are Boltzman’s, Planck’s, and the gas constants, respectively. The values of The activation entropy (ΔS ≠) and enthalpy (ΔH ≠) for the first order transfer of hemin were 15 ± 7 J/(K mol) and 67 ± 12 kJ/mol 250, respectively. The free energy of activation, ΔG ≠ calculated as ΔH ≠ − TΔS ≠, was 63 kJ/mol at 25°C.
Enthalpy and Entropy Changes for Formation of the HoloIsdA:apoIsdC complex
The values of the equilibrium dissociation constant for formation of the transient holoIsdA:apoIsdC complex at different temperatures were also determined as described above and analyzed by the van’t Hoff equation (Eq. 4).
| (Eq. 4) |
where Kassociation is the equilibrium association constant for formation of the holoIsdA:apoIsdC complex and equal to 1/Kd from Table 2. The standard enthalpy (ΔH°) and entropy (ΔS°) changes were −68 ± 11 kJ/mol and −136 ± 39 J/(K mol) for the formation of holoIsdA:apoIsdC, respectively. The standard free energy change, ΔG°, is −27 kJ/mol for the formation of the holoIsdA:apoIsdC complex
DISCUSSION
The Isd proteins have been extensively characterized in terms of their function in hemin acquisition, hemin binding, and structures of the proteins or heme-binding domains. However, little is known about the biochemical mechanism of the heme acquisition by the Isd system. In the present study, we demonstrate the rapid, direct, and affinity-driven hemin transfer from IsdA to IsdC, documenting the first protein-to-protein hemin transfer in the Isd system and providing the first example of hemin transfer from one surface protein to another surface protein in Gram-positive bacteria. In addition, the kinetic and thermodynamic analyses suggest that the hemin transfer is through an activated holoIsdA:apoIsdC complex.
ApoIsdA and holoIsdC are formed during the brief incubation of holoIsdA with apoIsdC. The spectrum of the holoIsdA/apoIsdC mixture shifts from the spectrum of holoIsdA to that of holoIsdC. Thus, holoIsdA and apoIsdC loses and gains hemin, respectively, during the incubation of holoIsdA with apoIsdC, and the spectral change can be used to follow the hemin transfer.
Kinetic analyses of the transfer and hemin dissociation from holoIsdA strongly indicate that holoIsdA directly transfers its hemin to apoIsdC. In indirect transfer, hemin is first dissociated into solvent from the donor and then captured by the acceptor. If the IsdA-to-IsdC hemin transfer were indirect, the rate of the transfer should be close to the rate of the hemin dissociation from IsdA. However, the rate constant of the transfer is >70,000 times greater than the rate of simple hemin dissociation from holoIsdA into solvent (ktransfer = 54.3 s−1 versus k-hemin = 0.00076 s−1), ruling out an indirect transfer mechanism. Furthermore, the values of observed ktransfer depend hyperbolically on [apoIsdC]. This result indicates that holoIsdA forms a complex with apoIsdC prior to hemin transfer, further supporting a direct transfer mechanism.
Because hemin aggregates in aqueous solution, it has been a challenge to estimate the affinity of hemoproteins for hemin using kinetic analysis of hemin association to apoproteins and dissociation from holoproteins. The secondary order rate constants of hemin association have been estimated as the rate constants of association of CO-heme complex with apoproteins (32). The accuracy of this estimation is unknown. Thus, we performed the kinetic analysis of hemin association with apoIsdA, which fits a two exponential equation with approximate 70% of spectral change attributable to the fast phase. de Villiers et al. recently reported that aqueous hemin solution contains only monomers and dimers (30). Using the method of de Villiers et al., percentile of monomeric hemin in the hemin solution before mixing with apoIsdA in our stopped-flow measurements was estimated to be approximately 60%. Our data could be interpreted as follows. The fast phase is the reaction of monomeric hemin with apoIsdA, whereas the slower phase is the dissociation of dimeric hemin followed by the rapid association of the resulting monomeric hemin with apoIsdA. Thus, we could use the fast phase of the reaction to obtain the secondary rate constant of the hemin association to apoIsdA.
Although we can estimate the affinity of IsdA for hemin, the affinity of IsdC for hemin could not be determined under the same conditions, because the values of kcoorndination in hemin association and k-hemin in hemin dissociation could not be determined. However, our data strongly indicate that IsdC has much higher affinity for hemin than IsdA. First, hemin association to apoIsdC is faster than that to apoIsdA. Secondly, the majority of hemin in holoIsdA, but not holoIsdC, was lost to the apomyoglobin under the same conditions. Thirdly, the hemin transfer from holoIsdA to apoIsdC is reversible, and the equilibrium of the reaction is about 10 in favor of holoIsdC formation. If the interaction between IsdA and IsdC does not shift the equilibrium, IsdC would have an affinity for hemin 10-fold as that of IsdA. The Trp77 residue unique to IsdC “interlocks” hemin into its pocket in its crystal structure, and this effect has been proposed to account for assumed higher hemin affinity of IsdC versus that of all other Isd proteins containing the NEAT domain(s) (20). Our data is consistent with this hypothesis but also suggest that the faster rate of hemin association to apoIsdC also contributes to the higher affinity of IsdC for hemin. Taken together, our data indicate that efficient hemin transfer from IsdA to IsdC is at least partially driven by the higher affinity of IsdC for hemin compared to that of IsdA.
It has previously been hypothesized that hemin is transferred in the following order: IsdH-haptoglobin-hemoglobin/IsdB hemoglobin → IsdA → IsdC → IsdDEF and/or HtsABC (25, 26). Rapid and direct hemin transfer from IsdA to IsdC provides the first piece of experimental evidence supporting this hypothesis. It will be necessary to examine hemin transfer reactions and kinetic mechanisms for the various protein couples of these proteins in order to fully establish a heme acquisition model in the Isd system.
The Shr/Shp/HtsABC and Isd systems are two distinct heme acquisition pathways comprised of surface proteins and ABC transporter in Gram-positive pathogens. Shr likely binds host hemoproteins (7) and has two NEAT domains (17). The protein binds hemin and transfers it to apoShp, but not to apoHtsA (16). Although Shp was not included in the NEAT family by Andrade et al. (17), the homology in amino acid sequence between the heme-binding domain of Shp and the heme-binding or NEAT domain of IsdA or IsdC (17–19% identity) is similar to that between the IsdA and IsdC NEAT domains (19% identity) (18), suggesting that Shp is at least a distant member of the NEAT family that include Shr, IsdH, IsdA, IsdB, and IsdC (17). We have shown that Shp rapidly and directly transfers its hemin to apoHtsA. These observations suggest a heme flow model of hemoglobin → Shr → Shp → HtsA in the S. pyogenes system. It appears that there are parallel functions of the components in the two systems, i.e. Shr functions like IsdH/B, Shp like IsdA/C, and HtsA like IsdE and/or S. aureus HtsA.
The affinities of IsdA and IsdC for hemin are greater than those of Shp and HtsA (Table 3). IsdA-hemin and IsdC-hemin complexes are pentacoordinate and use Tyr as their only axial ligand (19, 20), whereas Shp- and HtsA-hemin complexes are hexacoordinate using two Met and Met/His residues as the axial ligands, respectively (15, 18). The Tyr-hemin ligation may be a major factor for the higher hemin affinities of IsdA and IsdC. The axial Met residues of the Shp heme iron are both required for rapid Shp-to-HtsA hemin transfer (15), and the hemin acceptor in each couple has higher affinity for hemin, suggesting that the axial ligands and relative hemin affinity may have been evolved for efficient hemin transfer in each system.
TABLE 3.
Comparison of apparent rate and equilibrium constants for hemin binding to apoIsdA, apoIsdC, and other hemin protein complexes
| Heme protein | k′hemin μM−1 s−1 | k-hemin s−1 | Khemin M−1 | Reference |
|---|---|---|---|---|
| apoIsdA | ||||
| Without apoIsdC | 100 | 0.00026 | 3.8 × 10¹¹ | This work |
| With apoIsdC | 54.3 | |||
| apoIsdC | ~3.8 × 10¹²a | This work | ||
|
| ||||
| ApoShp | 14 | |||
| without apoHtsA | 1.6 | 0.0003 | 5 × 10⁹ | |
| with apoHtsA | 43 | |||
| ApoHtsA | 80 | 0.0026 | 3.1 × 10¹⁰ | 14 |
|
| ||||
| Hemophore HasA | 5.3 × 10¹⁰ | 31 | ||
|
| ||||
| Human apohemoglobin | 33 | |||
| α (tetramers) | ~100 | 0.00008 | ~1.2 × 10¹² | |
| α (dimers) | ~100 | 0.00016 | ~6 × 10¹¹ | |
| α (monomers) | ~100 | 0.0033 | ~3.3 × 10¹⁰ | |
| β (tetramers) | ~100 | 0.00041 | ~2.5 × 10¹¹ | |
| β (dimers) | ~100 | 0.0042 | ~2.4 × 10¹⁰ | |
| β (monomers) | ~100 | 0.011 | ~9 × 10⁹ | |
Estimated from the value of Khemin of IsdA and the equilibrium constant (Keq = 10) of the reaction of holoIsdA with apoIsdC on the assumption that the Keq value is solely dependent on the relative affinity of IsdA and IsdC for hemin.
IsdA apparently transfers its hemin to apoIsdC through an activated transfer mechanism. HoloIsdA forms a complex with apoIsdC, releasing free energy. The free energy released is used to weaken hemin binding in holoIsdA and thus facilitate transfer to apoIsdC. This mechanism is similar to that of hemin and heme transfer from streptococcal Shp to apoHtsA (14). Protein interaction also is critical for hemin transfer from Serratia marcescens hemophore HasA to HasA receptor HasR (1). The mechanism of activated heme transfer may apply in general to all direct heme transfer in bacterial heme transport systems.
Acknowledgments
This work was supported by grants P20 RR-020185 (BL) from the National Center for Research Resources, GM27659 (DMD) from the National Institutes of Health, and USDA NRI/CSREES 2007-35204-18306 and Formula Funds and the Montana State University Agricultural Experimental Station. Wesley T. Tanaka was supported by the National Science Foundation Research Experience for Undergraduates program (DBI-0453021 to A. Metz). We thank Drs. John Olsen and Mark Quinn for critical reading of the manuscript.
Footnotes
The abbreviations used are: Isd, iron-regulated surface determinants; IsdA, iron-regulated surface determinant A; IsdC, iron-regulated surface determinant C; hemin, Fe(III)-protoporphyrin IX complex; holoIsdA and holoIsdC, IsdA and IsdC with bound hemin; apoIsdA and apoIsdC, metalloporphyrin-free IsdA and IsdC.
References
- 1.Izadi-Pruneyre N, Huche F, Lukat-Rodgers GS, Lecroisey A, Gilli R, Rodgers KR, Wandersman C, Delepelaire P. J Biol Chem. 2006;281:25541–25550. doi: 10.1074/jbc.M603698200. [DOI] [PubMed] [Google Scholar]
- 2.Burkhard KA, Wilks A. J Biol Chem. 2007;282:15126–15136. doi: 10.1074/jbc.M611121200. [DOI] [PubMed] [Google Scholar]
- 3.Klebba PE, Rutz JM, Liu J, Murphy CK. J Bioenerget Biomemb. 1993;25:603–611. doi: 10.1007/BF00770247. [DOI] [PubMed] [Google Scholar]
- 4.Griffiths E, Williams P. In: Iron and infection: molecular, physiological and clinical aspects. Bullen JJ, Griffiths E, editors. John Wiley & Sons, Inc.; Chichester, United Kingdom: 1999. pp. 87–212. [Google Scholar]
- 5.Drazek ES, Hammack CA, Schmitt MP. Mol Microbiol. 2000;36:68–84. doi: 10.1046/j.1365-2958.2000.01818.x. [DOI] [PubMed] [Google Scholar]
- 6.Lei B, Liu M, Voyich JM, Prater CI, Kala SV, DeLeo FR, Musser JM. Infect Immun. 2003;71:5962–5969. doi: 10.1128/IAI.71.10.5962-5969.2003. [DOI] [PMC free article] [PubMed] [Google Scholar]
- 7.Bates CS, Montanez GE, Woods CR, Vincent RM, Eichenbaum Z. Infect Immun. 2003;71:1042–1055. doi: 10.1128/IAI.71.3.1042-1055.2003. [DOI] [PMC free article] [PubMed] [Google Scholar]
- 8.Skaar EP, Humayun M, Bae T, DeBord KL, Schneewind O. Science. 2004;305:1626–1628. doi: 10.1126/science.1099930. [DOI] [PubMed] [Google Scholar]
- 9.Nygaard TK, Liu M, McClure MJ, Lei B. BMC Microbiol. 2006;6:82. doi: 10.1186/1471-2180-6-82. [DOI] [PMC free article] [PubMed] [Google Scholar]
- 10.Lei B, Smoot LM, Menning H, Voyich JM, Kala SV, Deleo FR, Musser JM. Infect Immun. 2002;70:4494–4500. doi: 10.1128/IAI.70.8.4494-4500.2002. [DOI] [PMC free article] [PubMed] [Google Scholar]
- 11.Mazmanian SK, Skaar EP, Gaspar AH, Humayun M, Gornicki P, Jelenska J, Joachmiak A, Missiakas DM, Schneewind O. Science. 2003;299:906–909. doi: 10.1126/science.1081147. [DOI] [PubMed] [Google Scholar]
- 12.Maresso AW, Chapa TJ, Schneewind O. J Bacteriol. 2006;188:8145–8152. doi: 10.1128/JB.01011-06. [DOI] [PMC free article] [PubMed] [Google Scholar]
- 13.Liu M, Lei B. Infect Immun. 2005;73:5086–5092. doi: 10.1128/IAI.73.8.5086-5092.2005. [DOI] [PMC free article] [PubMed] [Google Scholar]
- 14.Nygaard TK, Blouin GC, Liu M, Fukumura M, Olson JS, Fabian M, Dooley DM, Lei B. J Biol Chem. 2006;281:20761–20771. doi: 10.1074/jbc.M601832200. [DOI] [PMC free article] [PubMed] [Google Scholar]
- 15.Ran Y, Zhu H, Liu M, Fabian M, Olson JS, Aranda R, IV, Phillips GN, Jr, Dooley DM, Lei B. J Biol Chem. 2007;282:31380–31388. doi: 10.1074/jbc.M705967200. [DOI] [PMC free article] [PubMed] [Google Scholar]
- 16.Zhu H, Liu M, Lei B. The Surface protein Shr of Streptococcus pyogenes binds hemin and transfers it to the streptococcal heme-binding protein Shp. doi: 10.1186/1471-2180-8-15. Manuscript submitted. [DOI] [PMC free article] [PubMed] [Google Scholar]
- 17.Andrade MA, Ciccarelli FD, Perez-Iratxeta C, Bork P. Genome Biol. 2002;3:RESEARCH0047. doi: 10.1186/gb-2002-3-9-research0047. [DOI] [PMC free article] [PubMed] [Google Scholar]
- 18.Aranda R, IV, Worley CE, Liu M, Bitto E, Cates MS, Olson JS, Lei B, Phillips GN., Jr J Mol Biol. 2007 doi: 10.1016/j.jmb.2007.08.058. [DOI] [PMC free article] [PubMed] [Google Scholar]
- 19.Grigg JC, Vermeiren CL, Heinrichs DE, Murphy ME. Mol Microbiol. 2007;63:139–149. doi: 10.1111/j.1365-2958.2006.05502.x. [DOI] [PubMed] [Google Scholar]
- 20.Sharp KH, Schneider S, Cockayne A, Paoli M. J Biol Chem. 2007;282:10625–10631. doi: 10.1074/jbc.M700234200. [DOI] [PubMed] [Google Scholar]
- 21.Torres VJ, Pishchany G, Humayun M, Schneewind O, Skaar EP. J Bacteriol. 2006;188:8421–8429. doi: 10.1128/JB.01335-06. [DOI] [PMC free article] [PubMed] [Google Scholar]
- 22.Dryla A, Gelbmann D, von Gabain A, Nagy E. Mol Microbiol. 2003;49:37–53. doi: 10.1046/j.1365-2958.2003.03542.x. [DOI] [PubMed] [Google Scholar]
- 23.Mack J, Vermeiren C, Heinrichs DE, Stillman MJ. Biochem Biophys Res Commun. 2004;320:781–788. doi: 10.1016/j.bbrc.2004.06.025. [DOI] [PubMed] [Google Scholar]
- 24.Vermeiren CL, Pluym M, Mack J, Heinrichs DE, Stillman MJ. Biochemistry. 2006;45:12867–12875. doi: 10.1021/bi0607711. [DOI] [PubMed] [Google Scholar]
- 25.Maresso AW, Schneewind O. Biometals. 2006;19:193–203. doi: 10.1007/s10534-005-4863-7. [DOI] [PubMed] [Google Scholar]
- 26.Reniere ML, Torres VJ, Skaar EP. Biometals. 2007;20:333–345. doi: 10.1007/s10534-006-9032-0. [DOI] [PubMed] [Google Scholar]
- 27.Ascoli F, Fanelli MR, Antonini E. Methods Enzymol. 1981;76:72–87. doi: 10.1016/0076-6879(81)76115-9. [DOI] [PubMed] [Google Scholar]
- 28.Fuhrhop JH, Smith KM. In: Porphyrins and Metalloporphyrins. Smith KM, editor. Elsevier Publishing Co.; New York: 1975. pp. 804–807. [Google Scholar]
- 29.Hargrove MS, Singleton EW, Quillin ML, Ortiz LA, Phillips GN, Jr, Olson JS, Mathews AJ. J Biol Chem. 1994;269:4207–4214. doi: 10.2210/pdb1mgn/pdb. [DOI] [PubMed] [Google Scholar]
- 30.de Villiers KA, Kaschula CH, Egan TJ, Marques HM. J Biol Inorg Chem. 2007;12:101–117. doi: 10.1007/s00775-006-0170-1. [DOI] [PubMed] [Google Scholar]
- 31.Deniau C, Gilli R, Izadi-Pruneyre N, Létoffé S, Delepierre M, Wandersman C, Briand C, Lecroisey A. Biochemistry. 2003;42:10627–10633. doi: 10.1021/bi030015k. [DOI] [PubMed] [Google Scholar]
- 32.Hargrove MS, Barrick D, Olson JS. Biochemistry. 1996;35:11293–11299. doi: 10.1021/bi960371l. [DOI] [PubMed] [Google Scholar]
- 33.Hargrove MS, Whitaker T, Olson JS, Vali RJ, Mathews AJ. J Biol Chem. 1997;272:17385–17289. doi: 10.1074/jbc.272.28.17385. [DOI] [PubMed] [Google Scholar]