

Abstract
Hypertrophy of mammalian cardiac muscle is mediated, in part, by angiotensin II through an angiotensin II type1a receptor (AT1aR)-dependent mechanism. To understand how the level of AT1aRs is altered in this pathological state, we studied the expression of an injected AT1aR promoter-luciferase reporter gene in adult rat hearts subjected to an acute pressure overload by aortic coarctation. This model was validated by demonstrating that coarctation increased expression of the α-skeletal actin promoter 1.7-fold whereas the α-myosin heavy chain promoter was unaffected. Pressure overload increased expression from the AT1aR promoter by 1.6-fold compared with controls. Mutations introduced into consensus binding sites for AP-1 or GATA transcription factors abolished the pressure overload response but had no effect on AT1aR promoter activity in control animals. In extracts from coarcted hearts, but not from control hearts, a Fos-JunB-JunD complex and GATA-4 were detected in association with the AP-1 and GATA sites, respectively. These results establish that the AT1aR promoter is active in cardiac muscle and its expression is induced by pressure overload, and suggest that this response is mediated, in part, by a functional interaction between AP-1 and GATA-4 transcription factors.
Keywords: hypertrophy, DNA injection
Pathological conditions resulting in increased cardiac workload generally are associated with activation of systemic and local renin-angiotensin systems and increased levels of circulating angiotensin II (AngII) (1, 2). However, little is understood about how AngII type 1a receptors (AT1aR) are modulated under these same pathological conditions. AngII is a potent growth factor that mediates the hypertrophic growth of cardiac muscle cells and is a chemical mediator of stretch-induced cardiomyocyte hypertrophy (3–7). The interaction of AngII with AT1aR activates a signal transduction cascade that effects the phosphorylation of serum response factor and p62TCF by pp90RSK and mitogen-activated protein kinase, respectively, resulting in increased c-fos gene expression (5–7). Hypertrophic stimuli also increase the level of AT1aR mRNA in cardiomyocytes. A 3-fold increase in AT1aR mRNA and a 2-fold increase in AT1aR densities have been reported in spontaneously hypertensive and two kidney one-clip renovascular hypertensive rats with established cardiac hypertrophy (8). It is not known whether this increase in AT1aR mRNA is mediated by a transcriptional or posttranscriptional mechanism.
In this study, we use direct injection of DNA into the heart in conjunction with aortic coarctation (CoA) to study the activity of the AT1aR promoter in the normal and pressure-overloaded rat heart. The AT1aR promoter was found to be active in normal adult cardiac muscle, whereas gene expression was increased in response to an acute pressure overload (PO). The induced expression was blocked by mutation of either an AP-1 or a GATA binding site, however, these mutations had no effect on basal expression. Administration of the angiotensin-converting enzyme inhibitor captopril decreased PO-induced expression, whereas AngII treatment of transfected cardiomyocytes increased AT1aR promoter expression, indicating that AngII can influence receptor promoter activity. CoA increased the level of DNA binding interactions with the AP-1 site concomitant with significant increases in the levels of c-Fos and Jun B. The level of GATA-4 DNA binding to the AT1aR GATA site was also greatly increased in extracts from coarcted hearts. These results demonstrate that the AT1aR regulatory region is active in cardiac muscle and suggest that part of the PO response is mediated by a functional cooperation between the AP-1 and GATA sites through increases in AP-1 and GATA-4 activity. This suggests a pathway by which functional interactions between Fos and Jun family members and GATA transcription factors participate in the PO response of the heart.
MATERIALS AND METHODS
Oligonucleotides.
The sense strands of novel oligonucleotides used this study are shown in Table 1. The numbering reflects the position of the AT1 receptor regulatory region (11, 12). The sequence of our AT1aR promoter clone in the region encoded by AT1R-GATA2 (from −292 through −314) differs from the published sequence in this region (see Table 1). The AP-1 consensus double-stranded (ds) oligonucleotide was purchased from Santa Cruz Biotechnology. The nonspecific oligonucleotide multiple cloning site was previously described (13). Unless otherwise indicated, oligo refers to ds oligonucleotides, and ds oligonucleotides used in gel shift experiments had blunt ends.
Table 1.
Sequences of oligonucleotides used in this study
| Name | Sequence |
|---|---|
| 5′AT1R | −986 ATTCTACTTCTGCATTTTCAC −966 |
| 3′AT1R | +182 GGACTCTGATCACACGCTG +164 |
| AT1R-APmut | −379 ATCACATTTctgcagAGCCACAGTAAAGACAAGGGA −362 |
| AT1R-AP-PCR | −398 GCCTTTGTTGTGGATTACAGA −418 |
| AT1R-GATAmut | −291 GGAGCATTTcTgcaGGAGTCAGTTCATGTGGCCTT −257 |
| AT1R-GATA2 | −292 ACTTAGAAAGAAAAAAAAGA −314 |
| AT1AP1 | −395 CACATTTTGAGTCAGCCACAG −375 |
| AT1AP1mut | −395 CACATTTctgcagAGCCACAG −375 |
| AT1GATA | −290 GAGCATTTATCTTGGAGT −273 |
| AT1GATAmut | −290 GAGCATTTcTgcaGGAGT −273 |
| BNP-GATA | TGTGTCTGATAAATCAGAGATAACCCA |
| α-MHC-GATA | GGCCGATGGGCAGATAGT |
Plasmid Construction and Site-Directed Mutagenesis.
Plasmids pSV0MCAT and pHSA2000 have been described previously (14, 15). The AT1aR regulatory region was amplified from rat chromosomal DNA using the gene-specific primers 5′AT1R and 3′AT1R (Table 1). This fragment (from −986 through +182 of the AT1aR gene) was cloned into the SmaI site in the vector pGL2Basic (Promega) with the insert oriented toward the luciferase reporter sequences (pAT1LUC).
Site-specific mutations were introduced into the AT1aR promoter cloned into pBluescript SK(−) by rolling circle PCR as previously described (10, 16). Mutations in the AP-1 site were introduced using AT1R-APmut and AT-AP-PCR as primers. For mutagenesis of the GATA site, AT1R-GATAmut and AT1R-GATA2 were used. Each clone was sequenced across the entire AT1aR and flanking regions to confirm orientation and nucleotide identity with wild-type sequences.
Luciferase, Chloramphenicol Acetyltransferase (CAT), and β-Galactosidase Assays.
For injections using the CAT reporter gene, tissue extracts were prepared as described previously (13). CAT and β-galactosidase assays were performed as described previously (17, 18) using 50 μg of extract for both assays. For injection experiments using the luciferase reporter gene, extracts were prepared and assayed for luciferase activity as previously described (19). Statistical analysis was performed using ANOVA followed by the Student’s unpaired t test. Significant differences between groups or treatments were taken at P < 0.05.
Animals.
Adult male Sprague–Dawley rats (225–250 g) were housed two per cage on bedding in temperature-controlled rooms (22°C) with constant 12-hr light/12-hr dark cycle. Standard laboratory rat chow and tap water were provided ad libitum, except where indicated. In rats receiving captopril treatment, captopril (10 mg/ml) was dissolved in the drinking water. All procedures were in accordance with institutional guidelines for the care and use of animals.
In Vivo Gene Transfer and Aortic Coarctation.
Plasmids were injected directly into the apex and left ventricular free wall of the heart as previously described (13). Briefly, rats were anesthetized with 0.15 ml/100 g body weight of a ketaset-acepromazine mixture [ketaset (10 mg/ml), 10 ml and acepromazine (10 mg/ml), 2.2 ml] and ventilated. A left lateral thoracotomy was performed to expose the heart. The appropriate luciferase reporter plasmid (80 μg) and 6 μg of pRSVCAT in a total of 80 μl of PBS were injected. After surgery, the rats received procaine penicillin G (10,000 units/100 g body weight, i.m.). Coarctation of the abdominal aorta or control sham operations were performed 4 days later. Briefly, a laporatomy was performed, exposing the descending aorta near the origin of the renal arteries. A ligature (silk suture) was tied around the aorta and stainless steel tubing (21 gauge) proximal to the renal arteries, and then the tubing was removed. Sham coarctation surgery included manipulation of the aorta in a manner similar to that in the experimental group, but no ligature was tied around the aorta. These animals represent the control group in each experiment unless otherwise indicated. Two days postcoarctation, rats were anesthetized, and the right carotid and left femoral arteries were catheterized for blood pressure measurements above and below the area of coarctation. The catheters were connected to Cobe transducers, and the pulsatile pressure wave was amplified and converted from an analog to a digital signal for data acquisition. Heart rate was calculated from the peak-to-peak interval. After blood pressure measurements, the left ventricle was collected for luciferase and CAT assays.
To examine expression from pSV0MCAT and pHSA2000, coarctation was performed 7 days before injection. Because CAT was used as the indicator of promoter activity, pRSVβGAL was used as a control for DNA uptake. The rats were allowed to recover for an additional 6 days at which time they were sacrificed by lethal injection of pentobarbital, and the hearts were excised, weighed, and assayed.
Preparation of Nuclear Extracts and Gel Mobility Shift Assays.
Nuclear extracts were prepared from adult rat tissues, and gel shift assays were performed as described earlier (10). Extracts were prepared from hearts of sham or coarcted animals that were harvested at 48 hr postcoarctation. Unless otherwise indicated, 15 μg of protein extract and 1 μg of poly- (dI-dC)⋅(dI-dC) were used in each assay. Where appropriate, competitor DNAs were added at a 100-fold molar ratio with the indicated probe. For supershift assays, antisera against the indicated protein or nonimmune serum was added to the reaction. Antibodies were from Santa Cruz Biotechnology.
Cardiac Myocyte Isolation, Transfection, and Culture Conditions.
Cardiac ventricular myocytes from 1-day-old Wister rats were enzymatically dissociated (6) and purified by percoll gradient centrifugation (7), and plated onto gelatin-coated 60-mm culture dishes and cultured in DMEM/F-12 supplemented with 5% horse serum/2 g/liter BSA/3 mM pyruvic acid/15 mM Hepes, pH 7.6/100 μM ascorbic acid/100 μg/ml ampicillin/4 μg/ml transferrin/0.7 ng/ml sodium selenite/5 μg/ml linoleic acid. Culture media were changed to the same media without serum at 24 hr. Myocytes were cultured for 48 hr in serum-free conditions before transfection. Myocytes were transiently transfected with 2 μg of pAT1LUC and 2 μg of pCMV-bgal (courtesy M. Uhler, Ann Arbor, MI) using lipofectamine (GIBCO/BRL) according to the manufacturer’s instructions. At 24 hr after transfection, myocytes were treated with or without 100 nM AngII for 48 hr, harvested in reporter lysis buffer (Promega). Luciferase activity was assayed by luminescence derived by mixing 20 μl of cell extract and 100 μl of the luciferase assay reagent (Promega). β-Galactosidase activity was measured by the luminescent light derived from 10 μl of each sample incubated in 100 μl of Lumi-Gal 530 (Lumigen) and used to normalize the luciferase assay data for transfection efficiency.
RESULTS AND DISCUSSION
Gene Expression in the Hypertrophied Heart.
The CoA model, which produces an acute PO, was chosen to study AT1aR regulation during cardiac hypertrophy. To validate the model, we examined the expression of two genes, α-myosin heavy chain (α-MHC) and α-skeletal actin. α-MHC promoter activity does not change after CoA (20), and published results suggest that mRNA levels do not change significantly (21) or decrease by 54% (20) by 7 days post-CoA. In our CoA group, the α-MHC promoter-containing plasmid, pSV0MCAT, was expressed at approximately 90% of the level of the control group, which was not significantly different (Fig. 1A). This result confirms the previous observation by Ojamaa et al. (20). In contrast, activity from the human skeletal α-actin reporter plasmid, pHSA2000, was significantly higher in the CoA versus the control group (Fig. 1A). This is consistent with previous results indicating that α-skeletal actin mRNA levels are significantly increased at 2 days post-CoA and are maintained for at least 2 weeks (22). The heart weight to body weight ratios for the CoA group were 51 × 10−4 ± 4 (± SEM) compared with 35 × 10−4 ± 1 for the control group, indicating that the hearts from the coarcted rats were significantly hypertrophied. With some minor variation, the extent of hypertrophy of individual hearts directly correlated with α-skeletal actin promoter activity. These results demonstrate that the α-skeletal actin promoter sequences used in this study are sufficient to direct increased expression in our CoA model. Moreover they also suggest that the 1.7-fold increase in promoter activity, while modest, is physiologically significant.
Figure 1.
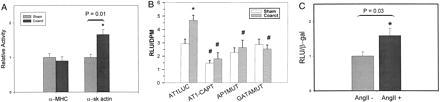
AT1aR promoter activity in the adult rat heart and neonatal cardiac myocytes. (A) Validation of the direct injection/aortic coarctation model of hypertrophy. Rats were subjected to CoA (Coarct) or a sham operation (Sham) for 7 days followed by injection of either a plasmid containing the α-MHC (pSV0MCAT) or α-skeletal actin (pHSA2000) promoter driving CAT expression along with pRSVβGAL as a control. After 6 days, heart extracts were assayed for promoter activity. Activity of a plasmid in the coarcted animals is given relative to that in control animals which was arbitrarily set at 1 (n ≥ 7). ∗ indicates a significant difference from control. (B) pAT1LUC or derivatives of this plasmid, AP1 mut and GATAmut were injected into adult rat hearts with pRSVCAT as a control. Four days after injection, the rats underwent a second procedure where that abdominal aorta was coarcted (Coarct) or not (Sham). One group of rats received captopril (10 mg/ml in their drinking water before and during the experiment). AT1aR promoter activity is reported as relative light units (RLU)/relative CAT units (DPM) ± SEM. ∗ represents significant differences (P < 0.05) between sham and coarcted rats injected with pAT1LUC. # denotes significant differences (P < 0.05) within the sham or coarct groups (n ≥ 6). (C) Neonatal cardiac myocytes were transfected with pAT1LUC and pCMVβgal, cultured in the presence or absence of 100 nM AngII for 48 hr and assayed for activity. Results are expressed as relative light units (RLU)/β-galactosidase (β-gal) (n = 7).
The AT1a Receptor Promoter Activity in Normal and Pressure-Overloaded Adult Cardiac Muscle.
Expression of the AT1aR promoter in the heart was assayed by direct injection of the plasmid pAT1LUC, which contains the 5′ upstream region of the AT1aR gene from position −986 to + 182 of the published sequences (11, 12). Luciferase activity was determined 48 hr postinjection. pAT1LUC was active in cardiac muscle, giving average activity in raw light units of approximately 10,000–20,000/50 μg of protein (2.93 ± 0.35 relative light units/relative CAT units, Fig. 1B). Because plasmid DNA injected into the heart is exclusively taken up by myocytes (23–25), the activity observed in our experiments can be attributed to the activity of the AT1aR promoter in cardiac muscle. These results establish that the AT1aR promoter construct is active in cardiac muscle cells.
Because the AT1aR mediates AngII effects, changes in its expression might be manifested soon after CoA. Therefore, AT1aR promoter activity was measured 48 hr after CoA rather than at 7 days as was used above for the contractile protein gene promoters. CoA significantly increased carotid mean arterial pressure and pulse pressure above the site of CoA (Table 2). The activity of pAT1LUC was increased in coarcted hearts to 160% of that in the control group (P ≤ 0.004) (Fig. 1B). This increase was nearly identical to that for the α-skeletal actin gene, indicating that the AT1aR promoter responds to increased pressure. These results suggest that the increase in cardiac AT1aR mRNA levels seen in two previously studied models of hypertrophy (8) is due, in part, to increased transcription in cardiac myocytes.
Table 2.
Physiological parameters of pAT1LUC-injected rats
| Parameter | Control
|
Captopril-treated
|
||
|---|---|---|---|---|
| Sham | Coarct | Sham | Coarct | |
| Mean arterial pressure, mmHg | ||||
| Carotid artery | 105 ± 2 | 144 ± 3* | 103 ± 2 | 126 ± 3*† |
| Femoral artery | 105 ± 2 | 94 ± 4* | ||
| Pulse pressure, mmHg | 39 ± 1 | 63 ± 6* | 40 ± 2 | 46 ± 2† |
| Heart rate, bpm | 319 ± 20 | 350 ± 14 | 318 ± 12 | 353 ± 13 |
Mean arterial pressure was measured in the carotid artery, which is the area above the constriction, and in the femoral artery, which is the area below the constriction.
Significant differences (P < 0.05) between sham and coarcted rats.
A significant difference (P < 0.05) between coarcted groups (n ≥ 5).
Role of AngII in the Hypertrophy Response.
AngII is a chemical mediator of the stretch response in vitro (3) and the PO response in vivo. It is released from ventricular cardiomyocyte granules and acts on cardiac myocytes, through the AT1a receptor subtype, to initiate alterations in gene expression that result in hypertrophic growth of the myocardium (3–7). To determine if the increased AT1aR promoter activity in response to CoA is mediated by AngII, activity from pAT1LUC was measured in coarcted and control groups of animals treated with the angiotensin-converting enzyme inhibitor captopril before and during the period of CoA. Captopril treatment significantly reduced carotid mean arterial pressure in the CoA group, but blood pressure remained significantly elevated compared with the captopril-treated control group (Table 2). Captopril treatment reduced AT1aR promoter activity by 62% in the CoA group (P < 0.0001) and by 50% in the control group (P ≤ 0.047) (Fig. 1B). Although the level of AT1aR expression in the CoA group appeared higher than in the control group, this difference was not significant. Therefore, the AT1aR promoter PO response was abolished even though mean arterial pressure remained significantly elevated. These results, interpreted in the context of previous work in isolated cardiac myocytes, suggested that the PO response is mediated by AngII (3–7). To test this possibility, neonatal cardiac myocytes were isolated and transfected with pAT1LUC and cultured in the absence or presence of 100 nM AngII. AngII treatment increased expression from the AT1a promoter by 1.6-fold (Fig. 1C). This response was identical to the PO response in vivo. Taken together, these results strongly suggest that AngII is a mediator of AT1aR transcription in the heart and indicate a direct correlation between AngII levels and AT1aR promoter activity. Moreover, they suggest the potential for a positive feedback loop, which results in higher receptor levels in cardiac myocytes and maintenance or amplification of AngII effects.
AP-1 and GATA DNA Binding Motifs Within the AT1aR Promoter Are Regulators of the Hypertrophy Response.
The prototypical AT1 receptor-dependent transcriptional response to stretch or AngII treatment of cardiac myocytes is the rapid induction of the immediate early gene c-fos (4, 6). This results in the accumulation of c-Fos protein, which interacts with Jun family members to constitute AP-1 activity. CoA also has been shown to increase c-fos mRNA levels in the heart (22). A consensus AP-1 binding site was identified from position −387 to −381 (5′-TGAGTCA-3′) (26) in the AT1aR promoter. When this site was mutated in pAT1LUC the PO-induced increase in AT1aR promoter activity was abolished (Fig. 1B) (P ≤ 0.009). In contrast, this mutation had no significant effect on the basal activity of this promoter in sham-operated rats (AP1 mut, Fig. 1B). These results establish that the PO response, but not basal expression, of the AT1aR promoter is regulated by the AP-1 site and suggest that the AT1aR promoter is a downstream target of c-Fos.
A GATA motif (5′-AGATAA-3′) (27, 28) was identified in the AT1aR promoter between positions −282 and −277. This site was selected for study because it has been shown to be important for the cardiac muscle-specific expression of the α-MHC, troponin C slow/cardiac, brain natriuretic peptide (BNP), and atrial natriuretic factor (ANF) genes (9, 10, 29, 30). The latter is expressed in adult ventricular cardiac myocytes only in response to hypertrophic stimuli (22). The GATA site was mutated and the resulting plasmid, GATAmut, was assayed for activity. As with the AP-1 mutation, the GATA mutation abolished the PO response (P ≤ 0.001) but had no effect on basal expression (Fig. 1B). Mutation of an E-box site within this region had no effect on basal or PO-induced expression of the AT1aR promoter (n = 2, data not shown). Our results establish that both the AP-1 and GATA DNA recognition sequences in the AT1aR promoter are necessary for the PO-induced response but do not control basal expression in the adult rat heart (Fig. 1B). Because the GATA site is not active when AP1 is mutated and vice versa, our results demonstrate that the function of these sites in the PO response is interdependent. Thus, the work presented here suggests the hypothesis that a common pathway exists in which a functional interaction between the GATA and AP1 sites plays a necessary role in the hypertrophic response. A first prediction of this hypothesis is the presence of binding sites for these factors in the regulatory region of hypertrophy responsive genes. AP-1 and GATA sites can be found in several hypertrophy-responsive genes such as those encoding ANF, α-skeletal actin, and β-myosin heavy chain (β-MHC) (9, 29–34). It is noteworthy that the AP-1 site contributes to the hypertrophy response of the α-sk actin gene (34). Additionally, both AP-1 and GATA sites regulate the ANF gene in cultured cardiomyocytes (9, 29, 32, 35). However, an ANF promoter construct containing these sites did not support a PO response in transgenic mice (36). This result indicates that the AP-1 and GATA-4 sites are not sufficient but does not preclude a role for AP-1 and GATA-4 in the ANF PO response. Moreover, whereas the AT1aR AP-1 site acts as a positive effector, the ANF AP-1 site has been shown to be capable of both positive and negative control, suggesting a complex regulation (32, 35). The results with ANF notwithstanding, the AT1aR GATA-dependent response to PO, the regulatory role assigned to the AP-1 site in skeletal actin gene regulation, and the presence of AP-1 and GATA sites in the ANF regulatory region are consistent with the hypothesis that these factors participate in a regulatory pathway that responds to PO.
Trans-Acting Factors Associated with the AP-1 and GATA Sites.
Gel mobility shift assays were used to identify trans-acting factors in sham-operated control extracts (SE) and coarcted adult rat heart nuclear extracts (CE) that interact with the AP-1 sites. Competition experiments (Fig. 2A) demonstrated that the AP-1 interaction was specific for the AT1aR AP-1 site in the oligo. SE gave only a weak interaction with the AP-1 site but there was a substantial increase in AP-1 binding activity in CE (Fig. 2B, lanes 1 and 2). There was no difference in upstream stimulatory factor (ref. 18, data not shown) binding activity between SE and CE, suggesting that the difference in AP-1 activity was not an artifact of extract preparation. The mutant AP-1 site used in functional studies (Fig. 1B) failed to compete for factor binding (data not shown), indicating that interactions at this site regulate the PO response.
Figure 2.
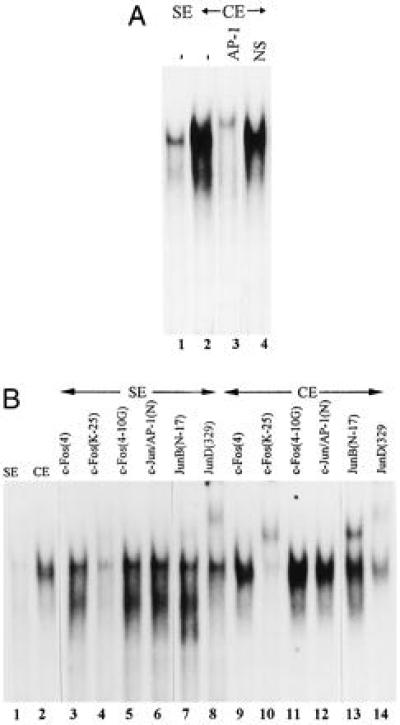
Fos and Jun B activities are induced in the heart by CoA. (A) Competition gel shift reactions with CE. SE and CE (15 μg of protein) were probed with radiolabeled ds AT1AP1. Competitors were AP-1 consensus (AP-1) and multiple cloning site (NS). (B) Identification of Fos and Jun family members on the AT1AP1 site. Gel shift and supershift reactions were performed using CE (15 μg) and two different amounts of SE [15 μg (lane 1) and 30 μg (lanes 3–8)]. Gel shift conditions are described in Materials and Methods. The indicated antibodies were added to the gel shift reactions at the start of the reaction (lanes 3–14). The specificities of the antibodies are described in the text.
Antibodies against Fos and Jun family members were used in supershift reactions to identify components of the complex formed with SE and CE. These antibodies include: c-Fos (4), a c-Fos-specific antibody; c-Fos (K25) and c-Fos (4–10G), both broadly reactive with Fos family members; c-Jun-AP1 (N), specific for c-Jun; and Jun B (N-17) and Jun D (329) specific for Jun B and D, respectively. In these experiments the amount of SE was increased to get a sufficient signal. In SE, weak supershifts were detected with c-Fos (25K) and Jun B(N-17) and a strong supershift was observed with Jun D (329). With CE, strong supershifts were seen with c-Fos (25K), Jun B(329), and Jun D (329) (Fig. 2B). These results demonstrate the presence of a Fos family member, Jun B and Jun D in the complex formed between the AT1aR AP-1 site and proteins in CE. We were unable to distinguish which Fos family member (hereafter referred to as Fos) was present in the complex using commercially available antibodies (Fig. 3 and data not shown). Inaccessibility of the epitope due to interactions between Fos and Jun family members might explain why some Fos antibodies did not react. Our results indicate that PO dramatically increases the level of Fos and Jun B in the heart, thereby increasing AP-1 activity.
Figure 3.
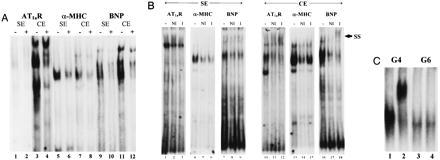
GATA sequence-specific DNA binding activities in SE and CE. (A) AT1aR (AT1GATA), α-MHC (α-MHC-GATA), and BNP (BNP-GATA) were radioactively labeled and used to probe SE or CE. Nonradioactive competitors were AT1GATAmut for odd-numbered lanes (−), α-MHC-GATA (lanes 2 and 4), or AT1GATA (lanes 6, 8, 10, 12). (B) GATA-4 DNA binding activity is present in CE but not in SE. SE (30 μg) and CE (15 μg) were probed with radiolabeled GATA probes as indicated under gel shift conditions described in Materials and Methods. Where indicated, no antibody (−), nonimmune serum (NI), or GATA-4 specific antiserum (I) were added to before incubation of the gel shift reaction. SS indicates the position of the supershifted bands in lanes 12 and 18. (C) Mouse GATA-4 and GATA-6 protein were prepared by in vitro transcription and translation and used in gel shift experiments with AT1GATA as probe. GATA-4 antibody (2 μl) was added at the start of the reaction in lanes 2 and 4.
A pathway in which PO triggers the release of AngII from cardiomyocytes and activates multistep pathways that increase levels of c-Fos, which, in conjunction with Jun B and D (Fig. 3), stimulates AT1aR gene expression (3–7), is supported by our results. While the role of the AP-1 site in the ANF promoter in PO-induced hypertrophy remains obscure (36), Jun B, but not Jun D, increases expression from the ANF promoter in cultured neonatal cardiac myocytes (32). If this AP-1 site regulates, in part, the PO response of the ANF promoter then increased Jun B activity (Fig. 2B) in the coarcted heart may be directly related to increased promoter activity of the AT1aR and ANF genes in heart muscle.
GATA sequence-specific interactions were detected on GATA sites from two genes that are up-regulated in response to hypertrophic stimuli (AT1aR and BNP) and one that is unaffected (α-MHC) (Fig. 3A). All three probes detected binding activity in CE and interactions from SE were seen on the AT1GATA and BNP-GATA probes. When equal amounts of SE and CE were compared for GATA binding activity, significantly more binding was detected in CE, and the bands obtained with the same probe were not equivalent between extracts (Fig. 3A). Surprisingly, no reproducible GATA binding activity was found in SE probed with AT1GATA. The AT1GATAmut oligo, containing the mutation used in the functional studies (Fig. 1B), failed to compete with AT1GATA for factor binding when CE was probed (Fig. 3A, lane 3). This result implicates the CE-dependent complexes formed on AT1GATA as regulators of the AT1aR PO response.
To determine if GATA-4 was present in the GATA sequence-specific interactions, GATA-4 antibody (I, Fig. 3B) and a FosB antibody (NI, Fig. 3B) were added to gel shift reactions. The GATA-4 antibody used was capable of supershifting a complex with in vitro-translated GATA-4 but not GATA-6 (Fig. 3C). In reactions containing SE, no supershift reaction could be detected on any of the GATA sites. There was no substantial difference between reactions containing the I and NI antibody but addition of either of these antibody preparations decreased the protein–DNA interactions (Fig. 3B). The reason for this is unknown, but a similar effect was seen with two other NI antibodies tested. These results indicate that if GATA-4 is present in SE, it is below the level of detection by this assay or that the epitope recognized by the antibody is masked in SE. In marked contrast, the GATA-4 antibody clearly supershifted the GATA site-dependent complex formed from CE probed with the AT1aR and BNP GATA sites. This supershift was absent in the reactions containing NI antibody. This result establishes the presence of GATA-4 in CE, that it is capable of forming complexes with the AT1aR and BNP GATA sites, and demonstrates that GATA-4 activity in CE is substantially higher than in SE on the AT1aR or BNP GATA sites.
No supershift reaction was detected with the α-MHC site (Fig. 3B), indicating that GATA-4 does not interact with this site. This result was very surprising given that GATA-4 mRNA is present in the adult mouse heart (28). However, our results indicate that GATA-4 DNA binding activity is very low or absent in the ventricles of the adult rat heart, and the increased GATA-4 activity seen in CE does not recognize the α-MHC site. Thus, GATA-5 or GATA-6 (37, 38), but not GATA-4, may interact with the α-MHC site. The abundance of GATA-6 mRNA in the adult mouse heart is consistent with this concept (38). These results point to different roles for GATA-4 subfamily members in transcriptional regulation in the heart, however, further experiments will be required to confirm this possibility.
We could not detect GATA-4 in SE or CE by immunoprecipitation and Western blotting but did detect it in extracts from cells transfected with a GATA-4 expression vector (data not shown). This suggests the available antibody was not sufficiently sensitive and precludes direct determination of GATA-4 protein levels in adult rat hearts. Therefore, we cannot at present distinguish between the possibilities that GATA-4 protein levels are increased in response to PO or that GATA-4 activity is increased by a posttranscriptional regulatory event.
Our results indicate that the AT1a receptor gene is expressed in the heart, expression is increased in response to PO, and the level of expression is dependent on AngII levels. There is an increase in Fos, Jun B, and GATA-4-associated DNA binding activity in response to PO. These factors interact with their sites in the AT1aR promoter to increase transcription. Transcription factors AP-1 and GATA-4 cooperate functionally during the PO response since the activity of each site depends on the other site being intact. This is not without precedence because a similar interaction has been demonstrated between GATA-2 and AP-1 in endothelial cells (39). These results also establish that AngII, working through the induction of immediate early genes, activates expression of the AT1aR gene, providing a potential positive feedback loop for potentiation of AngII effects. Because AP-1 and GATA-4 appear to regulate the hypertrophic response of two genes, our results also suggest a potential general regulatory pathway that mediates cardiac hypertrophy.
Acknowledgments
We gratefully acknowledge Jane Wolf and O.K. Hwang for expert technical assistance and Drs. Russell Wiese, Todd Leff, and Sherrie Tafuri for helpful discussions and critical review of the manuscript. This work was supported by Public Health Service Grants HL43662 (B.E.M.) and HL29587 (A.W.C.) from the National Heart, Lung, and Blood Institute. T.C.H. was supported in part by a National Institutes of Health postdoctoral fellowship. J.D.M. was a predoctoral fellow of the American Heart Association (Wisconsin affiliate). A portion of this work was carried out during B.E.M.’s tenure as an Established Investigator of the American Heart Association. S.M.J. was supported, in part, by the Medical Scientist Training Program at the Medical College of Wisconsin.
ABBREVIATIONS
- AngII
angiotensin II
- AT1aR
AngII type1a receptor
- CoA
aortic coarctation
- PO
pressure overload
- oligo
oligonucleotide
- ds
double-stranded
- CAT
chloramphenicol acetyltransferase
- MHC
myosin heavy chain
- BNP
brain natriuretic peptide
- ANF
atrial natriuretic factor
- SE
sham-operated control extracts
- CE
coarcted adult rat heart nuclear extracts
References
- 1.Bailie M D, Donoso V S, Gonzalez N C. J Lab Clin Med. 1984;104:553–562. [PubMed] [Google Scholar]
- 2.Salgado, H. C., Skelton, M., Salgado, M. C. O. & Cowley, A. W., Jr. (1994) Hypertension 23, Suppl. I, I78–I81. [DOI] [PubMed]
- 3.Sadoshima J-I, Xu Y, Slayter H S, Izumo S. Cell. 1993;75:977–984. doi: 10.1016/0092-8674(93)90541-w. [DOI] [PubMed] [Google Scholar]
- 4.Sadoshima J-I, Izumo S. Circ Res. 1993;73:413–423. doi: 10.1161/01.res.73.3.413. [DOI] [PubMed] [Google Scholar]
- 5.Sadoshima J-I, Izumo S. Circ Res. 1993;73:424–438. doi: 10.1161/01.res.73.3.424. [DOI] [PubMed] [Google Scholar]
- 6.Sadoshima J-I, Izumo S. EMBO J. 1993;12:1681–1692. doi: 10.1002/j.1460-2075.1993.tb05813.x. [DOI] [PMC free article] [PubMed] [Google Scholar]
- 7.Yamazaki T, Komuro I, Kudoh S, Zou Y, Shiojima I, Mizuno T, Takano H, Hiroi Y, Ueki K, Tobe K, Kadowaki T, Nagi R, Yazaki Y. Circ Res. 1995;77:258–265. doi: 10.1161/01.res.77.2.258. [DOI] [PubMed] [Google Scholar]
- 8.Suzuki J, Matsubara H, Urakami M, Inada M. Circ Res. 1993;73:439–447. doi: 10.1161/01.res.73.3.439. [DOI] [PubMed] [Google Scholar]
- 9.Grepin C, Dagnino L, Robitaille L, Haberstroh L, Antakly T, Nemer M. Mol Cell Biol. 1994;14:3115–3129. doi: 10.1128/mcb.14.5.3115. [DOI] [PMC free article] [PubMed] [Google Scholar]
- 10.Molkentin J D, Kalvakolanu D V, Markham B E. Mol Cell Biol. 1994;14:4947–4957. doi: 10.1128/mcb.14.7.4947. [DOI] [PMC free article] [PubMed] [Google Scholar]
- 11.Takeuchi K, Alexander R W, Nakamura Y, Tsujino T, Murphy T J. Circ Res. 1993;73:612–621. doi: 10.1161/01.res.73.4.612. [DOI] [PubMed] [Google Scholar]
- 12.Langsford K, Frenzel K, Martin B M, Bernstein K E. Biochem Biophys Res Commun. 1992;183:1025–1032. doi: 10.1016/s0006-291x(05)80293-1. [DOI] [PubMed] [Google Scholar]
- 13.Molkentin J D, Markham B E. J Biol Chem. 1993;268:19512–19520. [PubMed] [Google Scholar]
- 14.Gustafson T A, Markham B E, Bahl J J, Morkin E. Proc Natl Acad Sci USA. 1987;84:3122–3126. doi: 10.1073/pnas.84.10.3122. [DOI] [PMC free article] [PubMed] [Google Scholar]
- 15.Muscat G E O, Kedes L. Mol Cell Biol. 1987;7:4089–4099. doi: 10.1128/mcb.7.11.4089. [DOI] [PMC free article] [PubMed] [Google Scholar]
- 16.Hemsley A, Arnheim N, Toney M D, Cortopassi G, Galas D J. Nucleic Acids Res. 1989;17:6545–6551. doi: 10.1093/nar/17.16.6545. [DOI] [PMC free article] [PubMed] [Google Scholar]
- 17.Gorman C M, Moffat L F, Howard B H. Mol Cell Biol. 1982;2:1044–1051. doi: 10.1128/mcb.2.9.1044. [DOI] [PMC free article] [PubMed] [Google Scholar]
- 18.Rosenthal N. Methods Enzymol. 1987;152:704–720. doi: 10.1016/0076-6879(87)52075-4. [DOI] [PubMed] [Google Scholar]
- 19.Molkentin J D, Jobe S M, Markham B E. J Mol Cell Cardiol. 1996;28:1211–1225. doi: 10.1006/jmcc.1996.0112. [DOI] [PubMed] [Google Scholar]
- 20.Ojamaa K, Petrie J F, Balkman C, Hong C, Klein I. Proc Natl Acad Sci USA. 1994;91:3468–3472. doi: 10.1073/pnas.91.8.3468. [DOI] [PMC free article] [PubMed] [Google Scholar]
- 21.Izumo S, Lompre A-M, Matsuoka R, Koren G, Schwartz K, Nadal-Ginard B, Mahdavi V. J Clin Invest. 1987;79:970–977. doi: 10.1172/JCI112908. [DOI] [PMC free article] [PubMed] [Google Scholar]
- 22.Izumo S, Nadal-Ginard B, Mahdavi V. Proc Natl Acad Sci USA. 1988;85:339–343. doi: 10.1073/pnas.85.2.339. [DOI] [PMC free article] [PubMed] [Google Scholar]
- 23.Lin H, Parmacek M S, Morle G, Bolling S, Leiden J M. Circulation. 1990;82:2217–2221. doi: 10.1161/01.cir.82.6.2217. [DOI] [PubMed] [Google Scholar]
- 24.Leinwand L A, Leiden J M. Trends Cardiovas Med. 1991;1:271–276. doi: 10.1016/1050-1738(91)90042-D. [DOI] [PubMed] [Google Scholar]
- 25.Vincent C K, Gualberto A, Walsh K. Mol Cell Biol. 1993;13:1264–1272. doi: 10.1128/mcb.13.2.1264. [DOI] [PMC free article] [PubMed] [Google Scholar]
- 26.Angel P, Imagawa M, Chiu R, Stein B, Imbra R J, Rahmsdorf H J, Jonat C, Herrilch P, Karin M. Cell. 1987;49:729–739. doi: 10.1016/0092-8674(87)90611-8. [DOI] [PubMed] [Google Scholar]
- 27.Merika M, Orkin S H. Mol Cell Biol. 1993;13:3999–4010. doi: 10.1128/mcb.13.7.3999. [DOI] [PMC free article] [PubMed] [Google Scholar]
- 28.Arceci R J, King A A J, Simon M C, Orkin S H, Wilson D B. Mol Cell Biol. 1993;13:2235–2246. doi: 10.1128/mcb.13.4.2235. [DOI] [PMC free article] [PubMed] [Google Scholar]
- 29.Thuerauf D J, Hanford D S, Glembotski C C. J Biol Chem. 1994;269:17772–17775. [PubMed] [Google Scholar]
- 30.Ip H S, Wilson D B, Heikinheimo M, Tang Z, Ting C-N, Simon M C, Leiden J M, Parmacek M S. Mol Cell Biol. 1994;14:7517–7526. doi: 10.1128/mcb.14.11.7517. [DOI] [PMC free article] [PubMed] [Google Scholar]
- 31.Thompson W R, Nadal-Ginard B, Mahdavi V. J Biol Chem. 1991;266:22678–22688. [PubMed] [Google Scholar]
- 32.Kovacic-Milivojevic B, Wong V S H, Gardner D G. Endocrinology. 1996;137:1108–1117. doi: 10.1210/endo.137.3.8603581. [DOI] [PubMed] [Google Scholar]
- 33.Alonso S, Garner I, Vandekerckhove J, Buckingham M. J Mol Biol. 1990;211:727–738. doi: 10.1016/0022-2836(90)90073-U. [DOI] [PubMed] [Google Scholar]
- 34.Paradis P, MacLellan W R, Belaguli N S, Schwartz R J, Schneider M D. J Biol Chem. 1996;271:10827–10833. doi: 10.1074/jbc.271.18.10827. [DOI] [PubMed] [Google Scholar]
- 35.McBride K, Robitaille L, Tremblay S, Argentin S, Nemer M. Mol Cell Biol. 1993;13:600–612. doi: 10.1128/mcb.13.1.600. [DOI] [PMC free article] [PubMed] [Google Scholar]
- 36.Knowlton K U, Rockman H A, Itani M, Vovan A, Seidman C E, Chien K R. J Clin Invest. 1995;96:1311–1318. doi: 10.1172/JCI118166. [DOI] [PMC free article] [PubMed] [Google Scholar]
- 37.Laverriere A C, MacNeil C, Mueller C, Poelmann R E, Burch J B E, Evans T. J Biol Chem. 1994;269:23177–23184. [PubMed] [Google Scholar]
- 38.Morrisey E E, Ip H S, Lu M M, Parmacek M S. Dev Biol. 1996;177:309–322. doi: 10.1006/dbio.1996.0165. [DOI] [PubMed] [Google Scholar]
- 39.Kawana M, Lee M-E, Quertermous E E, Quertermous T. Mol Cell Biol. 1995;15:4225–4231. doi: 10.1128/mcb.15.8.4225. [DOI] [PMC free article] [PubMed] [Google Scholar]