

Abstract
Although microdialysis is widely used to sample endogenous and exogenous substances in vivo, interpretation of the results obtained by this technique remains controversial. The goal of the present study was to examine recent criticism of microdialysis in the specific case of dopamine (DA) measurements in the brain extracellular microenvironment. The apparent steady-state basal extracellular concentration and extraction fraction of DA were determined in anesthetized rat striatum by the concentration difference (no-net-flux) micro-dialysis technique. A rate constant for extracellular clearance of DA calculated from the extraction fraction was smaller than the previously determined estimate by fast-scan cyclic voltammetry for cellular uptake of DA. Because the relatively small size of the voltammetric microsensor produces little tissue damage, the discrepancy between the uptake rate constants may be a consequence of trauma from microdialysis probe implantation. The trauma layer has previously been identified by histology and proposed to distort measurements of extracellular DA levels by the no-net-flux method. To address this issue, an existing quantitative mathematical model for microdialysis was modified to incorporate a traumatized tissue layer interposed between the probe and surrounding normal tissue. The tissue layers are hypothesized to differ in their rates of neurotransmitter release and uptake. A post-implantation traumatized layer with reduced uptake and no release can reconcile the discrepancy between DA uptake measured by microdialysis and voltammetry. The model predicts that this trauma layer would cause the DA extraction fraction obtained from microdialysis in vivo calibration techniques, such as no-net-flux, to differ from the DA relative recovery and lead to an underestimation of the DA extracellular concentration in the surrounding normal tissue.
Keywords: dopamine, implantation trauma, in vivo microdialysis, in vivo voltammetry, striatum
Microdialysis is widely used in neuroscience, pharmacology and medicine for in vivo monitoring of endogenous and exogenous substances. The technique is an invasive procedure requiring the implantation into target tissue of probes that are relatively large by comparison to dimensions of individual cells and intercellular space. Trauma induced in the brain by probe implantation is characterized by both short- and long-term histological, physiological and biochemical changes in nearby neural tissue (Benveniste and Diemer 1987; Benveniste et al. 1987; Westerink and De Vries 1988; Ruggeri et al. 1990; Shuaib et al. 1990; Robinson and Camp 1991; Allen et al. 1992; Camp and Robinson 1992; Georgieva et al. 1993; Fumero et al. 1994; de Lange et al. 1995; Westergren et al. 1995; Morgan et al. 1996; Grabb et al. 1998; Groothuis et al. 1998; Clapp-Lilly et al. 1999). The consequences of probe-associated trauma, however, are not well understood. In particular, the manner and the degree to which the trauma might compromise interpretation of microdialysis measurements are generally unclear.
Regulation of brain dopamine (DA), a neurotransmitter involved in the functions of cognition, motivation and motor control (Le Moal and Simon 1991; Schultz 1998), has been extensively studied by microdialysis (Robinson and Justice 1991). Despite relative uniformity in the practice of the microdialysis technique, various theoretical models used to interpret results have led to predicted steady-state levels of extracellular DA differing by three orders of magnitude (Lindefors et al. 1989; Benveniste and Huttemeier 1990; Justice 1993). Failure to account properly for probe-induced trauma may also contribute to the wide range of concentration estimates. Indeed, microdialysis sampling of DA would be particularly sensitive to the trauma layer adjacent to the probe due to the high affinity neuronal transporter clearing released neurotransmitter from extracellular space (ECS) (Horn 1990; Giros et al. 1996). In general, the amount of tissue that donates analyte to the dialysate depends inversely upon the avidity of extracellular clearance mechanisms such as cellular uptake, interstitial catabolism or efflux to the blood. For DA as well as any analyte rapidly cleared from interstitium, the condition of the tissue in close proximity to the probe is therefore of primary concern. Dopamine neurotransmission appears compromised in the trauma layer, as evidenced by the incomplete decrease in dialysate DA levels after perfusing the probe with a medium containing tetrodotoxin or depleted in calcium (Westerink and De Vries 1988). Delaying the collection of dialysate for assay to allow constancy of indicators such as neurotransmitter concentrations, furthermore, is not suitable as conditions may not represent normalcy but rather a different quasi-steady state or a compensatory adaptation to injury (Robinson and Camp 1991).
The dominant approach in the last decade for estimating steady-state levels of extracellular DA in the brain is the so called concentration-difference or no-net-flux measurement (Justice 1993). In this method, the analyte concentration perfused into the probe (inflow) is varied, and the difference between the inflow and outflow analyte concentration is plotted versus the inflow concentration. Theory predicts that the inflow concentration resulting in the zero concentration-difference point indicates what the analyte extracellular concentration would have been in the absence of the probe (Bungay et al. 1990). Another prediction is that the extraction fraction, which describes the exchange of DA between the probe and the tissue, equals the relative recovery of DA from the tissue under both steady-state (Bungay et al. 1990) and transient conditions (Morrison et al. 1991; Chen et al. 2002). The low nanomolar (5–10 nM) concentrations in the striatum yielded by the no-net-flux approach is thought to reflect the high efficiency and density of the DA transporter (Justice 1993). However, in an elegant series of studies, Michael and coworkers recently proposed that a trauma layer devoid of DA release and uptake capacity causes a difference between the extraction fraction and relative recovery such that the extracellular DA level is underestimated (Lu et al. 1998; Peters and Michael 1998; Yang et al. 1998). Strong evidence was provided for compromised release, but uptake was not evaluated. The same research group has additionally demonstrated that focal application of a glutamate antagonist reduced a real-time voltammetric microsensor signal equivalent to a drop in DA concentration of 485 nM (Kulagina et al. 2001). Although the electrochemical technique employed, fast scan cyclic voltammetry (FSCV), is not capable of determining an absolute basal level of DA, it is well suited for monitoring concentration differences occurring over short sampling times (Garris and Wightman 1995). Thus, evidence obtained by an alternative analytical method to microdialysis suggests that the extracellular DA concentration in the striatum greatly exceeds the low nanomolar estimates of the no-net-flux method.
The present study extends the mathematical model previously developed to provide a quantitative relationship between dialysate and extracellular concentration in steady-state microdialysis (Bungay et al. 1990). The revised model applies to general situations in which the mechanisms for analyte supply and removal are abnormal in a thin layer of tissue adjacent to the probe. By distinguishing between these functional characteristics in the abnormal layer and the surrounding tissue, the model clarifies the difference between extraction fraction (determinable from dialysate measurements) and relative recovery (potentially inaccessible by dialysate measurements alone).
In the present case, the modified theory uses the extraction fraction from no-net-flux measurements to calculate a rate constant for DA clearance. This clearance rate constant is found to be smaller than the one determined from FSCV for cellular uptake (Garris et al. 1994a). Because the small voltammetric microsensors produce minimal tissue damage (Allen et al. 2001), discrepancies between the two clearance measurements might arise from various factors, such as tissue damage related to probe implantation, accumulation of fluid ultrafiltered through the probe membrane or formation of an abnormal tissue layer as a reaction of the tissue to the probe. Given that measurements to be reported are restricted to acute experiments in anesthetized rats, the most probable cause of local abnormality is trauma. Consistency with the rate constant measured by voltammetry is achieved by invoking the hypothesis that, as a consequence of implantation trauma, DA release is abolished and uptake is reduced in the traumatized tissue layer.
Methods
Probe construction
Two fused silica tubes (100 μm o.d.; 40 μm i.d., Polymicro Technologies, Inc., Phoenix, AZ, USA) were inserted into a plastic connector fitted with a guide cannula (Plastics One, Roanoke, VA, USA). While viewing under a microscope, the ends of the silica tubes were placed such that one (outflow tube) was flush with the end of the guide cannula and the other (inflow tube) extended either 1, 2, 3, or 4 mm beyond the end of the guide cannula. The tubes were secured to the connector with Superglue. The guide cannula was removed and a cellulosic membrane with a 13-kDa molecular weight cutoff (220–240 μm o.d.; Spectrum Medical, Houston, TX, USA) plugged at one end with polyimide resin (Alltech, Deerfield, IL, USA) was placed over the two silica tubes and sealed to the silica tubes with the polyimide resin. The membrane, as well, was coated with resin down to the end of the outflow tube such that the area available for diffusion was limited to the region between the end of the outflow tube and the resin plug at the probe tip. The functional length of the membrane corresponded approximately to the displacement between the ends of the silica tubes plus the gap between the inflow tube and the plug. At least 24 h was allowed for curing of the polyimide resin before probe use.
In vivo microdialysis
All in vivo experiments were performed using microdialysis probes with a 4-mm nominal active length. Male Wistar rats (275–350 g; Harlan Sprague-Dawley Inc., Indianapolis, IN, USA) were anesthetized with 400 mg/kg of chloral hydrate administered intraperitoneally and placed in a stereotaxic apparatus. The guide cannula was implanted in the striatum using coordinates AP + 2.7 mm, ML − 2.7 mm from bregma and DV − 2.7 mm from dura; incisor bar at +5.0 mm (Pellegrino et al. 1979) and secured with cranioplastic cement. The probe was inserted and perfusion with artificial cerebrospinal fluid (aCSF, 145 mM NaCl, 2.8 mM KCl, 1.2 mM CaCl2, 1.2 mM MgCl2, 0.25 mM ascorbic acid, 5.4 mM D-glucose, pH 7.2–7.4) was begun at 0.2 μL/min using a 500-μL gas-tight syringe (Hamilton, Reno, NV, USA) and either a Harvard Model 2274 (Harvard Apparatus, Holliston, MA, USA) or KD Scientific Model 100 syringe pump (KD Scientific, New Hope, PA, USA). After 1 h the perfusion rate was gradually stepped up to 0.6 μL/min. After 1 h at this flow rate, sampling at intervals of 10 min was begun. The perfusate concentration was then varied randomly between 100, 200, and 400 nM DA in aCSF. At least three samples at each concentration were collected. Samples were stored on dry ice until analysis. Rats were given 0.1 mL of a 400-mg/mL chloral hydrate solution as determined by response to tail-pinch. After the experiment, rats were given a lethal dose of chloral hydrate and perfused intracardially with saline followed by 10% formalin. The brain was harvested and sliced in 50-μm sections using a freezing microtome. Probe placement in the striatum was confirmed from these slices.
All experiments were carried out according to the National Institute of Health Guide for the Care and Use of Laboratory Animals, using procedures approved by the Emory University Institutional Animal Care and Use Committee. Efforts were made to minimize animal suffering, and reduce the number of animals used.
The steady-state DA concentrations measured in the outflow dialysate samples, and the measured inflow perfusate concentrations, (including the initial ), were plotted as against . The mathematical model derived in the Appendix for the effects of implantation trauma on microdialysis predicts that, for sufficiently small , the plot should be described by the linear equation
| (1) |
Whereas is the supply concentration for exogenous DA in the perfusate, is an apparent extracellular concentration providing the driving force for diffusion of endogenous DA towards the probe. When these two concentrations are equal, there should be no net exchange of DA between the perfusate and the tissue. This ‘point of no-net-flux’ x-axis intercept from the plot is then , sometimes previously denoted by Cnnf. According to the model, the slope, designated as the DA extraction fraction in vivo, is given by
| (2) |
in which P̂ is an overall permeability of the probe and tissue to the DA, Ao is the outer surface area of the membrane available for DA exchange and Qd is the perfusate volumetric flow rate. The overall permeability is composed of contributions from the probe and the tissue that are interrelated in the usual sum of permeability reciprocals for transport layers in series,
| (3) |
In the above, Pp is the probe permeability whose in vitro evaluation is described in the next section. Pt is the permeability of the tissue. The permeabilities are related to the mass transport resistances, R, employed previously (Bungay et al. 1990) by the general equation
| (4) |
One advantage of formulating the model in terms of permeabilities instead of resistances is that the former are much less dependent upon the size and other geometric aspects of the probe than the latter. Other than the conversion from resistances to permeabilities, equations 1–3 are of the same form as those previously obtained for steady-state microdialysis in the absence of implantation trauma (Bungay et al. 1990). An important difference from the previous expressions is in the appearance of the apparent extracellular concentration, , in place of the normal spatially averaged extracellular concentration far from the probe, .
The magnitude of the tissue permeability to an analyte, such as DA, is determined by three quantities: the tissue extracellular volume fraction (φe), the diffusion coefficient for DA in the ECS (De), and the rate constant for clearance of DA from the ECS (ke). Each of the three quantities could vary spatially as a result of implantation trauma. Dykstra et al. (1992) estimated that the interstitial volume fraction in rat striatum is enlarged to about 0.35 for radial distances at least 1.5 mm from the probe during at least the first few hours following probe implantation. Since the exchange of DA with the probe is likely to occur over tissue distances more than an order of magnitude shorter, the volume fraction is assumed to be uniformly enlarged. A uniform DA interstitial diffusion coefficient is likewise assumed. However, the model proposes that the avidity of DA clearance will differ between the traumatized and normal tissue regions. The combined contribution of the two regions is represented in the model by an apparent clearance rate constant, . With these assumptions, the model suggests that the relationship between these parameters and tissue permeability can be approximated by
| (5) |
This expression implicitly presumes that the extracellular concentrations, Ce, are much less than the Michaelis–Menten constant for uptake, Km.
In vitro probe characterization
A flow cell used for the probe characterization is indicated schematically in Fig. 1. The cell held the probe concentrically in a 1/8 inch i.d. stainless steel flow channel through which aCSF was recirculated by a variable-speed Waters HPLC pump (Waters Corp., Milford, MA, USA) from a 500-mL reservoir maintained at 37°C. A screw-drive syringe pump (Harvard) delivered aCSF containing DA to the probe at the same flow rate of 0.6 μL/min employed to perfuse the probe internally in the in vivo experiments. The steady-state DA concentration in the outflow dialysate, , was determined at flow-channel mean velocities, vext, of 0.1, 0.2, 0.4 and 4 cm/s produced by pumping the external medium at volumetric flow rates of 0.42, 0.85, 1.7, and 17 mL/min. Extraction fractions for DA loss from the perfusate were calculated as
Fig. 1.

Schematic diagram for the characterization of microdialysis probes in vitro. The dopamine concentrations in the perfusate and dialysate are indicated by and and the volumetric flow rate of these solutions by Qd. The probe is held concentrically in a stream of external medium pumped axially along the probe membrane at a mean velocity of vext. The probe and external medium are maintained at 37°C by immersion in a temperature controlled water bath.
| (6) |
for fixed inflow concentration of nM DA. A linear regression of the values as a function of 1/vext was extrapolated to the well-stirred limit, for 1/vext = 0.
Probes were used that had displacements between the inflow and outflow tube openings of 1, 2, 3 and 4 mm. The 4-mm probe batch was different than that employed in the in vivo experiments. The predicted logarithmic dependence of upon membrane length can be written as (Bungay et al. 1990)
| (7) |
In the above, the outer surface area of the membrane is Ao = 2π·ro·lm, in which ro is the membrane outer radius and lm = ln + la is the effective membrane length available for exchange. The nominal length, ln, is based on the offset between the ends of the side-by-side inner tubes. The functional membrane length can exceed the nominal length by an additional length, la.
Chromatography
In vivo
Dialysate samples were analyzed for DA concentration using microbore HPLC with electrochemical detection using a 10-cm × 0.5-mm column packed with a 5-μm C18 stationary phase (Alltech) and a sample injection loop of either 0.5 or 1.0 μL. The pH 3.7 mobile phase consisted of 28.5 mM sodium phosphate monobasic, 25 mM citric acid, 13% methanol (v/v), 0.1 mM disodium ethylenediamine tetraacetate (Na2EDTA) and 1 mM octyl sodium sulfate, and was delivered with an ISCO LC-5000 syringe pump (ISCO, Lincoln, NE, USA). Dopamine was detected with either an EG&G Princeton Applied Research (Model 400, Oak Ridge, TN, USA) or Bioanalytical System (Model LC-4C) amperometric detector using a working and a reference electrode (Model RE1, West Lafayette, IN, USA) from Bioanalytical Systems Inc. The applied potential was + 0.7 V versus Ag/AgCl. Dialysate samples were manually injected using a 10-μL Hamilton syringe. Dopamine concentration was calculated using an external standard curve composed of the peak heights resulting from injection of aliquots from the perfusate solutions of 0, 100, 200, and 400 nM DA.
In vitro
Conditions were similar to those above except a CMA 200 microsampler (CMA/Microdialysis, N. Chelmsford, MA, USA) maintained at 5°C with a 2-μL injection loop was used. Chromatograms were collected and quantitated using a Shimadzu Class VP chromatography data acquisition program.
Results
In vitro probe characterization
Analysis of the in vivo measurements requires knowledge of the transport characteristics of the probe in the form of the permeability, Pp, evaluated with the aid of the in vitro system in Fig. 1. First, DA extraction fractions in vitro were measured and found to be sensitive to the mean velocity of the external fluid flowing past the probe (Fig. 2). The extraction fraction values ( ) at the well-stirred limit were obtained as the y-axis intercepts corresponding to extrapolation of the external solution velocity, vext, to infinity. The intercept values, in turn, were plotted as against the nominal membrane lengths, ln (Fig. 3), yielding a straight line in accordance with equation 7. The x-axis intercept of − 0.35 mm indicates that the length of the membrane accessible for DA exchange was actually la = 0.35 mm longer than the nominal value for each probe that was derived from the difference in positions of the ends of the inflow and outflow tubing. The probe permeability (mean ± SE) calculated by applying equation 7 to the four values is Pp = (2.92 ± 0.05) ×10−4 cm/s.
Fig. 2.

Determination of well-stirred in vitro dopamine extraction fraction, , by extrapolation. The points indicate extraction fraction values, Evitro, calculated according to the definition, equation 6, from measured values of the inflow and steady-state outflow concentrations, and , for various external solution mean velocities, vext. The intercept at 1/vext = 0 obtained by linear regression is . The nominal membrane lengths and (mean ± SE) values are: ■, 1 mm, 0.244 ± 0.002, n = 4; ●, 2 mm, 0.405 ± 0.009, n = 4; ▲, 3 mm, 0.529 ± 0.017, n = 4; ▼, 4 mm, 0.604 ± 0.007, n = 4.
Fig. 3.

Determination of the length of membrane available for dop-amine exchange by regression of the well-stirred extraction fraction intercepts, , from Fig. 2 plotted as a function of the nominal membrane length, ln.
In vivo dopamine clearance
The concentration differences plot for concentrations from 0 to 400 nM (Fig. 4) yielded a slope (mean ± SE) of Evivo = 0.52 ± 0.04 and an intercept at the point of no net flux of nM. The corresponding values for the narrower range of nM are Evivo = 0.54 ± 0.10 and nM. From equation 2, the overall permeability value for Evivo = 0.54, outer radius, ro = 0.12 mm, and effective in vivo membrane length, lm = 4.35 mm, is P̂ = − (Qd/Ao)·ln[1 − Evivo] = 2.4 × 10 −4 cm/s.
Fig. 4.

In vivo dopamine extraction fraction, Evivo, and apparent extracellular concentration, , obtained by the concentration difference (no-net-flux) technique. Probes implanted in anesthetized rat striatum were alternately and randomly perfused with artificial cerebrospinal fluid containing 0, 100, 200 or 400 nM dopamine. According to equation A20, Evivo is the coefficient of proportionality between the perfusate concentration difference for inflow and outflow, , and the inflow value, . Each point is a mean ± SE from five rats and the slope and intercept at by linear regression are Evivo = 0.52 ± 0.01 and nM, respectively, and Evivo = 0.54 ± 0.10 and nM if the 400 nM data are excluded.
From equation 3, the tissue permeability is
| (8) |
and from equation 5, the DA apparent clearance rate constant is
| (9) |
where φe = 0.35 is taken from the measurement for anesthetized rat striatum surrounding an acutely implanted probe (Dykstra et al. 1992), and De = Dd/λ2 = 3.2 ×10⁻⁶ cm2/s is calculated from the free solution value of Dd = 7.6 × 10⁻⁶ cm2/s and a tortuosity of λ = 1.54 (Rice 2000).
Discussion
Clearance rate constant
Microdialysis measurements represent spatial averages over a tissue volume determined by the accessible length of the membrane and the distance over which the analyte has to diffuse through the tissue to participate in exchange with the perfusate. For this study, the value calculated for the apparent rate constant for DA clearance from rat striatum ECS, , is an average over axial distances (> 4 mm) that are of the order of the transverse dimension of this tissue. This value differs from estimates obtained by FSCV for DA clearance following electrically stimulated release. Small FSCV microdisk electrodes (glass-insulated carbon fibers with a 10-μm diameter) detect variation in uptake rates with electrode position indicative of considerable spatial heterogeneity. Larger microcylinder electrodes of the order of 200 μm in length yield signals that are much less sensitive to position (Lu et al. 1998), suggesting spatial averaging similar to that for microdialysis probes. To obtain a spatial mean over a distance comparable to the length of the microdialysis probe, we averaged values from 95 FSCV DA clearance rate measurements taken at different dorsoventral positions in the rat striatum (Garris et al. 1994a). This yielded a mean ± SE of Vm = 3.0 ± 0.2 μM/s (range, 0.3–8 μM/s). A rate constant can be obtained by dividing Vm by the Michaelis–Menten Km for the DA transporter. Reported values for Km in the range of 0.13–0.4 μM (Nicholson 1995) would correspond to spatial-average rate constants of ke = 7.5–23 s −1. The most commonly cited value of Km = 0.2 μM gives a value of ke = 15 s −1. Correcting the FSCV DA clearance rates for diffusional distortion or peak stimulated extracellular DA concentrations would likely increase this ke estimate. We hypothesize that the discrepancy between the microdialysis apparent rate constant for DA clearance and the average FSCV value primarily results from a reduction in the local DA clearance rate in the tissue that is traumatized by the microdialysis probe implantation.
A number of factors could contribute to the magnitude of the discrepancy between the microdialysis and voltammetry DA clearance values. FSCV may overestimate the basal rate constant in normal striatum because the elevated extracellular DA levels elicited by medial forebrain bundle stimulation during FSCV could augment uptake rates through autoreceptor stimulation (Meiergerd et al. 1993; Dickinson et al. 1999; Schmitz et al. 2002). The microdialysis estimate depends on several parameters not measured in the current experiments. An important parameter is the extracellular volume fraction, φe, as can be inferred from the inverse square dependence of upon φe in equation 9. The value e for φe was estimated to be 0.35–0.4 for the tissue extending at least 1.5 mm from microdialysis probes acutely implanted in rat striatum (Dykstra et al. 1992). This is considerably higher than normal striatal values of about φe = 0.2 estimated from other techniques (Patlak and Fenstermacher 1975; Rice and Nicholson 1991) indicating edema formation as one major consequence of probe implantation. The alteration of the extracellular volume has a direct influence on the microdialysis calculation of and also indirect effects. A direct influence is through the appearance of φe in equation 9 that arises, in part, from defining on the basis of extracellular volume. The second source of the appearance of φe in equation 9 is the restriction of DA diffusion through tissue to the interstitial space. The variation of the DA interstitial diffusion coefficient, De, with φe has been neglected in the calculations. Tortuosity measurements in rat cortical slices subjected to osmotic stress indicate that De for the low-molecular-weight cation, tetramethylammonium, increased only slightly as φe increased from 0.24 in normal medium to 0.42 in a hyperosmolar bathing solution (Nicholson et al. 2000).
In addition to the induction of edema, other traumatic effects have been associated with probe implantation. The blood–brain barrier is disrupted in the vicinity of the probe. Although albumin does not extravasate locally if administered intravenously more than 30 min after probe insertion (Dykstra et al. 1992), increased barrier permeability to small molecules and 70 kDa dextran is reported to persist up to 4 weeks after probe insertion in the brain (Groothuis et al. 1998). Dialysate levels of DA (Westerink and De Vries 1988), and probably other brain constituents, are transiently elevated following probe implantation. Initial changes in ECS DA following implantation could result from mechanical disruption and loss of intraneuronal DA to the ECS. Residual intact neurons might rapidly clear DA that appears in the ECS by direct damage. However, alterations in the chemical composition of the ECS could, as well, impair the function of intact neurons with respect to their avidity of DA release and uptake. The mathematical model presented in the Appendix was formulated to simulate the effect of impaired analyte supply and removal processes confined to a thin traumatized layer of tissue adjacent to the probe (region ‘tr’ in Fig. 5). The parameters describing the rate of analyte supply and removal in the trauma layer and the surrounding tissue (region ‘n’) are independent variables that allow various possibilities to be explored. The possibilities are examined in the present context in terms of reduced DA release and uptake in the trauma layer. Impairment of different supply and removal mechanisms in the trauma layer could occur for other analytes.
Fig. 5.
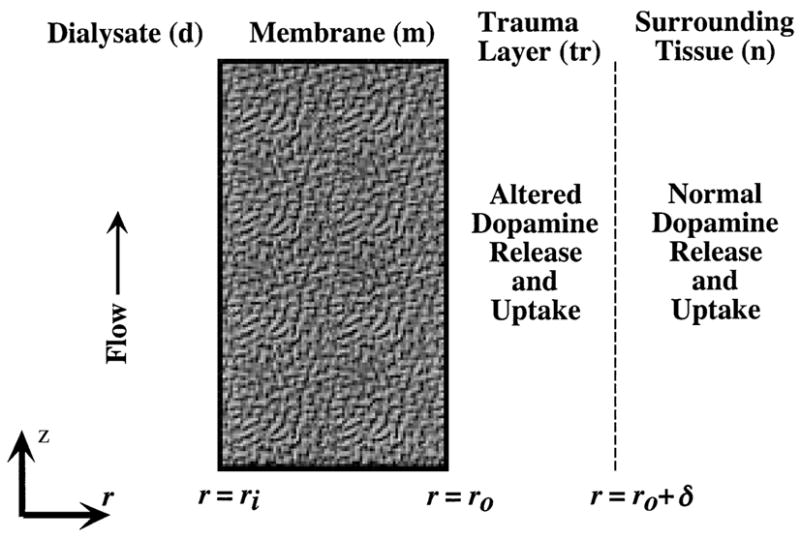
Geometry for proposed model of microdialysis with a traumatized layer of tissue immediately adjacent to the probe membrane. The radial distance from the probe axis is denoted by r and the axial distance from the inlet end of the membrane is z. The inner and outer radii of the membrane (m) are ri and ro, respectively, and the thickness of the trauma layer (tr) is δ. The surrounding tissue layer (n) is of effectively semi-infinite extent.
Trauma layer thickness
Interpretation of the degree of reduction in DA uptake in the trauma layer is a function of the unknown trauma layer thickness, δ. In determining the influence of δ, we begin by setting the uptake rate constant for the surrounding normal tissue equal to the FSCV value for Vm = 3.0 ± 0.2 μM/s and Km = 0.2 μM,
| (10) |
which yields a value for the tissue permeability in this region from equation A12 of Pn = 2.5 × 10 −3 cm2/s. The trauma layer permeability, Ptr, can then be obtained by quadratic solution of equation A15, together with the tissue permeability, Pt, in equation 8 evaluated from the and Evivo measurements. Iteration was employed to determine the dependence of the uptake rate constant in the trauma layer, , on δ and the results are displayed in Fig. 6. Any trauma layer thickness greater than about 4 μm satisfies the constraints imposed by the measurements and assumed parameter values. For trauma layer thickness in the approximate range, 4 μm < δ < 20 μm, uptake in both the trauma layer and the surrounding tissue influence . For δ > 20 μm, the participation of the trauma layer predominates in the exchange of DA between the tissue and the probe and then represents the trauma layer rate constant. Since the tissue permeability calculation is independent of zero-order supply processes, the results in Fig. 6 apply to any rate of DA release in the trauma layer.
Fig. 6.

Because of the dependence on the unknown microdialysis trauma layer thickness, δ, the rate constant for dopamine clearance in the trauma layer, , can be any value between zero and , the apparent clearance rate constant obtained from the no-net-flux analysis. For δ greater than 13 μm, is within 5% of the apparent clearance rate constant, .
Distinguishing between apparent and normal extracellular concentrations
Electrochemical techniques have been useful for measuring DA concentrations when extracellular levels have been artificially elevated by such means as local administration of exogenous DA or electrical stimulation to evoke release of endogenous DA from intracellular stores. It has not been possible with these techniques to directly measure endogenous basal DA concentration in normal tissue ECS, denoted by . Consequently, microdialysis has been the principal source for current estimates of basal for DA in various tissues. However, it has been suggested that quantitative microdialysis strategies relying upon the measurement of a DA extraction fraction underestimate the extracellular DA levels in normal tissue (Lu et al. 1998; Peters and Michael 1998; Yang et al. 1998, 2000) for reasons related to spatial non-uniformity in DA release and uptake. Implantation trauma was proposed as one possible cause for the nonuniformity. The present analysis supports the contention that an underestimation of could be one of the consequences of trauma. Our model predicts that, in general, the apparent extracellular DA concentration from probe calibration techniques, , differs from . This inference applies not only to the no-net-flux technique, but also to other in vivo probe calibration techniques that rely upon dialysate concentration measurements. This includes techniques of retrodialysis (Wang et al. 1993) and variation of perfusate flow rate (Sam and Justice 1996; Tang and Gonzales 2001). According to the model, all of these techniques provide estimates of rather than the desired . The difference between and arises because represents a weighted average of the extracellular concentrations in both the trauma layer and the surrounding normal tissue. The weighting is expressed explicitly in equation A18 of the Appendix,
| (11) |
in which w is a weighting factor defined in equation A19 and is constrained to be 0 < w ≤1. The first term on the right side of equation 11, representing the contribution from the trauma layer, contains the virtual concentration, , interrelating the release rate, Str, and the clearance rate constant, , in the trauma layer. Similarly, is formed from the balance of the normal tissue release rate, Sn, and clearance rate constant, . The relative contributions of the two layers depend upon the degree of abnormality of release and clearance and the thickness of the trauma layer. Although all of this information is not known, the trauma model can provide constraints on the relationship between and . We will examine the constraints in the following special case.
Dopamine release abolished in trauma layer
Yang et al. (1998) placed voltammetric microelectrodes at locations immediately adjacent to and 1 mm from microdialysis probes implanted in anesthetized rat striatum. The electrodes away from the probes exhibited robust responses to electrical stimulation of the medial forebrain bundle, whereas no response was detected from the electrodes close to the probes or in the probe effluent. Yang et al. (1998) concluded that evoked DA release was suppressed in the tissue adjacent to the probes. These authors presumed that this tissue would lack viable uptake sites as well. However, the absence of uptake would permit DA to diffuse into the abnormal tissue and the probe from the surrounding normal tissue. Repetition of the electrical stimulation produced strong responses in the electrodes at all three locations in the presence of an inhibitor of the DA transport, nomifensine. This indicates that diffusion of DA through the abnormal tissue was possible. The lack of response to the first stimulation could have been the result of DA clearance in the abnormal tissue between the probe and viable DA release sites in the surrounding tissue, contrary to the presumption of Yang et al. Thus, in place of a passive layer lacking both release and uptake as suggested by Peters and Michael (1998) and Yang et al. (2000), our trauma model retains the possibility of clearance in the traumatized tissue, albeit with reduced avidity.
Since neurons are responsible for both DA release and uptake, it might be anticipated that loss of neurons in the trauma layer would eliminate both processes. The absence of release in the probe vicinity suggests that impulse flow is interrupted or ineffective in evoking DA exocytosis. Some neuronal damage mechanisms might lead to abolition of release without destruction of the neuron. For example, propagation of action potentials can be blocked by mechanical strain of axons. On the other hand, some level of DA clearance could be conserved in the DA nerve terminals that remain in the trauma layer. The process of DA uptake is simpler and likely to be more robust, since it can be observed in synaptosomal preparations and in non-neuronal cells engineered to express the transporter. Enzymatic degradation and loss to blood across microvessels should still exist and could even be enhanced by trauma. DA uptake without release would have implications for the maintenance of intracellular DA degradation.
The model simulates the observations of Yang et al. by setting in equation 11 to reflect the abolition of release in the trauma layer. The clearance rate constant in the trauma layer could be any value between zero and , depending on the trauma layer thickness, as indicated in Fig. 6. As noted above, for our measurements and assumed parameter values, the model predicts the trauma layer thickness to be at least 4 μm. For no release in the trauma layer, the relationship predicted between and , equation 11 reduces to
| (12) |
The limiting value of w = 1 corresponds to a trauma layer lacking both release and clearance. However, as noted above, the observations of Yang et al. suggest some DA clearance exists in the trauma layer requiring that w < 1. Clearance in the trauma layer creates a barrier for diffusion to the probe of endogenous DA released in the surrounding normal tissue. As a consequence, the intercept in the no-net-flux studies would underestimate the magnitude of as previously suggested (Peters and Michael 1998; Yang et al. 1998). From the model, the degree of underestimation is a strong function of the unknown thickness of the trauma layer as shown by the curve in Fig. 7 generated from equation 12, together with Appendix equations A15–A17 and A19. For example, if the trauma layer thickness were 20 μm, then Fig. 7 predicts that would be about 150 nM for the value of nM. Greater trauma layer thicknesses on the order of 30 μm might be able to reconcile the large discrepancy between reported DA Cnnf values and the basal ECS value of nM indirectly estimated for DA in the rat striatum (Kulagina et al. 2001). However, the model in the present form is restricted by linearity assumptions to Ce values much less than Km = 0.2 μM. The linearity of the data in Fig. 4 up to of 400 nM suggests that non-linearity in the combined DA clearance mechanisms is weak, even above the assumed Km value. Except for the computational complexity incurred by introducing non-linear concentration dependencies, the range of validity of the model could be extended to higher Ce values, if the high values are verified.
Fig. 7.
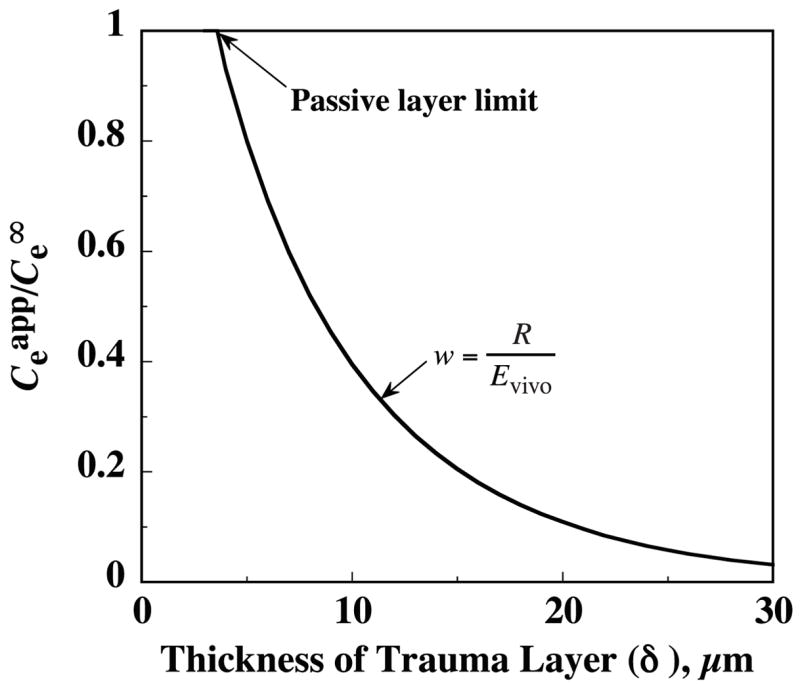
The discrepancy between the apparent extracellular dopamine concentration from the no-net-flux intercept, , and the true value far from the probe, , increases as the trauma layer thickness increases. The same dependence on δ applies to the discrepancy between the true relative recovery, R, and the in vivo extraction fraction, Evivo. For this illustrative calculation from equation 12, release is assumed to be abolished in the trauma layer .
Dissociation of extraction fraction from relative recovery
The above results can be viewed alternatively in terms of a difference between two measures of probe performance: extraction fraction and relative recovery. The latter term will be used in the restricted context of sampling endogenous DA,
| (13) |
This is the calibration factor that would be desirable for calculating the DA concentration in normal tissue ECS from the measurable levels of DA in the sampling mode probe effluent. The analysis predicts instead that all of the usual in vivo ‘calibration’ procedures yield Evivo rather than R. If an abnormal layer lacking release is the traumatic consequence of probe implantation, then these two calibration factors are discordant in the same proportion as the concentration ratio in Fig. 7. According to equation 12 and Appendix equation A24,
| (14) |
Arguments have been previously presented that such a distinction should be maintained between extraction fraction and relative recovery (Lu et al. 1998; Peters and Michael 1998; Yang et al. 1998), as well as between and the no-net-flux intercept concentration, . Although there is considerable similarity in the underlying reasoning, there are important differences between this report and these prior analyses. First, the model presented in the Appendix is not specific to DA or neurotransmitters. Second, the model is formulated in a cylindrical geometry appropriate to microdialysis probes, so the expressions developed from it have quantitative relevance to the interpretation of microdialysis measurements. Third, no artificial distinction is made between endogenous and exogenous analyte, so that consistent boundary conditions are imposed on both the sampling of analyte from the tissue by the perfusate and the delivery of analyte to the tissue from the perfusate. As a result, the expressions obtained for the extraction fraction apply to both sampling and delivery modes. There is no asymmetry between these operations, despite the spatial inhomogeneity in tissue properties that is introduced through subdividing the tissue into two distinct layers. Thus, the symmetry between sampling and delivery extraction arises from the assumptions of linearity in analyte concentration dependence in the governing equations and boundary conditions, not from an assumption of uniformity in tissue properties. No-net-flux measurements in a linear system produce straight lines when is plotted versus . The absence of a change in slope about the no-net-flux intercept at illustrates the sampling and delivery extraction symmetry predicted by the model. This underlying symmetry of microdialysis as a process is not inconsistent with a discrepancy between different measures of probe performance, such as Evivo and R.
By applying a consistent treatment of sampling and delivery, the model provides a cogent explanation for this distinction between extraction fraction and relative recovery, namely that they are based on potentially different extracellular concentrations: Evivo relates to from equation 1,
| (15) |
whereas R is defined in equation 13 in terms of . In the present analysis Evivo differs from R because the ratio of the DA release rate, S, to uptake rate constant, ke, in the trauma layer is different than in the normal tissue. If the regulation of DA concentration were preserved in the trauma layer by a proportional change in the release rate and clearance rate constant, i.e. , then and Evivo would not differ from R.
One limiting case in which equality of Evivo and R would hold is if both release and uptake were abolished, i.e. the trauma layer was passive. This is illustrated by the point on the curves in Figs 6 and 7 at which and w = 1 corresponding to a 4-μm thin passive layer. Thus, a passive layer will not lead to a difference between Evivo and R under steady-state conditions.
Uptake inhibition decreases extraction fraction while increasing relative recovery
Evivo and R will not be the same whenever the balance between analyte supply and clearance in the trauma layer differs from that in the surrounding tissue. For the DA analysis in which release is assumed absent in the trauma layer, R < Evivo. Michael and colleagues (Lu et al. 1998; Peters and Michael 1998; Yang et al. 1998) have provided evidence that uptake inhibition should cause an increase in R, while producing a decrease in Evivo. Simulations from the trauma model support this proposition. Values of Evivo and R have been calculated for proportionately decreased values of the trauma and normal tissue uptake rate constants, and , to simulate the effect of varying the degree of DA uptake inhibition. The results, plotted as a function of the fractional reduction in the rate constants, are displayed in Fig. 8. The curves exhibit the predicted opposing trends in Evivo and R, for most of their range. The exception is that the trend in R reverses at levels of nearly complete uptake inhibition. Another significant aspect of the simulations that support experimental observations (Parsons et al. 1991; Olson and Justice 1993; Smith and Justice 1994) is that uptake has to be nearly completely inhibited to reduce Evivo by 50% from its value in the absence of inhibition (right-hand ordinate intercept).
Fig. 8.
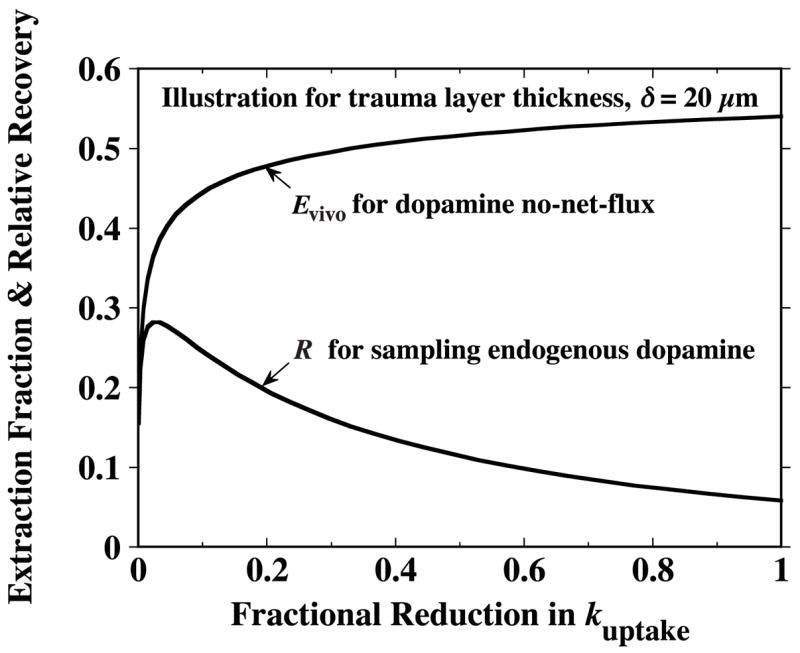
If dopamine release is abolished in the layer of traumatized tissue while uptake continues to occur throughout both this layer and the adjacent normal tissue, the extraction fraction, Evivo, exhibits a monotonic reduction as uptake is progressively inhibited. However, the true relative recovery, R, based on the dopamine extracellular concentration in the normal tissue increases as the degree of uptake inhibition increases (except in range of nearly complete inhibition). Uptake inhibition is simulated by proportionate reduction in both the normal and trauma layer uptake rate constants, and , respectively. The abscissa is the fraction reduction in these rate constants. In the absence of trauma, the curve for R would become the same as that for Evivo and likewise exhibit a monotonic decrease with uptake inhibition. For these illustrative curves, an arbitrary trauma layer thickness of δ = 20 μm was chosen.
The Evivo and R curves would converge to the same minimum, pure diffusion value in the limit of complete inhibition of clearance from ECS. The simulation employed for Fig. 8 assumes diffusion occurs only in the radial direction. For purely radial diffusion, the values of Evivo and R approach zero in the limit of no clearance. In actuality, the common limiting value Evivo and R and would be nonzero because axial diffusion through the ECS becomes significant as the analyte penetration depth increases. Additionally, other clearance mechanisms, such as chemical conversion and efflux to blood, have been neglected in the simulations for Fig. 8.
The strong influence of trauma layer thickness on relative recovery is further illuminated by examining the associated influence on the axially averaged (〈〉) extracellular DA concentration profiles shown in Fig. 9. For the trauma layer thickness of δ = 10 μm, about one-quarter of the overall concentration drop from to 〈Cd〉 occurs across the probe membrane and three-quarters within the tissue ECS. However, for δ = 30 μm, the concentration drop across the probe membrane would be only a small fraction of the total, while the majority of the drop appears across the tissue layers.
Fig. 9.

Predicted radial profiles in endogenous dopamine extracellular concentration produced by microdialysis sampling are strongly dependent upon the unknown thickness of the trauma layer. Profiles in the dialysate, probe membrane fluid and ECS of striatal tissue have been calculated from equations A27–A31 for δ = 10, 20 and 30 μm and the values, nM and Evivo = 0.54. Concentrations are normalized with respect to the distant undisturbed extracellular concentration, . Axial-averaging over the membrane length is indicated by the angle brackets. The extracellular concentration at the probe-tissue and trauma layer–normal tissue interfaces are denoted by and , respectively, and the radially averaged concentration in the dialysate by Cd.
Some assumptions
An implicit assumption in the analysis is that the tissue remains in intimate contact with the probe. It is possible that an additional resistance layer might be interposed, such as a coagulum formed from the disruption of blood vessels or dialysate fluid ultrafiltered through the membrane. As noted above, a passive 4-μm diffusion layer could account for the difference between the apparent clearance rate constant from microdialysis and the value from voltammetry. Since no supply or removal processes exist in a passive layer, there is no concentration gradient in the absence of a flux (Peters and Michael 1998). Consequently, passive layers would not interfere with the determination of the extracellular concentration in the surrounding tissue by a steady-state no-net-flux procedure. However, such a thin layer could not explain the absence of evoked release in the vicinity of the microdialysis probe (Yang et al. 1998).
The assumption that the trauma is confined to a discrete layer of abnormal tissue is probably an unrealistic idealization that has been employed to simplify the analysis. The deficit in DA release and uptake may well be spatially variable, which would imply that the distance over which the trauma extends is greater than that represented by the trauma layer thickness parameter. It is unclear whether our prediction that these functional deficits are confined to a thin region for acutely implanted probes is discordant with evidence of ultrastructural abnormalities at considerable distances from the probe observed more than 40 h post-implantation (Clapp-Lilly et al. 1999).
The trauma model treats each tissue region as a medium of uniform properties by invoking spatial averaging of the microscale variations. For DA the length scale for the spatial averaging would be of the order of the average separation distance between release sites. The density of dopaminergic terminals in the striatum leads to an estimate for the average spacing between terminals of the order of 2–4 μm (Doucet et al. 1986; Garris et al. 1994b). This spacing between release sites in normal striatum is similar to a characteristic distance for diffusion of DA from the release sites of √(De/ke) ~5 μm. This calculation assumes uptake is uniformly distributed and employs the approximate average DA uptake rate constant estimated from voltammetry measurements, ke = 15 s −1, and the estimate for the DA diffusion coefficient in the ECS of De = 3.2 × 10 −6 cm2/s. This measure of the DA diffusion distance in striatum is similar in magnitude to other conservative estimates: 9 μm (Rice 2000) and 7 μm (Gonon et al. 2000). These measures provide support for the continuum assumptions invoked by the model and the use of as a characteristic spatially averaged concentration in the distant normal tissue. Thus, the discrete nature of release and uptake sites does not play a role in the model.
Importance of probe characterization in vitro
Regardless of the degree of trauma, quantitative interpretation of the microdialysis measurements requires careful characterization of the probe in vitro. The present simulations have been based on the relatively small difference in extraction fraction measurements between in vitro and Evivo = 0.54 ± 0.10 in vivo. In this regard, it is instructive to note that the model predicts that in the absence of a trauma layer with the uptake rate constant set to the FSCV value of ke = 15 s −1, the in vivo extraction would be Evivo = 0.57. It would be difficult experimentally to discriminate between this in vivo value and the in vitro measurement. Tang and Gonzales (Tang and Gonzales 2001; Tang et al. 2003) performed DA no-net-flux measurements in the nucleus accumbens of freely behaving rats the day after probe implantation and found no statistically significant difference between in vivo and stirred in vitro values. The reduction in the DA apparent clearance rate constant estimated in the present study may be indicative of a greater degree of trauma with acutely implanted probes.
Whereas a well-stirred in vitro Ed value should exceed the corresponding in vivo value, Sam and Justice (1996) reported extraction fraction values that were less in vitro than in vivo. Although the in vitro medium was stirred in their experiments, it was not determined that well-stirred conditions had been attained because comparison of the in vitro and in vivo values was not one of the objects of the study (Sam and Justice 1996). There may have been other factors to account for the difference, since the values were obtained at different times with different probes.
Implications
Our results suggest that implantation trauma may introduce errors in the estimation of dopamine ECS concentrations and clearance rates. The magnitude of the errors cannot currently be determined and may vary with the length of time after implantation and with implantation procedure.
Similar difficulties in interpreting microdialysis measurements would be expected for other neurotransmitters and other substances that are rapidly cleared by mechanisms altered by the implantation injury. The degree of sensitivity to the trauma would depend upon the avidity of clearance, which will vary among these analytes and among brain regions for any given analyte.
The diffusion of slowly cleared substances would probably not be affected to the same degree. Thus, for exogenous agents delivered via the perfusate to test for the preservation of exocytotic DA release, such as tetrodotoxin or potassium (K+), diffusion into the surrounding tissue would probably be much less influenced. If so, such tests would not provide conclusive indication of the presence or absence of trauma.
Conclusions
We have modified the theoretical framework for microdialysis to allow for the existence of a tissue layer adjacent to the probe in which the rates of analyte supply and clearance processes are abnormal. We have utilized the model to explore the possibility that probe implantation traumatically alters the local rates of DA release and uptake. The apparent consequences for DA microdialysis would be a lack of equality between extraction fraction and relative recovery and an underestimation of the normal tissue DA extracellular concentration. Besides the implications for the effects of implantation trauma on the release and uptake of other neurotransmitters, the model has additional potential uses. One extension is underway to explore other implantation trauma effects, such as alterations in the local rates of analyte exchange between blood and tissue as suggested by reports of persistent modification in blood–brain barrier permeability (Morgan et al. 1996; Groothuis et al. 1998).
Abbreviations used
- aCSF
artificial cerebrospinal fluid
- DA
dopamine
- ECS
extracellular space
- FSCV
fast scan cyclic voltammetry
Appendix
Mathematical model of steady-state microdialysis with probe implantation trauma
The principal effects of probe implantation trauma are assumed to occur in a concentric layer of abnormal tissue interposed between the probe and surrounding normal tissue. The mathematical model to be developed is an extension of one previously proposed to describe microdialysis in a single tissue region of uniform properties (Bungay et al. 1990) on the spatial scale relevant to current microdialysis probes whose membrane diameters and lengths are greater than 0.2 mm and 1 mm, respectively. In these models the local variations in properties and concentrations associated with the individual cells and discrete sites of analyte supply and removal, such as blood vessels and synapses, are spatially averaged, since associated length scales separating these sites are on the order of 0.05 mm or smaller. A number of simplifications have been employed, such as the linearity in analyte concentration dependence to describe analyte clearance processes. These have been described in the earlier presentations (Bungay et al. 1990; Morrison et al. 1991). Few additional assumptions are invoked in adding the traumatized tissue layer. The types of trauma to be modeled are alterations in the rates of analyte supply and removal processes in this layer. Although it is possible to model these alterations with a continuous and diffuse spatial variation, for simplicity the trauma layer is assumed to be thin with uniform properties that are distinct from those of the surrounding tissue.
The model is formulated in cylindrical coordinates with r representing radial distance from the probe axis and z representing axial distance from the inlet end of the membrane. As indicated in Fig. 5, the inner and outer surfaces of the membrane are located at radial positions, ri and ro, respectively, and the thickness of the trauma layer is δ. The length of membrane accessible for diffusional exchange between perfusate and tissue is lm. The diffusional permeability of the perfusate and membrane will be combined into a probe permeability, Pp, defined as the proportionality coefficient between the flux of analyte into the probe and the concentration difference driving the diffusion,
| (A1) |
The diffusive flux, Jp, is the mass flow rate of analyte into the probe per unit area of membrane outer surface. The driving force is given by the difference between the extracellular analyte concentration at the probe outer surface, , and the dialysate concentration, Cd. The flux and the concentrations vary with the axial location, z, but probe permeability is assumed to be uniform. The flux into the probe increases the dialysate concentration along a differential length, dz, according to the balance,
| (A2) |
in which Qd is the perfusate flow rate. Diffusion in the axial direction is neglected.
The flux, Jp, is determined by a combination of the probe and tissue permeabilities. Solving mass balances for the two tissue layers will yield expressions for the tissue permeabilities. For simplicity, the spatially averaged rate of analyte supply from sources other than the probe will be assumed uniform, but different, in each layer and independent of the local analyte concentration. The non-diffusional local rate of analyte removal per unit volume of extracellular space (ECS) will be described by the product, ke·Ce, in which ke is the rate constant for clearance by all processes other than diffusion, and Ce is the local analyte concentration in the ECS. Thus, Ce is assumed to be sufficiently below the Michaelis–Menten Km value for any saturable clearance mechanisms, such as cellular uptake or microvascular efflux transporters. The value of the clearance rate constant is assumed to be uniform, but different, within the two layers. As yet the model neglects mechanisms for regulating analyte supply and removal rates. Since the trauma layer is assumed to be thin, the curvature of the layer will be neglected. With these simplifications, the steady-state ECS mass balances for the analyte in the ECS are of the form,
| (A3) |
| (A4) |
with De denoting the analyte diffusion coefficient in the ECS and S denoting the supply rate per unit volume of ECS. The balances are to be solved subject to a number of constraints. Far from the probe the diffusional term in equation A4 vanishes as the concentration approaches a uniform level of determined by the balance of supply and removal rates,
| (A5) |
Analogously in the trauma layer, the supply and removal processes are associated with a potential steady-state concentration , defined by
| (A6) |
At the interface between the two tissue layers, in both layers and the analyte flux across the interface is
| (A7) |
in which δ− and δ+ indicate evaluations in the trauma and surrounding tissue layers, respectively, at the interface, r = ro + δ. At the membrane–tissue interface the flux leaving the tissue is the same as that entering the probe,
| (A8) |
In the perfusate at the inlet and outlet ends of the membrane, the analyte concentration is indicated by
| (A9) |
Microdialysis induces spatial variations in extracellular concentration. The length scales over which the concentration varies are characterized by ‘penetration depths’,
| (A10) |
The ease of permeation of each layer is given by a permeability,
| (A11) |
and
| (A12) |
The modified Bessel functions of the second kind, K0 and K1, each with dimensionless argument, ro/Γn, appear in equation A12 as a consequence of the cylindrical geometry. The ratio, K1/K0, approaches unity for large values of the argument.
The flux, Jp, can be equivalently expressed as the product of an overall permeability, P̂, and the tissue-to-perfusate concentration difference driving analyte diffusion into the probe. The apparent DA extracellular concentration for the trauma layer and normal tissue composite will be denoted by . The desired expression analogous to equation A1 is
| (A13) |
The overall permeability for diffusion through the probe and composite tissue in series is given by the inverse of the sum of reciprocals of the probe and tissue permeabilities,
| (A14) |
In the above, the tissue permeability, Pt, is a composite of the permeability properties of the two tissue layers,
| (A15) |
Equation A15 was obtained by solving the tissue balances (equation A3 and equation A4) together with their boundary conditions. For conciseness the hyperbolic functions have been abbreviated by
| (A16) |
By analogy to equations A11 and A12, if the interstitial volume fractions and diffusion coefficients are the same in the two tissue layers , then Pt can be expressed in terms of an apparent clearance rate constant, ,
| (A17) |
The apparent extracellular concentration of the analyte is given by
| (A18) |
In equation A18, w is a dimensionless weighting factor,
| (A19) |
Since ch ≥ 1, equation A19 requires that 0 < w ≤ 1. Then, it follows from equation A18 that must be intermediate between and . The factor, w, serves to weight the contributions of the two tissue layers to the apparent extracellular concentration.
Substituting equation A13 into the perfusate balance A2 and integrating from z = 0 to z = lm yields equation 1 of the Methods section,
| (A20) |
in which Evivo is the extraction fraction in vivo that depends exponentially on P̂, Qd and the membrane outer surface area, Ao, according to
| (A21) |
In the context of no-net-flux experiments with a linearly behaving analyte, the concentration difference measurements are plotted as a function of . Equation A20 indicates that the resulting line has a slope of Evivo and a point of no-net-flux intercept of .
The above expressions hold for any value of . For the pure sampling mode, equation A20 simplifies to
| (A22) |
The true relative recovery for sampling, R, is defined as
| (A23) |
Combining equations A22 and A23 leads to a relationship of the form proposed by Yang et al. (1998) in connection with dopamine microdialysis,
| (A24) |
Substituting equation A18 into the above yields the explicit expression
| (A25) |
Since 0 < w ≤1, R can be greater or less than Evivo and can be greater or less than depending upon whether is greater or less than unity. Expressions A18–A25 are the principal results of the model. The model is valid for any analyte satisfying the modeling assumptions. In particular, application of the model is neither restricted to dopamine or other neurotransmitters, nor to situations in which analyte supply is lacking in the trauma layer.
The axial variation in perfusate concentration is obtained by integrating the perfusate balance (A2) combined with equation A13 from z = 0 to z,
| (A26) |
An appropriate mean perfusate concentration value is the axial-average,
| (A27) |
The concentrations in the tissue vary in both the r and z directions. A representative r-direction profile is, likewise, obtained by axial-averaging. This mean concentration profile in the trauma layer, ro ≤ r ≤ ro + δ, is
| (A28) |
and in the surrounding tissue, r ≥ ro + δ, is
| (A29) |
Equating the axial-averaged expressions for the flux into the probe, equations A1 and A13, gives a relationship for calculating the probe interface concentration,
| (A30) |
and the axial-average extracellular concentration at the interface between the two tissue layers is
| (A31) |
References
- Allen C, Peters JL, Sesack SR, Michael AC. Micro-electrodes closely approach intact nerve terminals in vivo, while larger devices do not: a study using electrochemistry and electron microscopy. In: O’Connor WJ, Lowry JP, O’Connor JJ, O’Neill RD, editors. 9th International Conference on In Vivo Methods; University College Dublin, Dublin, Ireland. 2001. pp. 89–90. [Google Scholar]
- Allen DD, Crooks PA, Yokel RA. 4-Trimethylammonium antipyrine: a quaternary ammonium nonradionuclide marker for blood–brain barrier integrity during in vivo microdialysis. J Pharmacol Toxicol Methods. 1992;28:129–135. doi: 10.1016/1056-8719(92)90074-b. [DOI] [PubMed] [Google Scholar]
- Benveniste H, Diemer NH. Cellular reactions to implantation of a microdialysis tube in the rat hippocampus. Acta Neuropathol (Berl) 1987;74:234–238. doi: 10.1007/BF00688186. [DOI] [PubMed] [Google Scholar]
- Benveniste H, Huttemeier PC. Microdialysis – theory and application. Prog Neurobiol. 1990;35:195–215. doi: 10.1016/0301-0082(90)90027-e. [DOI] [PubMed] [Google Scholar]
- Benveniste H, Drejer J, Schousboe A, Diemer NH. Regional cerebral glucose phosphorylation and blood flow after insertion of a microdialysis fiber through the dorsal hippocampus in the rat. J Neurochem. 1987;49:729–734. doi: 10.1111/j.1471-4159.1987.tb00954.x. [DOI] [PubMed] [Google Scholar]
- Bungay PM, Morrison PF, Dedrick RL. Steady-state theory for quantitative microdialysis of solutes and water in vivo and in vitro. Life Sci. 1990;46:105–119. doi: 10.1016/0024-3205(90)90043-q. [DOI] [PubMed] [Google Scholar]
- Camp DM, Robinson TE. On the use of multiple probe insertions at the same site for repeated intracerebral microdialysis experiments in the nigrostriatal dopamine system of rats. J Neurochem. 1992;58:1706–1715. doi: 10.1111/j.1471-4159.1992.tb10044.x. [DOI] [PubMed] [Google Scholar]
- Chen KC, Höistad M, Kehr J, Fuxe K, Nicholson C. Theory relating in vitro and in vivo microdialysis with one or two probes. J Neurochem. 2002;81:108–121. doi: 10.1046/j.1471-4159.2002.00793.x. [DOI] [PubMed] [Google Scholar]
- Clapp-Lilly KL, Roberts RC, Duffy LK, Irons KP, Hu Y, Drew KL. An ultrastructural analysis of tissue surrounding a microdialysis probe. J Neurosci Methods. 1999;90:129–142. doi: 10.1016/s0165-0270(99)00064-3. [DOI] [PubMed] [Google Scholar]
- Dickinson SD, Sabeti J, Larson GA, Giardina K, Rubinstein M, Kelly MA, Grandy DK, Low MJ, Gerhardt GA, Zahniser NR. Dopamine D2 receptor-deficient mice exhibit decreased dopamine transporter function but no changes in dopamine release in dorsal striatum. J Neurochem. 1999;72:148–156. doi: 10.1046/j.1471-4159.1999.0720148.x. [DOI] [PubMed] [Google Scholar]
- Doucet G, Descarries L, Garcia S. Quantification of the dopamine innervation in adult rat neostriatum. Neuroscience. 1986;19:427–445. doi: 10.1016/0306-4522(86)90272-1. [DOI] [PubMed] [Google Scholar]
- Dykstra KH, Hsiao JK, Morrison PF, Bungay PM, Mefford IN, Scully MM, Dedrick RL. Quantitative examination of tissue concentration profiles associated with microdialysis. J Neurochem. 1992;58:931–940. doi: 10.1111/j.1471-4159.1992.tb09346.x. [DOI] [PubMed] [Google Scholar]
- Fumero B, Guadalupe T, Valladares F, Mora F, O’Neill RD, Mas M, Gonzalez-Mora JL. Fixed versus removable microdialysis probes for in vivo neurochemical analysis: implications for behavioral studies. J Neurochem. 1994;63:1407–1415. doi: 10.1046/j.1471-4159.1994.63041407.x. [see comments] [DOI] [PubMed] [Google Scholar]
- Garris PA, Wightman RM. Regional differences in dopamine release, uptake and diffusion measured by fast-scan cyclic voltammetry. Neuromethods. In: Boulton A, Baker G, Adams RN, editors. Voltammetric Methods in Brain Systems. Vol. 27. Humana Press; Totowa: 1995. pp. 179–220. [Google Scholar]
- Garris PA, Ciolkowski EL, Wightman RM. Heterogeneity of evoked dopamine overflow within the striatal and striatoamygdaloid regions. Neuroscience. 1994a;59:417–427. doi: 10.1016/0306-4522(94)90606-8. [DOI] [PubMed] [Google Scholar]
- Garris PA, Ciolkowski EL, Pastore P, Wightman RM. Efflux of dopamine from the synaptic cleft in the nucleus accumbens of the rat brain. J Neurosci. 1994b;14:6084–6093. doi: 10.1523/JNEUROSCI.14-10-06084.1994. [DOI] [PMC free article] [PubMed] [Google Scholar]
- Georgieva J, Luthman J, Mohringe B, Magnusson O. Tissue and microdialysate changes after repeated and permanent probe implantation in the striatum of freely moving rats. Brain Res Bull. 1993;31:463–470. doi: 10.1016/0361-9230(93)90110-w. [DOI] [PubMed] [Google Scholar]
- Giros B, Jaber M, Jones SR, Wightman RM, Caron MG. Hyperlocomotion and indifference to cocaine and amphetamine in mice lacking the dopamine transporter. Nature. 1996;379:606–612. doi: 10.1038/379606a0. [DOI] [PubMed] [Google Scholar]
- Gonon F, Burie JB, Jaber M, Benoit-Marand M, Dumartin B, Bloch B. Geometry and kinetics of dopaminergic transmission in the rat striatum and in mice lacking the dopamine transporter. In: Agnati LF, Fuxe K, Nicholson C, Syková E, editors. Volume Transmission Revisited. Vol. 125. Elsevier; Amsterdam: 2000. pp. 291–302. [DOI] [PubMed] [Google Scholar]
- Grabb MC, Sciotti VM, Gidday JM, Cohen SA, van Wylen DG. Neurochemical and morphological responses to acutely and chronically implanted brain microdialysis probes. J Neurosci Methods. 1998;82:25–34. doi: 10.1016/s0165-0270(98)00025-9. [DOI] [PubMed] [Google Scholar]
- Groothuis DR, Ward S, Schlageter KE, Itskovich AC, Schwerin SC, Allen CV, Dills C, Levy RM. Changes in blood–brain barrier permeability associated with insertion of brain cannulas and microdialysis probes. Brain Res. 1998;803:218–230. doi: 10.1016/s0006-8993(98)00572-1. [DOI] [PubMed] [Google Scholar]
- Horn AS. Dopamine uptake: a review of progress in the last decade. Prog Neurobiol. 1990;34:387–400. doi: 10.1016/0301-0082(90)90033-d. [DOI] [PubMed] [Google Scholar]
- Justice JB., Jr Quantitative microdialysis of neurotransmitters. J Neurosci Methods. 1993;48:263–276. doi: 10.1016/0165-0270(93)90097-b. [DOI] [PubMed] [Google Scholar]
- Kulagina NV, Zigmond MJ, Michael AC. Glutamate regulates the spontaneous and evoked release of dopamine in the rat striatum. Neuroscience. 2001;102:121–128. doi: 10.1016/s0306-4522(00)00480-2. [DOI] [PubMed] [Google Scholar]
- de Lange EC, Danhof M, Zurcher C, de Boer AG, Breimer DD. Repeated microdialysis perfusions: periprobe tissue reactions and BBB permeability. Brain Res. 1995;702:261–265. doi: 10.1016/0006-8993(95)01184-x. [DOI] [PubMed] [Google Scholar]
- Le Moal M, Simon H. Mesocorticolimbic dopaminergic network: functional and regulatory roles. Physiol Rev. 1991;71:155–234. doi: 10.1152/physrev.1991.71.1.155. [DOI] [PubMed] [Google Scholar]
- Lindefors N, Amberg G, Ungerstedt U. Intracerebral microdialysis. I. Experimental studies of diffusion kinetics. J Pharmacol Methods. 1989;22:141–156. doi: 10.1016/0160-5402(89)90011-9. [DOI] [PubMed] [Google Scholar]
- Lu Y, Peters JL, Michael AC. Direct comparison of the response of voltammetry and microdialysis to electrically evoked release of striatal dopamine. J Neurochem. 1998;70:584–593. doi: 10.1046/j.1471-4159.1998.70020584.x. [DOI] [PubMed] [Google Scholar]
- Meiergerd SM, Patterson TA, Schenk JO. D2 receptors may modulate the function of the striatal transporter for dopamine: kinetic evidence from studies in vitro and in vivo. J Neurochem. 1993;61:764–767. doi: 10.1111/j.1471-4159.1993.tb02185.x. [DOI] [PubMed] [Google Scholar]
- Morgan ME, Singhal D, Anderson BD. Quantitative assessment of blood–brain barrier damage during microdialysis. J Pharmacol Exp Ther. 1996;277:1167–1176. [PubMed] [Google Scholar]
- Morrison PF, Bungay PM, Hsiao JK, Mefford IN, Dykstra KH, Dedrick RL. Quantitative microdialysis. In: Robinson TE, Justice JB Jr, editors. Microdialysis in the Neurosciences. Vol. 7. Elsevier; New York: 1991. pp. 47–80. [Google Scholar]
- Nicholson C. Interaction between diffusion and Michaelis-Menten uptake of dopamine after iontophoresis in striatum. Biophys J. 1995;68:1699–1715. doi: 10.1016/S0006-3495(95)80348-6. [DOI] [PMC free article] [PubMed] [Google Scholar]
- Nicholson C, Chen KC, Hrabetová S, Tao L. Diffusion of molecules in brain extracellular space: theory and experiment. In: Agnati LF, Fuxe K, Nicholson C, Syková E, editors. Volume Transmission Revisited. Vol. 125. Elsevier; Amsterdam: 2000. pp. 129–154. [Google Scholar]
- Olson RJ, Justice JB., Jr Quantitative microdialysis under transient conditions. Anal Chem. 1993;65:1017–1022. doi: 10.1021/ac00056a012. [DOI] [PubMed] [Google Scholar]
- Parsons LH, Smith AD, Justice JB., Jr The in vivo microdialysis recovery of dopamine is altered independently of basal level by 6-hydroxydopamine lesions to the nucleus accumbens. J Neurosci Methods. 1991;40:139–147. doi: 10.1016/0165-0270(91)90063-6. [DOI] [PubMed] [Google Scholar]
- Patlak CS, Fenstermacher JD. Measurements of dog blood–brain transfer constants by ventriculocisternal perfusion. Am J Physiol. 1975;229:877–884. doi: 10.1152/ajplegacy.1975.229.4.877. [DOI] [PubMed] [Google Scholar]
- Pellegrino L, Pellegrino A, Cushman A. A Stereotaxic Atlas of the Rat Brain. Plenum Press; New York: 1979. [Google Scholar]
- Peters JL, Michael AC. Modeling voltammetry and microdialysis of striatal extracellular dopamine: the impact of dopamine uptake on extraction and recovery ratios. J Neurochem. 1998;70:594–603. doi: 10.1046/j.1471-4159.1998.70020594.x. [DOI] [PubMed] [Google Scholar]
- Rice ME. Distinct regional differences in dopamine-mediated volume transmission. In: Agnati LF, Fuxe K, Nicholson C, Syková E, editors. Volume Transmission Revisited. Vol. 125. Elsevier; Amsterdam: 2000. pp. 277–290. [DOI] [PubMed] [Google Scholar]
- Rice ME, Nicholson C. Diffusion characteristics and extracellular volume fraction during normoxia and hypoxia in slices of rat neostriatum. J Neurophysiol. 1991;65:264–272. doi: 10.1152/jn.1991.65.2.264. [DOI] [PubMed] [Google Scholar]
- Robinson TE, Camp DM. The effects of four days of continuous striatal microdialysis on indices of dopamine and serotonin neurotransmission in rats. J Neurosci Methods. 1991;40:211–222. doi: 10.1016/0165-0270(91)90070-g. [DOI] [PubMed] [Google Scholar]
- Robinson TE, Justice JB Jr, editors. Microdialysis in the Neurosciences. Vol. 7. Elsevier; Amsterdam: 1991. [Google Scholar]
- Ruggeri M, Zoli M, Grimaldi R, Ungerstedt U, Eliasson A, Agnati LF, Fuxe K. Aspects of neural plasticity in the central nervous system-III. Methodological studies on the microdialysis technique. Neurochem Int. 1990;16:427–435. doi: 10.1016/0197-0186(90)90004-d. [DOI] [PubMed] [Google Scholar]
- Sam PM, Justice JB., Jr Effect of general microdialysis-induced depletion on extracellular dopamine. Anal Chem. 1996;68:724–728. doi: 10.1021/ac950754+. [DOI] [PubMed] [Google Scholar]
- Schmitz Y, Schmauss C, Sulzer D. Altered dopamine release and uptake kinetics in mice lacking D2 receptors. J Neurosci. 2002;22:8002–8009. doi: 10.1523/JNEUROSCI.22-18-08002.2002. [DOI] [PMC free article] [PubMed] [Google Scholar]
- Schultz W. Predictive reward signal of dopamine neurons. J Neurophysiol. 1998;80:1–27. doi: 10.1152/jn.1998.80.1.1. [DOI] [PubMed] [Google Scholar]
- Shuaib A, Xu K, Crain B, Siren AL, Feuerstein G, Hallenbeck J, Davis JN. Assessment of damage from implantation of microdialysis probes in the rat hippocampus with silver degeneration staining. Neurosci Lett. 1990;112:149–154. doi: 10.1016/0304-3940(90)90194-e. [DOI] [PubMed] [Google Scholar]
- Smith AD, Justice JB., Jr The effect of inhibition of synthesis, release, metabolism and uptake on the microdialysis extraction fraction of dopamine. J Neurosci Methods. 1994;54:75–82. doi: 10.1016/0165-0270(94)90161-9. [DOI] [PubMed] [Google Scholar]
- Tang AM, Gonzales RA. Extraction fraction for dopamine in vivo and in vitro: implications for detecting changes in dopamine uptake. In: O’Connor WJ, Lowry JP, O’Connor JJ, O’Neill RD, editors. 9th International Conference on in Vivo Methods; University College Dublin, Dublin, Ireland. 2001. pp. 109–110. [Google Scholar]
- Tang A, Bungay PM, Gonzales RA. Characterization of probe and tissue factors that influence interpretation of quantitative microdialysis experiments for dopamine. J Neurosci Methods. 2003;126:1–11. doi: 10.1016/s0165-0270(03)00003-7. [DOI] [PubMed] [Google Scholar]
- Wang Y, Wong SL, Sawchuk RJ. Microdialysis calibration using retrodialysis and zero-net flux: application to a study of the distribution of zidovudine to rabbit cerebrospinal fluid and thalamus. Pharm Res. 1993;10:1411–1419. doi: 10.1023/a:1018906821725. [DOI] [PubMed] [Google Scholar]
- Westergren I, Nystrom B, Hamberger A, Johansson BB. Intracerebral dialysis and the blood–brain barrier. J Neurochem. 1995;64:229–234. doi: 10.1046/j.1471-4159.1995.64010229.x. [DOI] [PubMed] [Google Scholar]
- Westerink BH, De Vries JB. Characterization of in vivo dopamine release as determined by brain microdialysis after acute and subchronic implantations: methodological aspects. J Neurochem. 1988;51:683–687. doi: 10.1111/j.1471-4159.1988.tb01798.x. [DOI] [PubMed] [Google Scholar]
- Yang H, Peters JL, Michael AC. Coupled effects of mass transfer and uptake kinetics on in vivo microdialysis of dopamine. J Neurochem. 1998;71:684–692. doi: 10.1046/j.1471-4159.1998.71020684.x. [DOI] [PubMed] [Google Scholar]
- Yang H, Peters JL, Allen C, Chern SS, Coalson RD, Michael AC. A theoretical description of microdialysis with mass transport coupled to chemical events. Anal Chem. 2000;72:2042–2049. doi: 10.1021/ac991186r. [DOI] [PubMed] [Google Scholar]