

Abstract
This study describes investigation of porous photocrosslinked oligo[(polyethylene glycol) fumarate] (OPF) hydrogels as potential matrix for osteoblastic differentiation of marrow stromal cells (MSCs). The porosity and interconnectivity of porous hydrogels were assessed using magnetic resonance microscopy (MRM) as a noninvasive investigative tool that could image the water construct inside the hydrogels at a high spatial resolution. MSCs were cultured onto the porous hydrogels and cell number was assessed using PicoGreen DNA assay. Our results showed 10% of cells initially attached to the surface of scaffolds. However, cells did not show significant proliferation over a time period of 14 days. MSCs cultured on porous hydrogels had increased alkaline phosphatase activity as well as deposition of calcium, suggesting successful differentiation and maturation to the osteoblastic phenotype. Moreover, continued expression of type I collagen and osteonectin over 14 days confirmed osteoblastic differentiation of MSCs. MRM was also applied to monitor osteogenesis of MSCs on porous hydrogels. MRM images showed porous scaffolds became consolidated with osteogenic progression of cell differentiation. These findings indicate that porous OPF scaffolds enhanced MSC differentiation leading to development of bone-like mineralized tissue.
Keywords: Hydrogel, oligo[(polyethylene glycol) fumarate] (OPF), Marrow stromal cells, Magnetic resonance microscopy, Osteogenesis
1. Introduction
Every year millions of patients confront bone tissue loss due to surgery, disease or trauma. Bone tissue engineering aims to correct treat musculoskeletal disorders through the development of cell-based substitutes for osteogenic tissue replacement. Tissue engineering combines progenitor cells, biocompatible scaffolds, biological differentiation reagents and growth factors to create a supportive environment for cell growth and differentiation. In this process, marrow stromal cells (MSCs) are seeded into the scaffolds to establish a three-dimensional engineered construct that under appropriate conditions will grow to form osteocytic, chondrocytic, or adipocytic tissue [1-4]. Scaffolds for osteogenesis should mimic bone morphology, structure, and function in order to optimize integration into surrounding tissue [5].
The properties of scaffolds depend primarily on the nature of the biomaterial and the process by which they were fabricated. The nature of biomaterials has been the subject of extensive studies including different materials such as metals, ceramics, glass, synthetic and natural polymers and combinations of these materials to form composites. Bone by itself is a structured material composed of hydroxyapatite crystals deposited within an organic matrix containing 95% type I collagen. Bone morphology is composed of trabecular bone which creates a porous environment with 50−90% porosity with cortical bone surrounding it. Therefore, porosity and pore size of biomaterial scaffolds play a critical role in bone formation in vitro and in vivo [5]. Pores allow migration and proliferation of osteoblasts and MSCs along with vascularization. In addition, a porous surface improves mechanical interlocking between the implant and surrounding tissue. This natural interlocking provides greater mechanical stability at this critical interface. Based on early studies the minimum requirement for pore size is considered to be ∼100μm due to cell size, migration requirements and transport. However, pore sizes greater than 300 μm are recommended due to enhanced new bone formation and the formation of capillaries in vivo [5].
In this work, microporous scaffolds with different porosity were fabricated by use of photocrosslinked oligo[(polyethylene glycol) fumarate] (OPF) hydrogel. The porosity and interconnectivity of microporous OPF hydrogels were assessed using scanning electron microscopy (SEM) and magnetic resonance microscopy (MRM). MRM was used in this study as a non-invasive investigative tool that could image the water construct inside the hydrogels and show the pore architecture of scaffolds at high spatial resolution. We also investigated the effect that morphological features of the OPF hydrogels had on marrow stromal cell adhesion and expression of phenotypic function.
2. Materials and methods
2.1 OPF synthesis
OPF was synthesized using polyethylene glycol (PEG) with the initial molecular weight of 10000 according to the method previously described [6]. Briefly, 50 g PEG was azeotropically distilled in toluene to remove residual water and then dissolved in 500 mL distilled methylene chloride. The resulting PEG was placed in an ice bath and purged with nitrogen for 10 minutes, then 0.9 mol triethylamine (TEA; Aldrich, Milwaukee, WI) per mol PEG and 1.8 mol distilled fumaryl chloride (Acros, Pittsburgh, PA) per mol PEG were added dropwise. The reaction vessel was then removed from the ice bath and stirred at room temperature for 48 hours. For purification, methylene chloride was removed by a rotary evaporator. The resulting OPF was dissolved in ethyl acetate and filtered to remove the salt from the reaction of TEA and chloride. OPF was recrystallized in ethyl acetate and vacuum dried overnight.
2.2 Hydrogel preparation and characterization
2.2.1 Preparation
Hydrogels were made by dissolving OPF macromer with a final concentration of 33% (w/w) in deionized water containing 0.05% (w/w) Irgacure 2959 (Ciba-Specialty Chemicals, Tarrytown, NY) and N-vinyl pyrrolidinone with concentration of 0.33%. In order to obtain hydrogels with different porosity, 1 mL of macromer solution was mixed with desired amounts of sodium chloride and polymerized using 365 nm UV light at the intensity of ∼8 mW/cm2 (Black-Ray Model 100AP, Upland, CA) for 10 min. The size distribution of salt particles obtained by sieving was in the range of 100 to 500 μm.
2.2.2 Compression testing
After cross-linking, hydrogels were cut into disks of 7 mm diameter and 2mm thickness with a cork borer and placed in deionized water to leach out the salt for 3 days with change of water every 12 h. Compressive modulus of the hydrogels was determined using a dynamic mechanical analyzer (DMA-2980, TA Instruments, New Castle, DE) at a rate of 4 N/min. The modulus was determined as the slope of the stress versus strain curve at low strains.
2.2.3 Scanning electron microscopy (SEM)
Porous hydrogels were dried in a critical point dryer and fractured after frozen in liquid nitrogen, followed by coating with gold using sputter coater (Bio-Rad/ polaron, Cambridge, Massachusetts). Cross section of the samples was examined using a SEM (S-4700, Hitachi Instruments Inc., Tokyo, Japan).
2.2.4 Magnetic resonance microscopy (MRM)
A Bruker Bio-Spin AVANCE 7 Tesla vertical magnet with 89 mm internal bore diameter equipped with a MICRO 2.5 imaging probe was used in these studies. The thin hydrogel scaffolds were suspended in 1% v/v Magnevist (Berlex Laboratories, Seattle, WA) solution in water so that the water relaxation times were shortened and therefore quick repetitive scans for high-resolution 3-dimensional images could be made more efficiently. The scaffolds in solution were held in place between a pair of heavy rubber stoppers in 15 mm outer diameter glass tube. Air bubbles from around the gel specimens were carefully removed by repeated degassing. Gradient echo FLASH-3D imaging with repetition time (TR) 200 ms, echo time (TE) 9 ms and flip angle (FA) 90° over data size 512 × 512 × 256, field of view 15 mm ×15 mm ×15 mm, with total acquisition time of about 11 hours that yields an in-slice resolution 29 μm/pixel, for the 59 μm thick slices. Using the image analysis software ANALYZE (Mayo Foundation, Rochester, MN), the pore structure in the imaged scaffolds were evaluated. To compare the cell growth in hydrogel scaffolds in osteogenic media with that of the blank hydrogel scaffolds from the same MRM image, semicircular pieces of each were placed side by side in the glass tube as mentioned above.
2.3 MSC isolation, culture and characterization
MSCs were isolated from the femurs of male Sprague-Dawley rats according to the method previously described [7]. Prior to cell seeding, samples were disinfected with 70% ethanol for 30 min. Ethanol was aspirated and samples were soaked in sterile phosphate buffered saline (PBS) for 1 h with three changes followed by two changes of media and incubation over night. Fifty μL of the cell suspension containing (100,000 cells) was seeded onto the top of hydrogel foams in the 24 well plates and incubated for 3 h to allow cells to attach. One mL osteogenic media supplemented with 10 nM dexamethasone (Sigma), 2 mM ß-glycerophosphate (Sigma, St. Louis, MO) and 50 μg/mL L-ascorbic acid phosphate magnesium salt (Wako, Richmond, VA) was added to each well. Medium was changed every 2−3 days. Tissue culture polystyrene (TCPS) plates were used as control, and seeded with MSCs at a density of 20,000 cells/cm2.
2.3.1 Cell viability
Viability of the seeded cells at days 1, 7 and 14 was examined using Live/Dead Kit (Molecular Probes, Eugene, Oregan) per kit instruction. This technique stains living cells green and dead cells red. After staining, the cells were visualized using confocal scanning microscopy.
2.3.2 PicoGreen DNA assay
Three samples of each group at above time points were washed with PBS, placed in 5-mL snap cap tubes with 1 mL deionized water and frozen at −80°C. Samples underwent two freeze/thaw cycles with sonication on the ice for 30 min after each cycle prior to analysis. Cell number was determined by the PicoGreen DNA kit (Molecular probes) according to the manufacturer's guideline. A standard curve based on known concentration of DNA was used to determine the total cell number.
2.3.3 Alkaline phosphatase activity
Alkaline phosphatase activity (ALP) activity of seeded cells at desired time points was measured according to the manufacture's instruction (Sigma). ALP activity was normalized to the number of cells.
2.3.4 Calcium content of scaffolds
Calcium content of scaffolds was measured after incubation of samples in 1 N acetic acid over night to dissolve the deposited calcium using Sigma Diagnostic Kit #587 according to the manufacturer's instruction. The total calcium present in each scaffold was normalized to the number of cells.
2.3.5 Reverse transcriptase polymerase chain reaction
Fifty ng of total RNA was reverse transcribed using the iScript cDNA Synthesis Kit (Bio-Rad Laboratories, Hercules, California). PCR amplification was carried out in 25 μL reaction mixtures containing 5 μL of cDNA, 2.5 μL 10× PCR buffer without magnesium (Promega, Madison, Wisconsin), 1.5 μL of 25 mM magnesium chloride (Promega, Madison, Wisconsin), 0.25 μL AmpliTaq Gold® DNA Polymerase (Applied Biosystems, Foster City, California), 2.5 pmol of each primer listed in Table 1 (Mayo Medical laboratories, Rochester, Minnesota), 0.5 μL of 10 mM dTTPs (Invitrogen, Eugene, OR). PCR reaction mixtures were heated to 95°C for 5 minutes, and then cycled 40 times at 90°C for 1 minute, 60°C for 1 minute, and 72°C for 1 minute.
Table 1.
Primer sequences used for PCR amplification.
| Gene | Primer sequence |
|---|---|
| Collagen I | F: 5′-ACTTCCCTACCCAGCACCTT-3′ |
| R: 5′-CACCCCTTCACAGAGATGT-3′ | |
| CBFA | F: 5′-GGACGAGGCAAGAGTTTCAC-3′ |
| R:5′-TGCCTGCCTGGGATCTGTAA-3′ | |
| Osteonectin | F: 5′-CTCTTCCTGCCACTTCTTTG-3′ |
| R: 5′-GCCCTCATCTCTCTCGTACA-3′ | |
| GAPDH | F:5′-TCCCTCAAGATTGTCAGCAA-3′ |
| R: 5′-AGATCCACAACGGATACATT-3′ |
2.3.6 Attenuated total reflectance Fourier transform infrared microscopy
The composition of the cell- scaffold after 14 days in osteogenic media was assessed using attenuated total reflectance Fourier transform infrared microscopy (micro-ATR-FTIR). The samples were fixed in 2% Para-formaldehyde, washed in PBS and dried in vacuum. All spectra were recorded using at least 128 scans and 2cm−1 resolution with ATR-FTIR spectroscopy (Nicolet 8700, Thermo Electron Corp., Madison, Wisconsin), coupled to a continuum microscope. In order to exclude any possible contributions of mineralization from the culture media, the spectrum taken from samples in osteogenic media without cells was subtracted from the spectrum of the samples seeded with cells.
2.4 Statistical Analysis
All data are reported as mean ± standard deviation (SD) for n=3 except for compressive modulus measurements where n=5. Single factor analysis of variance (ANOVA) was performed with StatView version 5.0.1.0 (SAS Institute, Inc, Cary, North Carolina) to assess the statistical significance of the results. Bonfferoni's method was employed for multiple comparison tests at significance levels of at least 95%.
3. Results
3.1 Hydrogel morphology
Hydrogel scaffolds of different porosity were fabricated using a salt leaching method with sodium chloride particles in the size range of 100 to 500 μm as porogen (Table 2). Figure 1 a-c shows SEM micrographs of porous hydrogels with different porosity after lyophilization in comparison with nonporous hydrogel. Hydrogel scaffolds appeared to be highly porous with open and interconnected pores that are surrounded by polymer walls. As seen in this figure, pores sizes varied by the change in porogen particle size. MRM cross-sections of porous hydrogels in their swollen state are compared in Figure 1 d-f. The contrast between bound water inside the hydrogel walls and free or unbound water inside the pores shows morphology of the porous hydrogel in a hydrated stage. MRM allows the 3D visualization of the scaffolds in a noninvasive manner. Moreover, the 3D images taken from the scaffolds could be further used for quantification of the porosity using image analysis. Our results from analysis of the MRM images revealed that the porosity computed from these images correlated well with the experimental porogen concentration. The scaffolds with 75%, 80% and 85% porogen content and particle size of 300 μm had porosity of 78.57%, 82.64%, and 87.55%, respectively. The corresponding surface area was 826.27, 887.18, and 995.48 mm2.
Table 2.
Four types of porous OPF hydrogels used in this study.
| Samples | Particle Porogen size (μm) | Porogen Amount (wt %) |
|---|---|---|
| Group 1 | 100 | 75 |
| Group 2 | 300 | 75 |
| Group 3 | 400 | 75 |
| Group 4 | 100 | 80 |
Figure 1.

Representative SEM (top panels) and MRM (bottom panels) images of porous OPF scaffolds. Scaffold with no porosity (a, d), porous scaffold with 75% porogen content and 300 μm particle size (b, e), porous scaffold with 75% porogen content and 500 μm particle size (c, f).
3.2 Mechanical properties
Compressive moduli of porous hydrogels after hydration in PBS are compared in Figure 2. Compressive modulus of the hydrogel did not change significantly with addition of 50% porogen; however, it decreased from 47.7±4.1 to 16.2±2.6 kPa with increase in porogen concentration from 50% to 75% (Figure 2a). There was another fall in modulus of the hydrogel from 18.1±1.7 to 11.1±1.9 kPa with increasing porogen content from 80% to 85%. Figure 2b shows that change in particle size did not affect the modulus of porous hydrogels with 75% porogen content.
Figure 2.

Compressive modulus of various porous hydrogels at equilibrium swelling as a function of porogen content (a), and as a function of porogen particle size (porogen content is 75% for these scaffolds) (b). Data represent mean±SD (n=5). * p<0.01 compared to nonporous hydrogel. # p<0.01 compared to scaffolds with 80% porogen content.
3.3 Cell viability and distribution
MSCs were seeded on hydrogel formulations listed in Table 2, and left undisturbed for 3 h in the incubator to allow the cells to attach. After 1, 7 and 14 days in osteogenic media, samples were rinsed with PBS to remove nonadherent cells, and stained for viability (Figure 3a-c). Cells appeared to remain viable over the length of culture for 14 days. At day 1, MSCs were distributed over the hydrogel surfaces and inside the pores. At day 7 and 14, most of the cells were located on the edge and inside the pores and appeared to be aggregated.
Figure 3.

Viability and morphology of MSCs on porous hydrogel after 1 day (a), 7 days (b), and 14 days (c) in culture. Live cells are stained green and dead cells are stained red. All magnifications are ×10. Scale bar=20 μm.
3.4 Cell proliferation
The total number of cells cultured on porous hydrogels was quantified using a DNA assay over the time course of study (Figure 4). After initial cell seeding, almost 10% of cells were attached to the hydrogels of different formulations. Cells did not show significant proliferation over a time period of 14 days, and similar cell numbers were observed on the scaffolds at different time points. There was an increase from 23,464±7,361 cells after initial seeding to 120,322±38,546 cells after 14 days of culture on TCPS surfaces.
Figure 4.

Proliferation of MSCs on OPF hydrogel scaffolds with different porosity in comparison to tissue culture polystyrene (TCPS) controls as a function of culture time. Data represent mean±SD (n=3). *p<0.05 compared to TCPS at day 1; (#) p<0.05 compared to TCPS at day 7; (+) p<0.05 compared to TCPS at day 14.
3.5 ALP activity
ALP activity of the MSCs seeded on the porous hydrogels (with 75% salt content and particle size of 100 μm) at days 1, 7 and 14 in comparison to TCPS plates as a conventional two-dimensional surface is shown in Figure 5. ALP activity of the cells seeded on porous hydrogels increased considerably at days 7 and 14. Our results showed that the ALP activity of the cell-hydrogel composite at days 7 and 14 to be significantly higher than that of cells on TCPS (p<0.05). However, these data did not show significant difference between ALP activity of the cells seeded on the hydrogels with different porogen size ranging from100 to 500 μm.
Figure 5.

ALP activity of MSCs on OPF hydrogel scaffolds with different porosity in comparison to tissue culture polystyrene (TCPS) controls as a function of culture time. Data represent mean±SD (n=3). *p<0.05 compared to TCPS at day 1; #p<0.05 compared to TCPS at day 7; +p<0.05 compared to TCPS at day 14.
3.6 Mineralization
To investigate the maturation of the differentiated MSCs to the osteoblasts, total calcium content was measured on each scaffold (Figure 6a) and further normalized to the number of cells (Figure 6b). Significant calcium deposition was found after 14 days of culture in osteogenic media on all samples in comparison to TCPS (p<0.05). Calcium content of the cells on samples with different porosity used in our experiments was not significantly different. However, deposition of calcium on TCPS controls was significantly lower than that on porous hydrogels at day 14 (p<0.05).
Figure 6.

Amount of calcium deposited on OPF hydrogel scaffolds with different porosity in comparison to tissue culture polystyrene (TCPS) controls as a function of culture time. Data represent the total calcium content on each scaffold (a), and the total calcium content at each time point normalized to the cell number for each experimental group (b). Data represent mean±SD (n=3). *p<0.05 compared to TCPS at day 1; #p<0.05 compared to TCPS at day 7; +p<0.05 compared to TCPS at day 14.
Furthermore, we used micro-ATR-FTIR spectroscopy to investigate matrix formation and mineralization as late markers for osteoblast maturation. Micro- ATR-FTIR spectra of the hydrogels seeded with cells and without cells after 14 days in osteogenic media are compared in Figure 7 (a, b). Spectral subtraction of the samples in osteogenic media without cells from the samples seeded with cells showed peaks at about 1640 cm−1 (amide I) and 1545 cm−1 (amide II), which can be assigned to the protein matrix formed. In addition, peak at 1081 cm−1 is assigned to phosphate group in carbonated apatite, suggesting mineralization of the matrix (Figure 7 c). Micrograph taken from the mineralized area demonstrated matrix deposition around the edge and surface of hydrogel (Figure 7d).
Figure 7.

Micro-ATR-FTIR spectra of hydrogel seeded with MSCs after 14 days in osteogenic media (a), hydrogel without cells after 14 days in osteogenic media (b), subtracted spectrum (c), and image of scaffold area where spectra was collected (d).
3.7 RT-PCR
RT-PCR was carried out for four well characterized markers for osteogenic differentiation: Type I collagen, CBFA, osteonectin as well as the housekeeping gene GAPDH. Expression of genes for bone specific proteins in porous hydrogels with 75% porosity after 7 and 14 days is shown in Figure 8. This figure demonstrates an increase in mRNA expression of the four osteogenic genes studied in a time dependent manner. Furthermore, our PCR data confirmed the continued expression of two late markers of osteogenesis, type I collagen and osteonectin, at 14 days.
Figure 8.
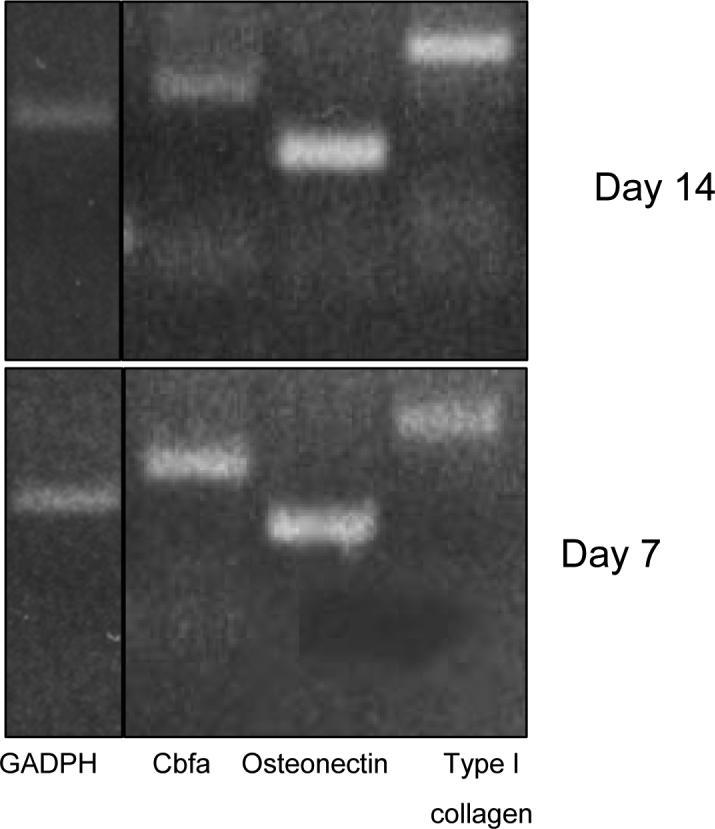
The 7 and 14 day gels represent reverse transcriptase products on porous hydrogels (75% porogen content and 300 μm particle size).
3.8 MRM assessment of osteogenesis
Figure 9 compares the MRM images from blank hydrogel with hydrogel seeded with marrow stromal cell after 14 days in osteogenic media. Mineralization appeared to occur on the edge and inside the hydrogel pores, where most of the cells were located.
Figure 9.

Magnetic resonance microscopy thick cross-sectional slice of hydrogel seeded with marrow stromal cell after14 days in osteogenic media (left portion) and the blank hydrogel (right portion). The internal diameter of the tube carrying the specimens above is 12.5 mm.
4. Discussion
The goal of the present study was to investigate the in vitro osteogenic potential of marrow stromal cells in a porous, bioresorbable, synthetic hydrogel. To achieve this goal, porous scaffolds with pore sizes ranging from 100−500 μm were prepared using the photocrosslinkable OPF macromer. Three-dimensional structure of the porous scaffolds was visualized using SEM. SEM of cross sections of scaffolds has been often used to obtain estimates of porosity with extrapolation of 2D images to 3D. However, SEM images are limited to 2D measurements of relatively small fields of view, and it may become difficult to distinguish pores from interconnections [8]. Mercury intrusion porosimetry (MIP) is also used for quantification of scaffolds porosity. In this technique, porosity is determined by forcing mercury into the pores under pressure. Measurement of porosity is based on the principle that the pressure required to force the nonwetting liquid such as mercury into pores, against the resistance imparted by liquid surface tension, is indicative of pore size and pore volume. Although MIP is a rather accurate technique for measuring the scaffolds porosity, it cannot be applied for measurement of porosity in the hydrogels. The use of high pressure in this technique may lead to the rupture of scaffold during the analysis. In this study, we demonstrated that MRM is useful in micro structural analysis of water rich materials such as OPF hydrogel. By optimizing the acquisition parameters such as TR, TE, FA, and using solvent relaxation-enhancing media the pores were clearly observed at an in plane resolution of 29 μm/pixel in various scaffold materials. MRM showed similar morphology as SEM for porous hydrogels in their hydrated state; however the walls between the pores looked thicker compared to SEM images due to the swelling of hydrogels. The porosity of hydrogel scaffolds was quantified with analysis of MRM images.
Compressive mechanical testing showed modulus of the OPF scaffolds did not change significantly with addition of 50% porogen; however, it significantly decreased with further increase in porogen content (Figure 2a). We demonstrated that scaffolds with 85% porogen content had a low modulus and did not maintain its integrity during the mechanical testing. Therefore, we chose to use the scaffolds with 75% and 80% porogen content with pore sizes ranging from 100−500 μm for our cell culture studies. These scaffolds had higher degree of porosity and interconnectivity while they maintained their integrity during the study. Lin and coworkers also reported that higher porosity (80% vs. 58%) decreased compressive modulus of porous poly(l-lactide-co-dl-lactide) from 168.3 to 43.5 MPa [9]. Burdick and coworkers reported that increasing the pore size from 45−150 to 300−600 μm increased the elastic modulus of a photo-polymerized multifunctional lactic acid-based oligomer (3.1−7.8 MPa) [10]. The porosity of these scaffolds was ∼80%, since lower porosity resulted in less interconnected pores and higher porosity to scaffolds with low mechanical properties [11]. Eighty percent porosity was also found to be optimal for both interconnectivity and mechanical properties of porous scaffolds made by photo-crosslinking of poly(propylene fumarate) [12]. Increased porosity and pore size appear to facilitate bone ingrowth; however, this compromises the structural integrity of the scaffold, resulting in reduction in mechanical properties. In fact, the compromise in mechanical properties of scaffold with increasing porosity sets an upper limit in terms of how much porosity and pore size can be tolerated. However, some adjustment can be made to improve mechanical properties of porous scaffolds. For instance, it has been reported that incorporation of polyglycolic acid fibers and ß-tricalcium phosphate result in reinforcement of tissue engineered scaffolds [13, 14]. Porter et al. demonstrated that increasing the amount of ß-tricalcium phosphate (50% as apposed to 25%) in poly(propylene fumarate) substantially improved mechanical properties of the porous scaffolds [14].
To evaluate the effect of hydrogel structure and architecture on MSC attachment and differentiation, cells were seeded on the porous hydrogels with different porosity. The localization and viability of the cells was visualized using confocal microscopy. Cells appeared to attach to the surface of hydrogels and maintained their viability over 14 days in culture. However, they had round morphology and tended to aggregate inside the pores. Depth profiling with confocal microscopy showed that there was a disproportionately larger number of cells at the top surface of hydrogels compared to the interior layers. PicoGreen assay showed 10% of cells initially attached to the surface of scaffolds. However, the total cell number on porous hydrogels did not change significantly over the duration of study. In contrast, cells number on tissue culture polystyrene doubled after 7 days and continued to increase over 14 days in culture. Cells on all hydrogel formulations had increased ALP activity as well as deposition of calcium, both suggesting successful differentiation and maturation of MSCs to the osteoblastic phenotype (Figure 5). Our data from PCR also confirmed osteoblastic differentiation of MSCs on the porous hydrogels (Figure 8). These results suggest that porous hydrogels stimulate osteogenesis by suppressing cell proliferation and enhancing cells aggregation. It appears cell adhesion on scaffolds is necessary but not sufficient for subsequent cell function. Previous study has also shown that modification of poly(propylene fumarate-co-ethylene glycol) hydrogels with cell adhesive RGD peptide allowed initial MSC adhesion, however cell number did not increase over 28 days study [15]. The authors reported that their modified surfaces, however, supported differentiation of the cells to osteoblastic phenotype.
In addition to calcium deposition, ATR-FTIR confirmed matrix formation and further mineralization in late stage of osteoblastic differentiation on our scaffolds (Figure 7). ATR-FTIR has been proven to be very useful in characterization of collagenous matrix formation associated with mineralization [16]. It has been previously shown that formation of the mineralized tissues starts with the patterning of the skeletal elements and proceeds through the differentiating and proliferation of the cells that synthesize the matrices upon which the mineral is deposited [17]. Von Kossa or Alizarin staining or calcium uptake measurements are common methods in assessment of mineralization; however, these analyses could be inconclusive as the matrix is known to uptake calcium independently of mineral deposition [18].
In this study, we demonstrated that osteogenesis could be monitored on porous OPF hydrogel using MRM (Figure 9). MRM images showed that the porous scaffold in ostegenic media became consolidated with osteogenic progression of cell differentiation (Figure 8, right portion). The biochemical changes of osteogenic differentiated cells on porous scaffolds can be reflected in MR imaging. Since MRI contrast is sensitive to the molecular environment through changes in relaxation times T1 and T2, and apparent diffusion coefficient ADC, it can provide images and information that are not available using other techniques [19]. This technique has also been used in vitro and in vivo to study engineered tissues such as cartilage, heart valves, and ectopic bone [20, 21].
5. Conclusions
Our results showed that porous OPF hydrogels provide a superior microenvironment to support marrow stromal cell differentiation into osteoblasts. This study demonstrated that ALP activity of the cells seeded on the porous hydrogels increased over a time course of 14 days, and cells expressed genes for bone specific proteins. Furthermore, we demonstrated that porous hydrogels could stimulate differentiation of the MSCs toward production of a mineralized bone-like extracellular matrix. We also demonstrated MRM to be useful in assessing hydrogel porosity as well as osteogenesis on porous scaffolds. These findings suggest that porous OPF hydrogel may be successfully used for cell delivery applications to bone defects in vivo.
Acknowledgment
This work was supported by Mayo Foundation and NIH grants R01 AR45871 and R01 EB003060.
Footnotes
Publisher's Disclaimer: This is a PDF file of an unedited manuscript that has been accepted for publication. As a service to our customers we are providing this early version of the manuscript. The manuscript will undergo copyediting, typesetting, and review of the resulting proof before it is published in its final citable form. Please note that during the production process errors may be discovered which could affect the content, and all legal disclaimers that apply to the journal pertain.
References
- 1.Dezawa M, Ishikawa H, Itokazu Y, Yoshihara T, Hoshino M, Takeda S, et al. Bone marrow stromal cells generate muscle cells and repair muscle degeneration. Science. 2005;309(5732):314–317. doi: 10.1126/science.1110364. [DOI] [PubMed] [Google Scholar]
- 2.Fujita M, Kinoshita Y, Sato E, Maeda H, Ozono S, Negishi H, et al. Proliferation and differentiation of rat bone marrow stromal cells on poly(glycolic acid)-collagen sponge. Tissue Eng. 2005;11(9−10):1346–1355. doi: 10.1089/ten.2005.11.1346. [DOI] [PubMed] [Google Scholar]
- 3.Peptan IA, Hong L, Mao JJ. Comparison of osteogenic potentials of visceral and subcutaneous adipose-derived cells of rabbits. Plast Reconstr Surg. 2006;117(5):1462–1470. doi: 10.1097/01.prs.0000206319.80719.74. 15. [DOI] [PMC free article] [PubMed] [Google Scholar]
- 4.Shung AK, Behravesh E, Jo S, Mikos AG. Crosslinking characteristics of and cell adhesion to an injectable poly(propylene fumarate-co-ethylene glycol) hydrogel using a water-soluble crosslinking system. Tissue Eng. 2003;9(2):243–254. doi: 10.1089/107632703764664710. [DOI] [PubMed] [Google Scholar]
- 5.Karageorgiou V, Kaplan D. Porosity of 3D biomaterial scaffolds and osteogenesis. Biomaterials. 2005;26(27):5474–5491. doi: 10.1016/j.biomaterials.2005.02.002. [DOI] [PubMed] [Google Scholar]
- 6.Jo S, Shin H, Mikos AG. Modification of oligo(poly(ethylene glycol) fumarate) macromer with a GRGD peptide for the preparation of functionalized polymer networks. Biomacromolecules. 2001;2(1):255–261. doi: 10.1021/bm000107e. [DOI] [PubMed] [Google Scholar]
- 7.Maniatopoulos C, Sodek J, Melcher AH. Bone formation in vitro by stromal cells obtained from bone marrow of young adult rats. Cell Tissue Res. 1988;254(2):317–330. doi: 10.1007/BF00225804. [DOI] [PubMed] [Google Scholar]
- 8.Moore MJ, Jabbari E, Ritman EL, Lu L, Currier BL, Windebank AJ, et al. Quantitative analysis of interconnectivity of porous biodegradable scaffolds with micro-computed tomography. J Biomed Mater Res A. 2004;71(2):258–267. doi: 10.1002/jbm.a.30138. [DOI] [PubMed] [Google Scholar]
- 9.Lin AS, Barrows TH, Cartmell SH, Guldberg RE. Microarchitectural and mechanical characterization of oriented porous polymer scaffolds. Biomaterials. 2003;24(3):481–489. doi: 10.1016/s0142-9612(02)00361-7. [DOI] [PubMed] [Google Scholar]
- 10.Burdick JA, Frankel D, Dernell WS, Anseth KS. An initial investigation of photocurable three-dimensional lactic acid based scaffolds in a critical-sized cranial defect. Biomaterials. 2003;24(9):1613–1620. doi: 10.1016/s0142-9612(02)00538-0. [DOI] [PubMed] [Google Scholar]
- 11.Burdick JA, Padera RF, Huang JV, Anseth KS. An investigation of the cytotoxicity and histocompatibility of in situ forming lactic acid based orthopedic biomaterials. J Biomed Mater Res. 2002;63(5):484–491. doi: 10.1002/jbm.10298. [DOI] [PubMed] [Google Scholar]
- 12.Fisher JP, Holland TA, Dean D, Engel PS, Mikos AG. Synthesis and properties of photocross-linked poly(propylene fumarate) scaffolds. J Biomater Sci Polym Ed. 2001;12(6):673–687. doi: 10.1163/156856201316883476. [DOI] [PubMed] [Google Scholar]
- 13.Hiraoka Y, Kimura Y, Ueda H, Tabata Y. Fabrication and biocompatibility of collagen sponge reinforced with poly(glycolic acid) fiber. Tissue Eng. 2003;9(6):1101–1112. doi: 10.1089/10763270360728017. [DOI] [PubMed] [Google Scholar]
- 14.Porter BD, Oldham JB, He SL, Zobitz ME, Payne RG, An KN, et al. Mechanical properties of a biodegradable bone regeneration scaffold. J Biomech Eng. 2000;122(3):286–288. doi: 10.1115/1.429659. [DOI] [PubMed] [Google Scholar]
- 15.Behravesh E, Mikos AG. Three-dimensional culture of differentiating marrow stromal osteoblasts in biomimetic poly(propylene fumarate-co-ethylene glycol)-based macroporous hydrogels. J Biomed Mater Res A. 2003;66(3):698–706. doi: 10.1002/jbm.a.10003. [DOI] [PubMed] [Google Scholar]
- 16.Boskey A, Mendelsohn R. Infrared analysis of bone in health and disease. J Biomed Opt. 2005;10(3):031102. doi: 10.1117/1.1922927. [DOI] [PubMed] [Google Scholar]
- 17.Mariani FV, Martin GR. Deciphering skeletal patterning: clues from the limb. Nature. 2003;423(6937):319–325. doi: 10.1038/nature01655. [DOI] [PubMed] [Google Scholar]
- 18.Boskey AL. Biomineralization: conflicts, challenges, and opportunities. J Cell Biochem Suppl. 1998;30−31:83–91. [PubMed] [Google Scholar]
- 19.Peptan IA, Hong L, Xu H, Magin RL. MR assessment of osteogenic differentiation in tissue-engineered constructs. Tissue Eng. 2006;12(4):843–851. doi: 10.1089/ten.2006.12.843. [DOI] [PubMed] [Google Scholar]
- 20.Hartman EH, Pikkemaat JA, Van Asten JJ, Vehof JW, Heerschap A, Oyen WJ, et al. Demineralized bone matrix-induced ectopic bone formation in rats: in vivo study with follow-up by magnetic resonance imaging, magnetic resonance angiography, and dual-energy X-ray absorptiometry. Tissue Eng. 2004;10(5−6):747–754. doi: 10.1089/1076327041348374. [DOI] [PubMed] [Google Scholar]
- 21.Potter K, Butler JJ, Horton WE, Spencer RG. Response of engineered cartilage tissue to biochemical agents as studied by proton magnetic resonance microscopy. Arthritis Rheum. 2000;43(7):1580–1590. doi: 10.1002/1529-0131(200007)43:7<1580::AID-ANR23>3.0.CO;2-G. [DOI] [PubMed] [Google Scholar]