

Abstract
Bcl-2 protects cells against mitochondrial oxidative stress and subsequent apoptosis. However, the mechanism underlying the antioxidant function of Bcl-2 is currently unknown. Recently, Bax and several Bcl-2 homology-3 domain (BH3)-only proteins (Bid, Puma, and Noxa) have been shown to induce a pro-oxidant state at mitochondria (1-4). Given the opposing effects of Bcl-2 and Bax/BH3-only proteins on the redox state of mitochondria, we hypothesized that the antioxidant function of Bcl-2 is antagonized by its interaction with the BH3 domains of pro-apoptotic family members. Here, we show that BH3 mimetics that bind to a hydrophobic surface (the BH3 groove) of Bcl-2 induce GSH-sensitive mitochondrial dysfunction and apoptosis in cerebellar granule neurons. BH3 mimetics displace a discrete mitochondrial GSH pool in neurons and suppress GSH transport into isolated rat brain mitochondria. Moreover, BH3 mimetics and the BH3-only protein, Bim, inhibit a novel interaction between Bcl-2 and GSH in vitro. These results suggest that Bcl-2 regulates an essential pool of mitochondrial GSH and that this regulation may depend upon Bcl-2 directly interacting with GSH via the BH3 groove. We conclude that this novel GSH binding property of Bcl-2 likely plays a central role in its antioxidant function at mitochondria.
Mitochondrial oxidative stress and dysfunction underlie devastating neurodegenerative disorders like Parkinson disease and amyotrophic lateral sclerosis (ALS).2 For example, mitochondrial complex I is oxidatively damaged in Parkinson disease, and inhibitors of complex I (1-methyl-4-phenyl-1,2,3,6-tetrahydropyridine (MPTP) or rotenone) are used to model Parkinson disease in animals (5, 6). Similarly, mitochondrial dysfunction precedes motor neuron death in the mutant SOD1 mouse model of ALS, and antioxidants targeted to the inner mitochondrial membrane enhance survival in this disease model (7, 8). Thus, elucidation of the molecular mechanisms that regulate mitochondrial oxidative stress would enhance the discovery of novel therapeutic agents for neurodegeneration.
Loss-of-function of the pro-survival Bcl-2 protein contributes to mitochondrial oxidative stress in neurodegenerative disease. In addition to its ability to heterodimerize with and inhibit pro-apoptotic family members like Bax and BH3-only proteins (9), Bcl-2 demonstrates at least two other protective functions. First, Bcl-2 regulates Ca2+ release from the endoplasmic reticulum by directly interacting with the inositol 1,4,5-trisphosphate receptor (10). Second, Bcl-2 displays an antioxidant-like action, particularly at the level of the mitochondria (11, 12). For instance, overexpression of Bcl-2 increases levels of the critical antioxidant, GSH, and inhibits mitochondrial dysfunction and cell death elicited by GSH-depleting reagents (12-14). Conversely, Bcl-2-deficient mice display enhanced sensitivity to mitochondrial oxidative stress, exemplified by their increased susceptibility to MPTP neurotoxicity (15). Bcl-2 loss-of-function in neurodegeneration is evidenced by marked reductions in Bcl-2 expression in the substantia nigra of MPTP-treated mice and in spinal motor neurons of ALS patients (16, 17). Moreover, mutant SOD1, which is associated with some forms of familial ALS, was recently shown to sequester Bcl-2 in nonfunctional aggregates at mitochondria (18). In accordance with these findings, overexpression of Bcl-2 is neuroprotective in animal models of Parkinson disease and ALS (19, 20).
Although its antioxidant function was described more than a decade ago, Bcl-2 has no intrinsic antioxidant enzymatic or scavenging activity, and the mechanism by which it suppresses mitochondrial oxidative stress remains elusive. Similarly, little is known about how pro-apoptotic Bax and BH3-only proteins elicit a pro-oxidant state at mitochondria (1-4). In the present study, we examined a potential role for the pro-apoptotic BH3 domain in neutralizing the antioxidant function of Bcl-2.
EXPERIMENTAL PROCEDURES
Materials
HA14-1 (ethyl 2-amino-6-bromo-4-(1-cyano-2-ethoxy-2-oxoethyl)-4H-chromene-3-carboxylate), compound 6 (2,9-dimethoxy-11,12-dihydrodibenzo[c,g] (1, 2)-diazocine 5,6-dioxide), and GSH monoethyl ester were purchased from Calbiochem (San Diego, CA). 3-(4,5-Dimethylthiazol-2-yl)-2,5-diphenyl-tetrazolium bromide (MTT) and MitoSOX dye were obtained from Invitrogen. Rabbit polyclonal antibody to cleaved caspase 3 was purchased from Promega (Madison, WI). Monoclonal antibody to β-tubulin, 4,6-diamidino-2-phenylindole (DAPI), 2,4-dinitro-phenylhydrazine (DNPH), streptavidin conjugated to Cy3, reduced GSH, and Ultragel agarose beads were from Sigma-Aldrich. Dinitrophenol (DNP) polyclonal antibody was purchased from Zymed Laboratories Inc. (South San Francisco, CA). Polyclonal antibody against adenine nucleotide translocase (ANT), GSH-agarose beads, rabbit polyclonal antibody (N19) against Bcl-2, and polyclonal antibody against the His epitope tag were purchased from Santa Cruz Biotechnology (Santa Cruz, CA). JC-1 dye, Mitotracker green, and biotinylated GSH monoethyl ester (BioGEE) were purchased from Molecular Probes (Carlsbad, CA). OPA1 monoclonal antibody was from BD Pharmingen (Franklin Lakes, NJ). COX IV antibody and actin polyclonal antibody were purchased from Cell Signaling (Beverly, MA). Cy3- or fluorescein isothiocyanate-conjugated secondary antibodies for immunocytochemistry were from Jackson ImmunoResearch Inc. (West Grove, PA). [3H]GSH was purchased from PerkinElmer Life Sciences. Horseradish peroxidase-conjugated secondary antibodies and reagents for enhanced chemiluminescence were from Amersham Biosciences. Human recombinant Bcl-2, Bcl-xL, and Bcl-w (C-terminal truncated, His-tagged proteins) were purchased from Oncogene Research Products (San Diego, CA). Recombinant human BimL (C-terminal truncated, His-tagged protein) was obtained from R & D Systems, Inc. (Minneapolis, MN).
Cerebellar Granule Neuron (CGN) Culture
CGNs were isolated from Sprague-Dawley rat pups (postnatal day 7) as described previously (21). CGNs were plated in basal modified Eagle’s medium containing 10% fetal bovine serum, 25 mm KCl, 2 mm l-glutamine, and 100 units/ml penicillin/100 μg/ml streptomycin (Invitrogen) at a density of 4.0 × 10⁶ cells/well on poly-l-lysine-coated, 35-mm-diameter plastic dishes. Cytosine arabinoside (10 μ m) was added to the culture medium at 24 h after plating to inhibit glial growth. The cultures were ∼95-99% pure for CGNs, and the experiments were performed after 6 - 8 days in culture.
MTT Cell Viability Assay
CGNs were incubated with either 15 μm HA14-1 or 50 μm compound 6 (±2 mm GSH monoethyl ester) in serum-free culture medium containing 25 mm depolarizing potassium (25K-ser). After 24 h of incubation, the medium was removed, and CGNs were washed once with phosphate-buffered saline (PBS, pH 7.4) and then incubated for 2 h with 500 μg/ml MTT diluted in 25K-ser. The MTT was removed, and 400 μl of Me2SO were added to each well to dissolve the formazan crystals. Each Me2SO sample was then transferred to a microcentrifuge tube and centrifuged for 2 min at 10,000 rpm. A 100-μl aliquot of each sample was then diluted into 900 μl of deionized H2O, and the absorbance was read at a wavelength of 570 nm (background subtraction = 650 nm). The data were plotted as the percentage of cell viability relative to the control mean absorbance for each independent experiment (n = 4 experiments).
Immunocytochemistry
CGNs plated on polyethyleneimine-coated glass coverslips at a density of ∼2.5 × 10⁵ cells/coverslip were treated as described under “Results” for each experiment and then fixed in 4% paraformaldehyde. Next, CGNs were blocked and permeabilized for 90 min in PBS, pH 7.4, containing 5% BSA and 0.2% Triton X-100, followed by overnight (∼16 h) incubation at 4 °C with primary antibody diluted in 0.2% Triton X-100 and 2% BSA in PBS. The primary antibody was removed, and the coverslips were washed five times with PBS and then incubated with fluorescein isothiocyanate- or Cy3-conjugated secondary antibodies and DAPI diluted in 0.2% Triton X-100 and 2% BSA in PBS for 1 h at room temperature. The secondary antibody solution was removed, and the coverslips were washed five more times with PBS followed by mounting onto glass slides with 0.1% p-phenylenediamine in 75% glycerol in PBS to prevent quenching. The images were captured using an oil immersion objective (63× or 100×) on a Zeiss Axioplan 2 fluorescence microscope equipped with a Cooke Sensicam CCD camera and Slidebook Image analysis software (Intelligent Imaging Innovations, Inc., Denver, CO).
Superoxide Measurement
CGNs were treated with 15 μm HA14-1 for 2 h in serum-free 25K medium. The neurons were then washed in PBS and incubated for 30 min with 1 μm MitoSOX dye diluted in Dulbecco’s modified Eagle’s high glucose, phenol red-free medium (Invitrogen). The images were then captured of live cells using a Cy3 filter and a water immersion objective (63×).
Cell Lysate Preparation
Following treatment as described under “Results,” the neurons were washed once with ice-cold PBS before being scraped into 250 μl of cell lysis buffer (20 mm HEPES, pH 7.4, 50 mm NaCl, 1 mm EGTA, 5 mm β-glycerophosphate, 30 mm sodium pyrophosphate, 1% Triton X-100, 100 μm sodium orthovanadate, 10 μg/ml leupeptin, and 10 μg/ml aprotinin). Each sample was then centrifuged at 10,000 rpm for 3 min, and the supernatant was removed. The protein concentrations were determined using a commercially available protein assay kit (Pierce). Aliquots of each sample (∼80 μg) were diluted in 1× SDS-PAGE sample buffer, boiled for 5 min, and electrophoresed through polyacrylamide gels. The resolved proteins were transferred to polyvinylidene difluoride membranes (Amersham Biosciences) for Western blotting.
Western Blotting
Polyvinylidene difluoride membranes were first blocked for 1 h at room temperature in 1% BSA and 0.01% sodium azide diluted in PBS containing 0.1% Tween 20 (PBS-T). The primary antibodies were diluted in the blocking solution, and the membranes were incubated with primary solution for 1 h at room temperature. The primary antibody was removed, and the membranes were washed five times (5-min intervals) with PBS-T. Next, membranes were incubated for 1 h at room temperature with horseradish peroxidase-conjugated secondary antibodies diluted in PBS-T. The secondary antibody was washed off five times (5-min intervals) with PBS-T, and then immunoreactive proteins were detected with enhanced chemiluminescence.
Identification of Carbonylated Proteins
Following a 6-h incubation in either control, 15 μm HA14-1 or 50 μm compound 6 conditions, the lysates were prepared from each sample in 150 μl of cell lysis buffer. A 50-μl aliquot of each lysate was transferred to a new tube to blot for nonmodified protein (i.e. ANT). A 400-μl volume of 10 mm DNPH (dissolved in 2 m HCl) was added to the remaining 100 μl of lysate for a total volume of 500 μl/tube. This solution was then incubated at room temperature for 1 h, with vortexing every 15 min. Next, the protein was precipitated by the addition of 500 μl of trichloroacetic acid (20% in ddH2O) to each sample followed by centrifugation for 3 min at 13,000 rpm. The supernatants were discarded, and the pellet was washed three times in ethanol/ethyl acetate (mixed 1:1 v/v) with 10-min intervals between washes. The final wash was allowed to completely evaporate, and the pellets were resuspended in 1× SDS-PAGE sample buffer and boiled for 10 min before loading onto a 15% polyacrylamide gel. The membranes were blotted with an antibody against DNP and then stripped and reprobed with an antibody against ANT.
Measurement of Mitochondrial Membrane Potential
CGNs were treated with 15 μm HA14-1 either in the presence or absence of 2 mm GSH for 2 h. Following incubation, CGNs were loaded with 200 nm JC-1 for 30 min at 37 °C, 10% CO2. The neurons were then washed three times with PBS and imaged live with a 63× water immersion objective through a JC-1 dual emission filter set.
Visualization of Mitochondrial Structure
The mitochondria were stained with 200 nm Mitotracker green after a 24-h incubation in either control, 2 mm GSH, 15 μm HA14-1, HA14-1 + GSH, 50 μm compound 6, or compound 6 + GSH conditions. The neurons were stained with the Mitotracker dye for 30 min at 37 °C, 10% CO2, and the cells were imaged live with a 63× water objective through a fluorescein isothiocyanate filter.
In Vivo Analysis of the Mitochondrial GSH Pool
CGNs were preincubated for 1 h with 250 μm BioGEE at 37 °C, 10% CO2. The cells were then incubated for an additional 2 h under either control or HA14-1 (15 μm) conditions. The neurons were then fixed in 4% paraformaldehyde for 20 min and blocked/permeabilized for 1 h in 5% BSA and 0.2% Triton X-100 in PBS. The cells were then incubated for 90 min at room temperature with 1 μm Hoechst dye and streptavidin conjugated to Cy3 (1:200) to label the BioGEE. The images were captured with either a 63× or 100× oil immersion objective. The Cy3-streptavidin staining was quantified as either punctate or diffuse for ∼300 cells/condition from each of three independent experiments.
Isolation of Mitochondria from Rat Brain
Isolation of rat brain mitochondria was performed as described previously (22). Whole rat brains, excluding the cerebellum (∼0.5 g), were removed from 7-day-old rat pups and transferred to ice-cold isolation buffer containing 0.64 m sucrose, 2 mm EDTA, and 20 mm Tris-HCl, pH 7.4. After separating the hemispheres, the tissue was homogenized in 2 ml of isolation buffer, using a loose pestle (5×) followed by a tight pestle (8×) to obtain a uniform slurry. Next, Percoll (final concentration, 12%) was added, and centrifugation was performed at 16,000 rpm at 4 °C for 5 min. The supernatant (2 ml) was discarded, and the pellet was resuspended in isolation buffer and gently applied to a 40%/19% (equal v/v) Percoll gradient and centrifuged again at 16,000 rpm at 4 °C for 10 min. The mitochondrial layer was then attained from the approximate interface between the 19 and 40% layers and mixed with isolation buffer (1:4 v/v) in a new tube and then centrifuged at 12,000 rpm at 4 °C for 10 min. Approximately 0.5 ml of supernatant was left in the tube with the mitochondrial pellet, which was then resuspended in 5 ml of isolation buffer containing 5 mg/ml BSA and then centrifuged again at 7,500 rpm at 4 °C for 10 min. The supernatant was poured off, and the final mitochondrial pellet was resuspended in 100 μl of isolation buffer/each brain. Percoll gradients were prepared fresh for each new isolation. (Amersham Biosciences).
GSH Uptake Assay in Isolated Mitochondria
GSH transport into isolated mitochondria was measured by a modification of a previously published method (23). Briefly, 20 μl of rat brain mitochondria were added to 230 μl of GSH transport buffer (5 mm HEPES, pH 7.2, 220 mm mannitol, 70 mm sucrose, 0.1 mm EDTA, 0.1% BSA (fatty acid-free), 5 mm succinate, and 1 mm potassium phosphate) at room temperature. The isolated mitochondria were then preincubated for ∼20 min with either 0.5 μl Me2 SO (vehicle) or 20 μm HA14-1. A trace amount (0.5 μCi) of radiolabeled [3H]GSH in buffer containing unlabeled (cold) GSH at varying final concentrations (50 μm, 500 μm, or 5 mm) was then added to the isolated mitochondria, vortexed and incubated for 15 s at room temperature. A 1-ml volume of icecold transport buffer was then added to each tube, and the samples were pelleted and washed twice with 0.5 ml ice-cold buffer, and then 100 μlof1 n NaOH were added to dissolve the final pellets. [3H]GSH uptake into the isolated mitochondria was counted by liquid scintillation. The data were calculated as percentages of [3H]GSH uptake relative to the control condition in the presence of 50 μm cold GSH (i.e. the condition with the greatest [3H]GSH uptake).
Cell-free GSH Peroxidase (GSHpx) Assay
GSHpx assay buffer containing purified GSHpx (final concentration, 20 units/ml; isolated from human erythrocytes; Sigma-Aldrich) was preincubated for 20 min at room temperature (25 °C) alone or in the presence of either HA14-1 (20 μm) or an equivalent volume of Me2 SO vehicle. After preincubation, tert-butylhydroperoxide (tBH; 300 μm) and NADPH assay reagent (yielding a final concentration of 0.25 mm NADPH, 2.1 mm reduced GSH, and 0.5 unit/ml GSH reductase, GSH peroxidase assay kit; Sigma-Aldrich) were added. The solutions were then incubated at 37 °C for 3-5 min, and the change in absorbance at 340 nm was read using assay buffer alone as a blank. The activity of GSHpx was calculated as the average change in NADPH absorbance per min. The conditions were assayed in triplicate for each of three experiments.
GSHpx Assay in CGN Lysates
CGNs were treated for 4 h in control medium in the absence or presence of either HA14-1 (15 μm) or compound 6 (50 μm). After 4 h, the cells were lysed as described above, and the lysates were divided equally into two conditions: (+) or (-) tBH. Cell lysates were diluted in GSHpx assay buffer, and NADPH assay reagent (yielding a final concentration of 0.25 mm NADPH, 2.1 mm reduced GSH and 0.5 unit/ml GSH reductase) was added to all conditions. tBH (300 μm) was then added to the (+) tBH conditions. The lysates were incubated for 5 min at 37 °C, and the change in absorbance at 340 nm was recorded. Activity of GSHpx was calculated as the average change in NADPH absorbance/min within each condition, and the (-) tBH result was subtracted to account for any nonspecific NADPH oxidation. The conditions were performed in duplicate for each of three experiments.
In Vitro GSH Binding Assay with Recombinant Bcl-2 Proteins
Fifty ng of His-tagged recombinant Bcl-2 (or Bcl-xL or Bcl-w) were added to 100 μl of cell lysis buffer (see “Cell Lysate Preparation”) that was modified by the deletion of Triton X-100 and the addition of 1 mm dithiothreitol. A 30-μl aliquot of either GSH-ag beads (4% agarose) or 4% agarose beads alone was added to the recombinant Bcl-2 proteins, and the samples were mixed by rotation for 1 h at 4°C. When indicated, HA14-1 (at the concentrations specified), compound 6 (500 μm), or recombinant BimL (final concentration, 2 μm) were added to the recombinant Bcl-2 and samples were preincubated for 1 h at 4 °C prior to the addition of GSH-ag beads. Each sample was centrifuged for 2 min at 13,400 rpm, and the supernatants were discarded. The pellets were washed with ice-cold PBS, suspended in 1× SDS-PAGE sample buffer, and boiled for 10 min. The samples were then resolved on 12.5% polyacrylamide gels and detected with either a Bcl-2 antibody or an antibody to the 6× His epitope tag.
Data Analysis
The results shown represent the means ± S.E. for the number (n) of independent experiments performed. Statistical differences were obtained either by one-way analysis of variance followed by a post-hoc Tukey’s test or by an unpaired Student’s t test. A p value of <0.05 was considered statistically significant. In general, images or immunoblots shown are representative of the results obtained in at least three independent experiments.
RESULTS
Inhibition of Bcl-2 Induces Mitochondrial Oxidative Stress and GSH-sensitive Neuronal Apoptosis
We utilized two uniquely structured BH3 mimetics, HA14-1 or compound 6 (Fig. 1A), to inhibit endogenous Bcl-2 activity in primary rat CGNs. These small molecule Bcl-2 inhibitors bind in a hydrophobic surface groove of Bcl-2 (the BH3 groove), thereby mimicking the BH3-dependent interaction of pro-apoptotic family members with Bcl-2 (24, 25). Incubation of CGNs with either Bcl-2 inhibitor for 24 h induced cell death, which was effectively blocked by co-incubation with a cell-permeable, monoethyl ester of GSH (Fig. 1B). Consistent with an apoptotic mode of death, HA14-1 induced activation of the executioner caspase 3 (Fig. 1C) and caused disruption of the microtubule network (Fig. 1D), effects that were both prevented by GSH. Thus, inhibition of endogenous Bcl-2 function by BH3 mimetics induces GSH-sensitive apoptosis in CGNs.
FIGURE 1. Small molecule BH3 mimetics induce GSH-sensitive, mitochondrial oxidative stress and neuronal apoptosis.
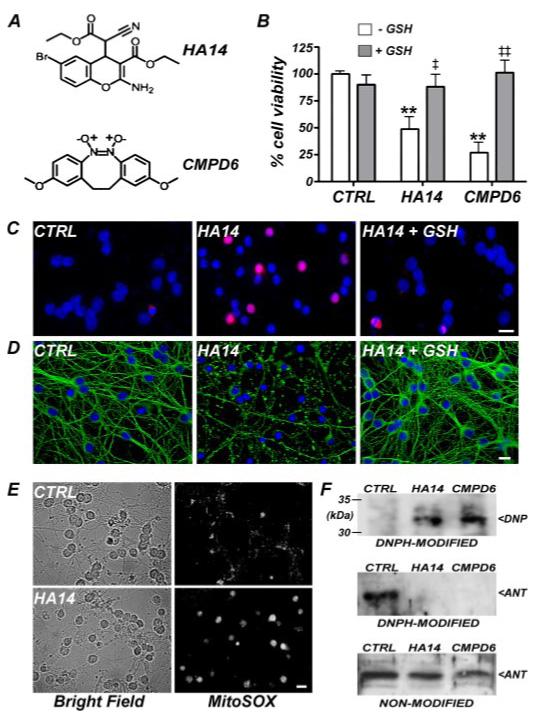
A, chemical structures of the BH3 mimetics, HA14-1 (HA14; top) and compound 6 (CMPD6; bottom). B, percentage of healthy cells in control (CTRL) CGNs versus those treated with BH3 mimetics (HA14 at 15 μm; CMPD6 at 50 μm) for 24 h either in the absence (white bars) or presence (gray bars) of GSH (monoethyl ester; 2 mm) as measured by an MTT cell viability assay. **, p < 0.01 versus CTRL; ‡, p < 0.05 versus HA14-GSH; ‡‡, p < 0.01 versus CMPD6-GSH; n = 4 experiments, each performed in duplicate. C and D, immunocytochemistry for active (cleaved) caspase 3 (C; red) and β tubulin (D; green) in CGNs treated with HA14 (15 μm) for 4 h(middle) versus CTRL (left), or HA14 + GSH (2 mm)(right). The nuclei were stained with DAPI (blue). Scale bars, 10 microns. E, superoxide levels in CTRL (top, right) and HA14-treated (bottom, right) CGNs were visualized after a 4-h incubation using the specific fluorogenic dye, MitoSOX. Brightfield images are included to show the overall cellular morphology at this time point (left panels). Scale bar, 10 microns. F, protein carbonylation was detected in lysates of control versus BH3 mimetic-treated (HA14 at 15 μm; CMPD6 at 50 μm) CGNs using a DNPH assay and immunoblotting for DNP-derivatized proteins (top). The ∼33-kDa, carbonylated protein was identified as mitochondrial ANT (bottom) and was not detectable with an ANT-specific antibody following DNPH modification (middle).
Next, we examined whether BH3 mimetics caused mitochondrial oxidative stress by analyzing the production of superoxide with the fluorescent dye MitoSOX. MitoSOX localizes to mitochondria and is essentially nonfluorescent in its reduced form, whereas it produces a red fluorescent emission upon its specific oxidation by superoxide. Once oxidized, MitoSOX binds tightly to DNA, further enhancing its fluorescence. In healthy CGNs, minimal MitoSOX fluorescence was detected, consistent with the basal production of superoxide at mitochondria (Fig. 1E, upper right panel). After incubation with HA14-1 for 2 h, MitoSOX fluorescence markedly increased and appeared nuclear, consistent with binding of the oxidized probe to DNA (Fig. 1E, lower right panel). The increase in superoxide production induced by the BH3 mimetic preceded any morphological evidence of neurotoxicity detected under brightfield (Fig. 1E>, left panels).
As an independent measure of mitochondrial oxidative stress, we examined CGN lysates for oxidized (carbonylated) proteins using a DNPH assay. Previous studies have shown that mitochondrial proteins, such as ANT or aconitase, are particularly sensitive to oxidative damage (26). Utilizing this technique, we consistently observed DNP derivatization of a 33-kDa protein only in lysates obtained from BH3 mimetic-treated CGNs (Fig. 1F, top blot). Upon stripping and reprobing, ANT was detected at 33 kDa in the control lysate but not in lysates from BH3 mimetic-treated CGNs (Fig. 1F, middle blot). The apparent loss of ANT immunoreactivity in BH3 mimetictreated and DNPH-modified samples was due to interference with the ANT antibody recognition domain by the DNP moiety. This was verified by the fact that equal amounts of ANT were detectable in lysates obtained from control and BH3 mimetic-treated CGNs when assayed prior to the DNPH modification step (Fig. 1F, bottom blot). Collectively, these results demonstrate that inhibition of Bcl-2 with BH3 mimetics results in increased mitochondria-derived reactive oxygen species and enhanced oxidative damage to mitochondrial proteins. In contrast, using assays designed to detect more global increases in cellular oxidative stress, including oxidation of dichlorofluorescin to detect hydrogen peroxide or assay of malondialdehyde to measure lipid peroxidation, we failed to observe significant changes (data not shown). These findings suggest that the oxidative stress induced in CGNs by BH3 mimetics is largely restricted to mitochondria.
BH3 Mimetics Elicit GSH-sensitive Mitochondrial Depolarization and Fragmentation
Next, we assessed the consequences of this localized oxidative stress to mitochondrial structure and function. Measurement of the mitochondrial membrane potential with the dual emission fluorophore, JC-1, revealed both red (aggregated probe) and green (monomeric probe) fluorescence in control CGNs (Fig. 2A, left panel). The red fluorescence was consistent with an intact membrane potential because aggregation of JC-1 is induced by its accumulation in healthy mitochondria. After incubation for 4 h with HA14-1, JC-1 fluorescence was primarily green, indicative of mitochondrial depolarization (Fig. 2A, middle panel). This depolarization was prevented by co-incubation with GSH, implicating oxidative stress as an underlying cause (Fig. 2A, right panel).
FIGURE 2. BH3 mimetics disrupt mitochondrial function and structure in a GSH-sensitive manner.

A, mitochondrial membrane potential was measured in live CGNs using the dual emission fluorophore, JC-1. Control (CTRL) CGNs showed substantial red fluorescence indicative of aggregated JC-1, which localizes to healthy mitochondria (left). After the addition of 15 μm HA14 for 4 h, mitochondria were largely depolarized as indicated by the primarily green staining characteristic of monomeric JC-1 dye (middle). Co-incubation with 2 mm GSH monoethyl ester preserved the mitochondrial membrane potential even in the presence of the BH3 mimetic (right). Scale bar, 10 microns. B, mitochondrial structure was assessed in live CGNs using the fluorescent probe, Mitotracker green. CTRL or GSH-treated CGNs displayed healthy, largely tubular mitochondria (left column). In contrast, the mitochondria of HA14-treated or CMPD6-treated CGNs became round and fragmented (upper middle and upper right). Co-incubation with GSH protected mitochondria from the structural damage caused by these BH3 mimetics (lower middle and lower right). Scale bar, 5 microns. C and D, CGNs were treated with either 15 μm HA14 (C) or 50 μm CMPD6 (D) for 24 h in either the absence or presence of2 mm GSH. Degradation of the mitochondrial fusion GTPase, OPA1, was assessed by Western blotting. Actin is shown as a loading control.
Coincident with mitochondrial depolarization induced by the BH3 mimetic, we also observed marked fragmentation of mitochondria using the fluorescent probe, Mitotracker green. Control CGNs (±GSH) contained mitochondria that appeared mostly tubular (Fig. 2B, left panels). In contrast, CGNs exposed to either BH3 mimetic displayed round and fragmented mitochondria (Fig. 2B, upper middle and upper right panels). Co-incubation with GSH significantly inhibited the mitochondrial fragmentation induced by these Bcl-2 inhibitors (Fig. 2B, lower middle and lower right panels). Finally, we examined expression of the OPA1 GTPase, which promotes mitochondrial fusion (27). In control CGNs, OPA1 appeared as a doublet of ∼80/90 kDa (Fig. 2, C and D). Incubation with either BH3 mimetic induced marked degradation of OPA1, which was blocked by GSH. The protection of OPA1 is consistent with the capacity of GSH to prevent BH3 mimetic-induced mitochondrial fragmentation. The above data illustrate that the mitochondrial oxidative stress elicited by Bcl-2 inhibition is sufficient to trigger GSH-sensitive mitochondrial depolarization, fragmentation, and degradation of the OPA1 GTPase.
BH3 Mimetics Displace the Mitochondrial GSH Pool and Suppress Mitochondrial GSH Transport
Because GSH protected CGNs from the mitochondrial oxidative stress induced by BH3 mimetics, we hypothesized that depletion of mitochondrial GSH may underlie the observed toxicity. To analyze the mitochondrial GSH pool specifically, we took advantage of the properties of biotinylated GSH monoethyl ester (BioGEE). This cell-permeable GSH selectively localizes to mitochondria because of its biotin conjugate, and therefore, it can be utilized as an intracellular probe for mitochondrial GSH. BioGEE localization was visualized by staining with a Cy3-conjugated streptavidin. Fig. 3A (left two columns) shows Cy3-streptavidin staining of control or HA14-1-treated CGNs that were not loaded with BioGEE. The neurons showed a punctate distribution of Cy3-streptavidin regardless of whether they were exposed to the BH3 mimetic. These data are quantified in Fig. 3B (- BioGEE). The punctate distribution of Cy3-streptavidin staining is consistent with enrichment of endogenous biotinylated proteins at mitochondria (28). Exposure to HA14-1 had no effect on the localization of these endogenous biotinylated proteins. In contrast, Cy3-streptavidin staining changed from a punctate localization in control cells to a mostly diffuse distribution after HA14-1 exposure when CGNs were loaded with BioGEE prior to treatment (Fig. 3, A, right two columns, and B, + BioGEE). Although some punctate Cy3-streptavidin staining remained after BH3 mimetic treatment, this likely represents a background of endogenous biotinylated proteins that were retained within mitochondria. Despite this punctate background staining, a diffuse distribution of Cy3-streptavidin was clearly evident in BioGEE-loaded CGNs exposed to HA14-1, indicative of the release of BioGEE from the mitochondria (Fig. 3A, right column). Moreover, Cy3-streptavidin staining in Bio-GEE-loaded control CGNs corresponded to a mitochondrial distribution as evidenced by its co-localization with cytochrome c oxidase subunit IV (Fig. 3C, upper panels). Furthermore, although the BH3 mimetic, HA14-1, caused BioGEE to be released into the cytosol, it did not affect the mitochondrial localization of cytochrome c oxidase subunit IV (Fig. 3C, lower panels). These results indicate that inhibition of Bcl-2 results in a marked displacement of GSH from mitochondria.
FIGURE 3. The BH3 mimetic, HA14-1, displaces the mitochondrial GSH pool in CGNs and inhibits GSH transport into isolated mitochondria.
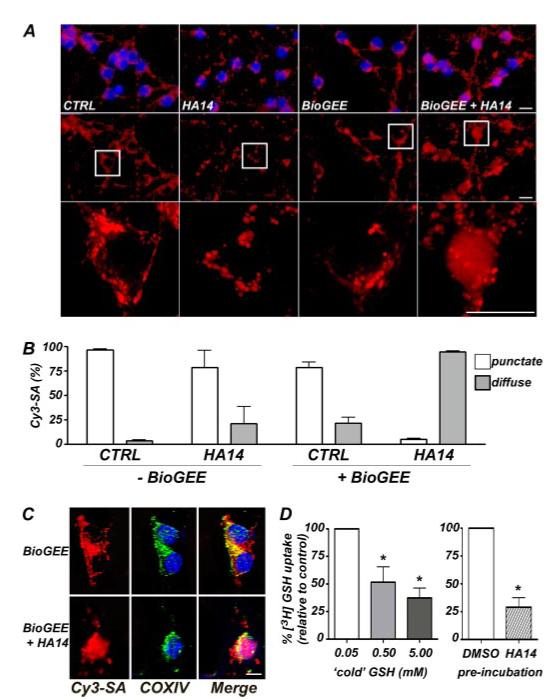
A, the cellular distribution of a BioGEE probe was visualized with streptavidin conjugated to Cy3 (red). In CGNs that were not loaded with BioGEE (left two columns), Cy3-streptavidin (Cy3-SA) bound to biotinylated proteins in the mitochondria, and exposure to HA14 had no effect on the localization of staining. However, in neurons that were loaded with BioGEE for 1 h prior to treatment (right two columns), the Cy3-SA staining showed a redistribution from a punctate and primarily mitochondrial localization in CTRL cells, to a much more diffuse, cytoplasmic staining pattern in HA14-treated cells. The nuclei were stained with DAPI (blue). Top row, Cy3-SA and DAPI; middle row, Cy3-SA alone; bottom row, the areas demarcated by the boxes were magnified approximately four times. Scale bars, 10 microns. B, quantitation of punctate versus diffuse Cy3-SA staining (as described in A) in CGNs that were either unloaded or loaded with BioGEE for 1 h prior to HA14 (15 μm) treatment for 2 h. The data shown are the means ± S.E. for four separate experiments in which ∼250 cells were quantified per experiment. C, BioGEE, labeled by Cy3-SA staining (red), co-localized with the integral mitochondrial membrane protein, COX IV (green), in CTRL CGNs but not in cells treated with the Bcl-2 inhibitor, HA14. The nuclei were stained with DAPI (blue). Scale bar,10 microns. D, mitochondria isolated from whole neonatal rat brain were incubated with 0.5 μCi of [3H]GSH for 15 s at room temperature. Increasing the concentration of unlabeled (cold) reduced GSH in the incubation buffer competed with the [3H]GSH and caused a decrease in its uptake into mitochondria (left bar graph). *, p < 0.01 versus the lowest concentration of cold GSH (0.05 mm), which was arbitrarily set at 100% [3H]GSH uptake. Preincubation for ∼20 min with the BH3 mimetic HA14 (20 μm) significantly blocked [3H]GSH uptake into isolated mitochondria when assayed in the presence of 0.05 mm cold GSH (right bar graph). *, p < 0.01 versus Me2SO vehicle preincubation. The results shown are the means ± S.E. of three experiments, each performed in triplicate. CTRL, control.
The mitochondrial GSH pool is derived entirely by uptake from the more abundant cytosolic pool (29). Because the BH3 mimetic caused displacement of mitochondrial GSH, we postulated that Bcl-2 might have a previously unrecognized function of regulating GSH transport into mitochondria. Therefore, we measured the effects of the BH3 mimetic on uptake of [3H]GSH into isolated rat brain mitochondria. A marked decrease in [3H]GSH uptake was observed upon increasing the concentration of “cold” reduced GSH in the assay buffer, validating the assay (Fig. 3D, left graph). Most significantly, preincubation with HA14-1 dramatically suppressed transport of [3H]GSH into isolated mitochondria (Fig. 3D, right graph). These data suggest that displacement of mitochondrial GSH by the BH3 mimetic may be due, in part, to inhibition of the capacity of Bcl-2 to regulate GSH transport into mitochondria.
BH3 Mimetics Have No Effect on GSHpx Activity
GSHpx is a key GSH-dependent antioxidant enzyme required for the detoxification of hydrogen peroxide. GSHpx activity is essential within mitochondria to scavenge the hydrogen peroxide that is generated by the dismutation of superoxide radical (produced itself by the inadvertent leakage of free electrons to molecular oxygen during electron transport). Its critical role within mitochondria is evidenced by enhanced sensitivity of mice lacking the GSHpx-1 gene to the neurotoxic effects of the mitochondrial complex I inhibitor, MPTP (30). In addition, Bcl-2 knockout mice show significantly decreased GSHpx activity in brain and are much more sensitive than wild-type mice to mitochondrial neurotoxins such as MPTP (15). Finally, GSHpx is susceptible to oxidative damage and inactivation by both reactive oxygen and nitrogen species (31, 32).
Given the fact that BH3 mimetics induced GSH-sensitive mitochondrial oxidative stress and apoptosis in CGNs, we investigated the potential of these compounds to inhibit GSHpx activity either directly or indirectly. First, in an in vitro assay utilizing purified GSHpx from human erythrocytes, we found that incubation with HA14-1 had no detectable effect on the antioxidant enzyme activity measured by the rate of oxidation of NADPH (Fig. 4A). This result demonstrates that the BH3 mimetic does not directly inhibit the activity of GSHpx, an observation that is consistent with the fact that GSHpx does not contain a BH3 groove similar to that of Bcl-2. Second, we incubated CGNs in either the absence or presence of HA14-1 (15 μm) or compound 6 (50 μm) for 4 h, conditions under which these BH3 mimetics induced superoxide production (Fig. 1E) and GSH-sensitive mitochondrial depolarization (Fig. 2A). Following incubation, GSHpx activity was then assayed in cell lysates. Incubation of intact CGNs with either BH3 mimetic had no inhibitory effect on cellular GSHpx activity (Fig. 4B). These data indicate that BH3 mimetics do not elicit oxidative inactivation of GSHpx in intact CGNs. Thus, GSHpx is not a molecular target of BH3 mimetics, and inactivation of this enzyme does not underlie the observed mitochondrial oxidative stress and GSH-sensitive apoptosis induced by these compounds in CGNs.
FIGURE 4. BH3 mimetics have no significant effects on GSH peroxidase activity.

A, purified GSHpx (final concentration, 20 units/ml) was preincubated for 20 min alone (Con) or in the presence of either HA14 (20 μm) or an equivalent volume of Me2SO. After incubation, tBH (300 μm) and NADPH assay reagent were added. The solutions were incubated at 37 °C for 3-5 min, and GSHpx activity was assayed by measuring the change in absorbance at 340 nm. The conditions were assayed in triplicate for each of three experiments. B, CGNs were treated for 4 h in control medium in the absence (Con)or presence of either HA14 (15 μm) or compound 6 (CMPD6; 50 μm). After 4 h, GSHpx activity was assayed in cell lysates as described under “Experimental Procedures.” The conditions were performed in duplicate for each of three experiments.
Bcl-2 Directly Binds GSH in a BH3-sensitive Manner
Bcl-2 is known to regulate endoplasmic reticulum Ca2+ release by directly interacting with the inositol 1,4,5-trisphosphate receptor (10). We therefore hypothesized that Bcl-2 might regulate mitochondrial GSH by a similar direct interaction. Initially, we compared the affinity of recombinant Bcl-2 for GSH-conjugated agarose versus unconjugated agarose. Essentially all of the Bcl-2 bound tightly to GSH beads, whereas only a small fraction adhered (nonspecifically) to agarose (Fig. 5A). This novel Bcl2/GSH interaction was not due to covalent glutathiolation of Bcl-2 because a reducing agent, dithiothreitol, was required for the binding (Fig. 5B). In comparison with the pro-survival family members, Bcl-xL and Bcl-w, Bcl-2 bound most tightly to GSH in vitro with essentially all of the Bcl-2 binding to the GSH beads (Fig. 5C, top blot). Bcl-xL was initially pulled out of the supernatant; however, washing apparently displaced the Bcl-xL from the GSH beads (Fig. 5C, middle blot). Bcl-w demonstrated little to no affinity for GSH because it was largely retained in the supernatant (Fig. 5C, bottom blot). Thus, GSH binding shows relative selectivity for Bcl-2 when compared with other prosurvival family members.
FIGURE 5. Bcl-2 specifically binds to GSH in vitro, and this interaction is antagonized by BH3 mimetics.
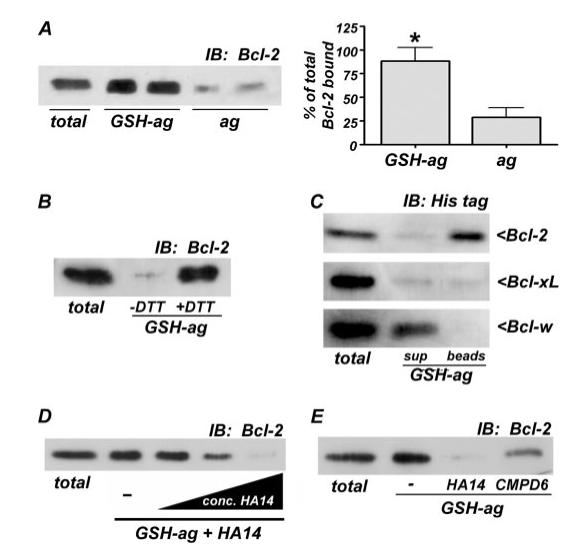
A, agarose beads conjugated to GSH (GSH-ag) but not unconjugated agarose beads alone (ag), bound to recombinant, His-tagged Bcl-2 in an in vitro pull down assay (left), as described under “Experimental Procedures.” Total His-Bcl-2 (50 ng) added to the assay is shown, and the fraction of the total Bcl-2 bound to GSH-ag or ag was quantified by densitometry (right). The data shown are from four independent experiments, each performed in duplicate. *, p < 0.01 compared with ag alone. B, the GSH-binding assay was carried out in either the absence or presence of the reducing agent, dithiothreitol (1 mm). Dithiothreitol was required for the specific interaction between Bcl-2 and GSH. C, GSH bound with higher affinity to Bcl-2 than to the homologous family members, Bcl-xL and Bcl-w. Equal amounts (50 ng) of either His-tagged Bcl-2, Bcl-xL, or Bcl-w were incubated with GSH-ag beads, followed by Western blotting of the supernatant (sup) and GSH-ag beads for the His tag. Bcl-2 bound almost entirely to GSH-ag beads (top). Although Bcl-xL bound GSH with enough affinity to be pulled out of the supernatant, the interaction was not strong enough to withstand washing, and therefore, no Bcl-xL was detected bound to the GSH-ag beads (middle). Bcl-w displayed little apparent affinity for GSH and remained primarily in the supernatant (bottom). D, His-tagged Bcl-2 binding to GSH was measured in the presence of increasing concentrations (conc.) of HA14-1 (0 (-), 100, 200, and 500 μm). The BH3 mimetic dose-dependently disrupted the in vitro interaction between Bcl-2 and GSH. E, Bcl-2 binding to GSH was assessed in the absence or presence of either of two BH3 mimetics, HA14 or CMPD6 (each at 500 μm). IB, immunoblot.
If this novel GSH binding property of Bcl-2 plays a role in regulating the mitochondrial GSH pool and modulating sensitivity to oxidative stress, then BH3 mimetics that displace mitochondrial GSH should also disrupt the Bcl-2/GSH interaction. In fact, incubation of Bcl-2 with increasing concentrations of HA14-1 dose-dependently antagonized the in vitro binding to GSH (Fig. 5D). Moreover, a similar result was observed with the structurally distinct BH3 mimetic, compound 6 (Fig. 5E). These data show that the novel Bcl-2/GSH interaction is disrupted by BH3 mimetics that bind in the BH3 groove of Bcl-2.
Finally, we examined the potential of a recombinant BH3-only protein, BimL, to inhibit the Bcl-2/GSH interaction in vitro. Incubation of Bcl-2 with recombinant BimL at a concentration of 2 μm essentially abolished the ability of Bcl-2 to bind to GSH (Fig. 6A). When quantified in comparison with the inhibitory effects of the BH3 mimetic, HA14-1, recombinant BimL (2 μm) was equally effective to the maximum concentration of HA14-1 used at disrupting the Bcl-2/GSH interaction (Fig. 6B). Thus, the BH3-only protein, BimL, which binds with high affinity in the BH3 groove of Bcl-2, significantly inhibits the novel GSH binding property of Bcl-2 in vitro.
FIGURE 6. The in vitro interaction between Bcl-2 and GSH is disrupted by recombinant BimL.
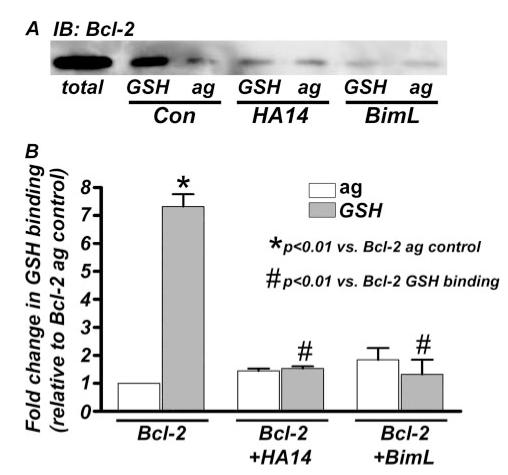
A, the in vitro GSH binding assay with recombinant Bcl-2 was carried out, as described under “Experimental Procedures,” in the absence (control; Con) or presence of either the BH3 mimetic, HA14-1 (HA14; 500 μm), or recombinant His-tagged BimL (2 μm). Consistent with data obtained in Fig. 5, recombinant Bcl-2 bound to GSH-agarose (GSH) beads significantly more than to agarose alone (ag) in control conditions (lanes 2 and 3). Additionally, preincubation of Bcl-2 with HA14 for 1 h prior to GSH addition prevented this interaction (lanes 4 and 5). In a similar manner, the Bcl-2/GSH interaction was completely disrupted by preincubation with recombinant BimL (lanes 6 and 7). Lane 1 shows the total amount of Bcl-2 added to the binding assay (50 ng). B, densitometric analysis was performed on Bcl-2 immunoblots (IB) from three independent GSH binding experiments performed as described in A. Bcl-2-bound GSH beads to a significantly greater extent than ag alone in control conditions (*, p < 0.01). This interaction was completely disrupted by preincubation with either HA14 or recombinant BimL (#, p < 0.01).
DISCUSSION
In the present study, we have made the novel observation that Bcl-2 can directly bind GSH in vitro, and this interaction depends on availability of the BH3 groove. For instance, BH3 mimetics and the BH3-only protein, BimL, which bind in the BH3 groove, antagonize the Bcl-2/GSH interaction. Moreover, BH3 mimetics displace GSH from mitochondria in intact neurons, suggesting that the Bcl-2/GSH interaction plays a central role in sustaining the mitochondrial GSH pool. The BH3 mimetics, HA14-1 and compound 6 both inhibit the Bcl-2/ GSH interaction in vitro and induce similar adverse effects on mitochondria in neurons (e.g. ANT oxidation, OPA1 degradation, mitochondrial fragmentation), despite their completely distinct chemical structures. In addition, these compounds do not have any significant effects on the activity of a prominent antioxidant protein, GSHpx, that requires GSH for its function but that lacks a BH3 groove. These findings indicate that binding in the BH3 groove of Bcl-2 is the major factor underlying the observed mitochondrial oxidative stress and GSH-sensitive neuronal apoptosis induced by these BH3 mimetics.
Based on these data, we propose that the GSH binding activity of Bcl-2 significantly contributes to its antioxidant function at mitochondria. Direct GSH binding may allow Bcl-2 to act as a sensor for the redox status of mitochondria by detecting and regulating the mitochondrial GSH pool. In conjunction with its ability to regulate the mitochondrial GSH pool, Bcl-2 may also supply a highly localized source of GSH to the mitochondrial membrane via direct GSH binding. This localized GSH would likely decrease the susceptibility of mitochondrial membrane proteins to oxidation. In support of this hypothesis, BH3 mimetics that disrupt the Bcl-2/GSH interaction also elicit oxidation of mitochondrial ANT in CGNs. Interestingly, oxidized ANT shows diminished ATP/ADP translocase activity while gaining function as a putative component of the permeability transition pore (33). Consequently, ANT oxidation contributes to pore opening and subsequent permeabilization of the outer mitochondrial membrane. In this context, the potential of Bcl-2 to indirectly inhibit ANT oxidation by increasing GSH content in the mitochondrial membrane may play a key role in the known capacity of Bcl-2 to suppress the mitochondrial permeability transition (34).
Our findings also suggest a molecular mechanism to explain the opposing effects of Bcl-2 and pro-apoptotic family members on the redox state of mitochondria. Whereas Bcl-2 provides an antioxidant function at mitochondria (11, 12), Bax and several BH3-only proteins induce a pro-oxidant state at this organelle (1-4). Because BH3 mimetics and the BH3-only protein, BimL, inhibit the Bcl-2/GSH interaction in vitro, we predict that pro-apoptotic family members elicit mitochondrial oxidative stress by similarly disrupting this novel interaction via BH3 domain binding to Bcl-2. Disruption of the GSH binding function of Bcl-2 would not only diminish the mitochondrial membrane of this critical antioxidant, it would also have the potential to suppress mitochondrial GSH uptake. Indeed, BH3 mimetics markedly inhibit GSH uptake into isolated rat brain mitochondria, suggesting that Bcl-2 acts as a regulator of mitochondrial GSH transport. Suppression of mitochondrial GSH uptake would consequently deplete the mitochondrial GSH pool. The ensuing mitochondrial oxidative stress would ultimately result in initiation of the intrinsic apoptotic cascade and cell death.
Finally, although our data showing that Bcl-2 can act as a GSH-binding protein are novel, the idea that Bcl-2 can locally regulate the GSH content of individual organelles is not unprecedented. Nearly 10 years ago, Voehringer et al. (35) demonstrated that the overexpression of Bcl-2 in HeLa cells resulted in a marked accumulation of GSH in the nucleus that was correlated with the relative concentration of Bcl-2 protein in the nuclear membrane. It is tempting to speculate that these previous findings may be explained by the ability of Bcl-2 to directly bind GSH and perhaps regulate its transport into diverse organelles such as the mitochondrion and the nucleus.
In conclusion, we describe a novel GSH binding function of Bcl-2 that is inhibited by BH3 mimetics and the BH3-only protein, BimL. Our data suggest that this newly identified property of Bcl-2 may play an important role in the proper regulation of the mitochondrial GSH pool that plays such a critical role in determining neuronal survival and death.
Acknowledgment
We thank Kristen Ryan for technical assistance.
Footnotes
- ALS
- amyotrophic lateral sclerosis
- ag
- agarose
- ANT
- adenine nucleotide translocase
- BH3
- Bcl-2 homology-3 domain
- BioGEE
- biotinylated GSH monoethyl ester
- CGN
- cerebellar granule neuron
- Cy3-SA
- Cy3-Streptavidin
- DNP
- 2,4-dinitrophenol
- DNPH
- dinitrophenylhydrazine
- GSHpx
- glutathione peroxidase
- MPTP
- 1-methyl-4-phenyl-1,2,3,6-tetrahydro-pyridine
- DAPI
- 4,6-diamidino-2-phenylindole
- MTT
- 3-(4,5-dimethylthiazol-2-yl)-2,5-diphenyl-tetrazolium bromide
- PBS
- phosphate-buffered saline
- BSA
- bovine serum albumin
- tBH
- tert-butylhydroperoxide
This work was supported by Merit Review Grants from the Dept. of Veterans Affairs (to D. A. L. and K. L. T.) and National Institutes of Health Grants R01 NS050138 and 1R01 NS051403 (to K. L. T.). This work has previously been presented in part at the Society for Neuroscience Annual Meeting in October, 2006. The costs of publication of this article were defrayed in part by the payment of page charges. This article must therefore be hereby marked “advertisement” in accordance with 18 U.S.C. Section 1734 solely to indicate this fact.
REFERENCES
- 1.Kirkland RA, Windelborn JA, Kasprzak JM, Franklin JL. J. Neurosci. 2002;22:6480–6490. doi: 10.1523/JNEUROSCI.22-15-06480.2002. [DOI] [PMC free article] [PubMed] [Google Scholar]
- 2.Kim JY, Ahn HJ, Ryu JH, Suk K, Park JH. J. Exp. Med. 2004;199:113–124. doi: 10.1084/jem.20030613. [DOI] [PMC free article] [PubMed] [Google Scholar]
- 3.Ding WX, Ni HM, DiFrancesca D, Stolz DB, Yin XM. Hepatology. 2004;40:403–413. doi: 10.1002/hep.20310. [DOI] [PubMed] [Google Scholar]
- 4.Liu Z, Lu H, Shi H, Du Y, Yu J, Gu S, Chen X, Liu KJ, Hu CA. Cancer Res. 2005;65:1647–1654. doi: 10.1158/0008-5472.CAN-04-1754. [DOI] [PubMed] [Google Scholar]
- 5.Keeney PM, Xie J, Capaldi RA, Bennett JP., Jr. J. Neuro-sci. 2006;26:5256–5264. doi: 10.1523/JNEUROSCI.0984-06.2006. [DOI] [PMC free article] [PubMed] [Google Scholar]
- 6.Bove J, Prou D, Perier C, Przedborski S. NeuroRx. 2005;2:484–494. doi: 10.1602/neurorx.2.3.484. [DOI] [PMC free article] [PubMed] [Google Scholar]
- 7.Kong J, Xu Z. J. Neurosci. 1998;18:3241–3250. doi: 10.1523/JNEUROSCI.18-09-03241.1998. [DOI] [PMC free article] [PubMed] [Google Scholar]
- 8.Petri S, Kiaei M, Damiano M, Hiller A, Wille E, Manfredi G, Calingasan NY, Szeto HH, Beal MF. J. Neurochem. 2006;98:1141–1148. doi: 10.1111/j.1471-4159.2006.04018.x. [DOI] [PubMed] [Google Scholar]
- 9.Petros AM, Olejniczak ET, Fesik SW. Biochim. Biophys. Acta. 2004;1644:83–94. doi: 10.1016/j.bbamcr.2003.08.012. [DOI] [PubMed] [Google Scholar]
- 10.Chen R, Valencia I, Zhong F, McColl KS, Roderick HL, Bootman MD, Berridge MJ, Conway SJ, Holmes AB, Mignery GA, Velez P, Distelhorst CW. J. Cell Biol. 2004;166:193–203. doi: 10.1083/jcb.200309146. [DOI] [PMC free article] [PubMed] [Google Scholar]
- 11.Hockenbery DM, Oltvai ZN, Yin XM, Milliman CL, Korsmeyer SJ. Cell. 1993;75:241–251. doi: 10.1016/0092-8674(93)80066-n. [DOI] [PubMed] [Google Scholar]
- 12.Kane DJ, Sarafian TA, Anton R, Hahn H, Gralla EB, Valentine JS, Ord T, Bredesen DE. Science. 1993;262:1274–1277. doi: 10.1126/science.8235659. [DOI] [PubMed] [Google Scholar]
- 13.Ellerby LM, Ellerby HM, Park SM, Holleran AL, Murphy AN, Fiskum G, Kane DJ, Testa MP, Kayalar C, Bredesen DE. J. Neurochem. 1996;67:1259–1267. doi: 10.1046/j.1471-4159.1996.67031259.x. [DOI] [PubMed] [Google Scholar]
- 14.Merad-Saidoune M, Boitier E, Nicole A, Marsac C, Martinou JC, Sola B, Sinet PM, Ceballos-Picot I. Exp. Neurol. 1999;158:428–436. doi: 10.1006/exnr.1999.7108. [DOI] [PubMed] [Google Scholar]
- 15.Hochman A, Sternin H, Gorodin S, Korsmeyer S, Ziv I, Melamed E, Offen D. J. Neurochem. 1998;71:741–748. doi: 10.1046/j.1471-4159.1998.71020741.x. [DOI] [PubMed] [Google Scholar]
- 16.Vila M, Jackson-Lewis V, Vukosavic S, Djaldetti R, Liberatore G, Offen D, Korsmeyer SJ, Przedborski S. Proc. Natl. Acad. Sci. U. S. A. 2001;98:2837–2842. doi: 10.1073/pnas.051633998. [DOI] [PMC free article] [PubMed] [Google Scholar]
- 17.Mu X, He J, Anderson DW, Trojanowski JQ, Springer JE. Ann. Neurol. 1996;40:379–386. doi: 10.1002/ana.410400307. [DOI] [PubMed] [Google Scholar]
- 18.Pasinelli P, Belford ME, Lennon N, Bacskai BJ, Hyman BT, Trotti D, Brown RH., Jr. Neuron. 2004;43:19–30. doi: 10.1016/j.neuron.2004.06.021. [DOI] [PubMed] [Google Scholar]
- 19.Yang L, Matthews RT, Schulz JB, Klockgether T, Liao AW, Martinou JC, Penney JB, Jr., Hyman BT, Beal MF. J. Neurosci. 1998;18:8145–8152. doi: 10.1523/JNEUROSCI.18-20-08145.1998. [DOI] [PMC free article] [PubMed] [Google Scholar]
- 20.Vukosavic S, Stefanis L, Jackson-Lewis V, Guegan C, Romero N, Chen C, Dubois-Dauphin M, Przedborski S. J. Neurosci. 2000;20:9119–9125. doi: 10.1523/JNEUROSCI.20-24-09119.2000. [DOI] [PMC free article] [PubMed] [Google Scholar]
- 21.Linseman DA, Phelps RA, Bouchard RJ, Le SS, Laessig TA, McClure ML, Heidenreich KA. J. Neurosci. 2002;22:9287–9297. doi: 10.1523/JNEUROSCI.22-21-09287.2002. [DOI] [PMC free article] [PubMed] [Google Scholar]
- 22.Liang LP, Patel M. Free Radic. Biol. Med. 2004;36:542–554. doi: 10.1016/j.freeradbiomed.2003.11.029. [DOI] [PubMed] [Google Scholar]
- 23.Garcia-Ruiz C, Morales A, Colell A, Rodes J, Yi JR, Kaplowitz N, Fernandez-Checa JC. J. Biol. Chem. 1995;270:15946–15949. doi: 10.1074/jbc.270.27.15946. [DOI] [PubMed] [Google Scholar]
- 24.Wang JL, Liu D, Zhang ZJ, Shan S, Han X, Srinivasula SM, Croce CM, Alnemri ES, Huang Z. Proc. Natl. Acad. Sci. U. S. A. 2000;97:7124–7129. doi: 10.1073/pnas.97.13.7124. [DOI] [PMC free article] [PubMed] [Google Scholar]
- 25.Enyedy IJ, Ling Y, Nacro K, Tomita Y, Wu X, Cao Y, Guo R, Li B, Zhu X, Huang Y, Long YQ, Roller PP, Yang D, Wang S. J. Med. Chem. 2001;44:4313–4324. doi: 10.1021/jm010016f. [DOI] [PubMed] [Google Scholar]
- 26.Yan LJ, Sohal RS. Proc. Natl. Acad. Sci. U. S. A. 1998;95:12896–12901. doi: 10.1073/pnas.95.22.12896. [DOI] [PMC free article] [PubMed] [Google Scholar]
- 27.Lee YJ, Jeong SY, Karbowski M, Smith CL, Youle RJ. Mol. Biol. Cell. 2004;15:5001–5011. doi: 10.1091/mbc.E04-04-0294. [DOI] [PMC free article] [PubMed] [Google Scholar]
- 28.Sasaki E, Okamoto Y, Yoshida K, Okamura H, Shimizu K, Nasu F, Morimoto H, Haneji T. Histochem. Cell Biol. 2003;120:327–333. doi: 10.1007/s00418-003-0572-x. [DOI] [PubMed] [Google Scholar]
- 29.Lash LH. Chem. Biol. Interact. 2006;163:54–67. doi: 10.1016/j.cbi.2006.03.001. [DOI] [PMC free article] [PubMed] [Google Scholar]
- 30.Zhang J, Graham DG, Montine TJ, Ho YS. J. Neuropathol. Exp. Neurol. 2000;59:53–61. doi: 10.1093/jnen/59.1.53. [DOI] [PubMed] [Google Scholar]
- 31.Tabatabaie T, Floyd RA. Arch. Biochem. Biophys. 1994;314:112–119. doi: 10.1006/abbi.1994.1418. [DOI] [PubMed] [Google Scholar]
- 32.Asahi M, Fujii J, Suzuki K, Seo HG, Kuzuya T, Hori M, Tada M, Fujii S, Taniguchi N. J. Biol. Chem. 1995;270:21035–21039. doi: 10.1074/jbc.270.36.21035. [DOI] [PubMed] [Google Scholar]
- 33.Vieira HL, Haouzi D, El Hamel C, Jacotot E, Belzacq AS, Brenner C, Kroemer G. Cell Death Differ. 2000;7:1146–1154. doi: 10.1038/sj.cdd.4400778. [DOI] [PubMed] [Google Scholar]
- 34.Zamzami N, Kroemer G. Nat. Rev. Mol. Cell. Biol. 2001;2:67–71. doi: 10.1038/35048073. [DOI] [PubMed] [Google Scholar]
- 35.Voehringer DW, McConkey DJ, McDonnell TJ, Brisbay S, Meyn RE. Proc. Natl. Acad. Sci. U. S. A. 1998;95:2956–2960. doi: 10.1073/pnas.95.6.2956. [DOI] [PMC free article] [PubMed] [Google Scholar]