Abstract
Hedgehog (HH) signaling is one of the key pathways with major significance for embryogenesis, tumorigenesis, and stem cell maintenance. Glioma-associated oncogene 1 (GLI1) is a transcription factor that acts as the terminal signaling effector but also represents a pathway target gene. Here we report the identification and functional properties of novel GLI1 splice variants generated by skipping exons 2 and 3 and encoding an N-terminal truncated GLI1 protein (GLI1ΔN). Analysis of the GLI1ΔN mRNAs in adult human tissues revealed comparable expression levels to the full-length GLI1 (GLI1FL), whereas in tumor cell lines a generally lower and more variable expression pattern was observed. Furthermore, GLI1ΔN is up-regulated by HH signaling to the same extent as GLI1FL but has a weaker capacity to activate transcription. However, in specific cellular contexts GLI1ΔN may be more potent than GLI1FL in activating endogenous gene expression. Moreover, the dual-specificity tyrosine phosphorylation-regulated kinase 1 (Dyrk1) potentiates the transcriptional activity of GLI1FL but not GLI1ΔN. Interestingly, GLI1FL, in contrast to GLI1ΔN, is localized solely at the nucleus, in line with its increased transcriptional capacity. The negative regulator of the pathway, Suppressor of Fused (SUFU), elicits a cytoplasmic retention of the GLI1 isoforms, which is more pronounced for GLI1FL, as this contains an N-terminal SUFU binding domain. Collectively, our findings reveal that the activation mechanism of the terminal transducer of the pathway, GLI1, is mediated not only by GLI1FL but also by the GLI1ΔN variant.
The post-transcriptional process of alternative splicing is considered to be a pervasive phenomenon in eukaryotic gene expression that increases the diversity of mRNAs and proteins. Genome-wide analysis indicates that at least 75% of human multiexon genes have alternative splice variants (1, 2). Additionally, variations in the splicing pattern of gene products have been related to pathological states including cancer. It is now believed that a minimum of 15% of the point mutations responsible for human genetic diseases are in fact interfering with splicing regulatory events (3, 4). Alternative splice variants have the potential of being used as diagnostic markers and/or therapeutic targets (5).
The Hedgehog (HH)4 signaling pathway was first reported as a major pathway involved in pattern formation during development of Drosophila and embryonic developmental processes in vertebrates. Additionally, abnormal activation of the pathway has been linked to several cancers including basal cell carcinoma, medulloblastoma, rhabdomyosarcoma, lung, prostate, and pancreatic tumors (6–9). Using Drosophila as the model organism significant findings on the mechanism of this pathway have been revealed. Active signal transduction is generally associated with binding of HH ligands to the Patched (PTCH) receptor. This releases the inhibitory effects of PTCH on the signaling molecule Smoothened (SMO), thus initiating a series of molecular events that lead to up-regulation of target genes by the transcription factor, Cubitus interruptus (Ci). However, in mammals gene duplications of many signaling components have resulted in increased complexity. The three HH (Sonic, Desert, and Indian HH), the two PTCH (PTCH1 and PTCH2), and the three Ci (GLI1, GLI2, and GLI3) orthologues have different biological functions and tissue distributions. Interestingly, the negative regulator of the pathway, PTCH1, its paralogue, PTCH2, and the positive regulator, GLI1, are all up-regulated by HH signaling resulting in negative and positive feedback loops (10, 11).
Recent studies indicate that variations in the choice of exons that are included in the mature, spliced mRNA molecules do occur in molecular components of the HH signaling pathway. PTCH1 and PTCH2 variants characterized by alternative first exons, exon skipping/inclusion, and/or alternative terminal exons have been identified (12–15). Interestingly, some but not all of the alternative first exon variants of PTCH1 are up-regulated by HH signaling. These up-regulated variants are the ones with the strongest capacity to inhibit signal transduction and act therefore as the main mediators of the negative feedback (16). The transcription factor GLI2 is also characterized by several splice variants (17–19). Moreover, the significance of such variations in pathway components is corroborated by a genome-wide RNA interference screen that identified a large number of splicing and RNA-regulatory proteins that modulate HH signaling (20).
Glioma-associated oncogene 1 (GLI1) is a transcription factor, which acts as a terminal effector of the HH signaling pathway, in addition to being a target gene (21). GLI1 has been characterized as an oncogene and its overexpression leads to basal cell carcinoma in transgenic mice (22). Moreover, it also acts as a key molecule in the regulation of glioma growth and the self-renewal of cancer stem cells (23, 24). Additionally, Wang and Rothnagel (25) have identified splice variants in the 5′ noncoding region of GLI1. In this report we provide evidence for splicing variations that alter the coding sequence of GLI1. These variants lack an interaction domain with the negative regulator of the pathway, Suppressor of Fused (SUFU) (26), and have unique capacities in activating transcription of target genes.
EXPERIMENTAL PROCEDURES
Tissue Distribution Analysis—PCR primer pairs were designed for both alternative first exons of GLI1. Multiple tissue cDNA panels from BD Biosciences were used with the primers obtained from MWG-Biotech (Ebersberg, Germany). Each reaction consisted of 1× ThermoPol Reaction buffer (New England Biolabs, MA), 0.2 mm of each dNTP, 1.0 μm forward primer for the alternative first exons (5′-GAGCCCAGCGCCCAGACAGA for exon 1 or 5′-CTGTCTCAGGGAACCGTGGGTCTTTGT for exon 1A), 1.0 μm reverse primer for exon 4 (5′-GGCATCCGACAGAGGTGAGATGGAC), 0.05 units/μl of Taq DNA polymerase (New England Biolabs), and 1 ng of cDNA in a total volume of 25 μl. Thirty-five cycles with 20 s at 94 °C, 20 s at 66 °C, and 30 s at 72 °C were performed on a PTC-200 Peltier Thermal Cycler (MJ Research, MA). Amplifications without exogenous cDNA were used in all sets of experiments as a negative control. The PCR products were analyzed on a 4% NuSieve 3:1 agarose gel (FMC BioProducts, ME). All DNA bands were sequence verified by using BigDye Terminator version 1.1 Cycle Sequencing Kits and an ABI prism DNA sequencer (Applied Biosystems, CA).
cDNA Expression Constructs—For construction of the GLI1ΔN expression plasmid, we first performed a PCR amplification using the Expand PCR System (Roche Diagnostics) on cDNA from HEK293 cells, which express this variant, and a GLI1 primer set (5′-CTCAAGCTTGGCACCATGAGCCCAT and 5′-CACAGATTCAGGCTCACGCTTC). The PCR product and a full-length 3′-FLAG-tagged GLI1 expression plasmid in pCMV5 were digested with HindIII and XhoI restriction enzymes and then ligated resulting in a construct with deleted exons 2 and 3. Additionally, SalI- and BglII-digested FLAG-tagged GLI1FL or GLI1ΔN fragments were subcloned into SalI- and BamHI-digested pBABEpuro. The 3′-GFP-tagged GLI1FL and GLI1ΔN constructs were generated from the HindIII and NdeI fragments of FLAG-tagged GLI1FL/GLI1ΔN expression plasmids in pCMV5, the NdeI and NotI fragments of EGFP-tagged GLI1 (27), and the HindIII and NotI fragments of pEGFP-N3 (BD Biosciences). All constructs were verified by sequencing.
The other expression and reporter constructs used have been described in previous reports, the full-length 3′-FLAG-tagged PTCH1 constructs with the alternative first exons, 1, 1B, and 1C (12), 5′-Myc-tagged PTCH1 with the alternative first exon 1B (28), PTCH2 (13), Dyrk1WT, Dyrk1KR (27), and the SUFU expression constructs (29), and the 12xGLIBS-luc (29), PTCH2-luc (13), IL1R2-luc (30), and a mouse Ptch1-1B-luc5 reporter construct.
Cell Culture and Transfection—The human embryonic kidney cell line HEK293 and the murine fibroblast cell lines NIH3T3 and C3H10T1/2 were cultured as described before (12, 13). Human fibroblast cell line hTERT-BJ1 (BD Biosciences), medulloblastoma cell line Daoy, which stably expresses EGFP (EGFP-Daoy), rhabdomyosarcoma cell lines RMS13 and CCA, prostate carcinoma cell lines DU145 and 22Rv1, pancreas carcinoma cell line Panc1, gastric adenocarcinoma cell line AGS, lung adenocarcinoma cell lines H22 and H522, and lung carcinoma cell line A549 were cultured according to the ATCC-LGC Promochem (Middlesex, United Kingdom) and Metalab (Bologna, Italy) recommendations. Expression constructs for the GLI1 splice variants and other pathway components, and the appropriate reporter construct were transfected into cultured cells using FuGENE 6 (Roche Diagnostics). For selection, NIH3T3 and C3H10T1/2 cells were co-transfected with the neomycin-resistant pcDNA3.1His (Invitrogen) and then incubated with Dulbecco's modified Eagle's medium containing 10% fetal bovine serum with 0.6 mg/ml G418 (Sigma).
Reporter Assays—Reporter assays were performed as described previously (12, 13). 12xGLIBS-luc, Ptch-1B-luc, PTCH2-luc, or IL1R2-luc reporter constructs together with the internal control, pRL-SV (Promega) were co-transfected into the appropriate cell lines. Normalized luciferase activity was determined with the dual-luciferase reporter assay system (Promega) using the Luminoskan Ascent (Thermo Electron Corporation, MA) according to the supplier's recommendations. All experiments were analyzed independently three times.
Immunofluorescence Microscopy—Transfected NIH3T3 cells were plated into the Lab-tec chamber slide (Nalge Nunc International, NY). The next day, the cells were rinsed with phosphate-buffered saline and fixed in 4% paraformaldehyde for 15 min and cold methanol for 10 min. Nonspecific binding of the primary antibodies was reduced by first blocking the cells using a solution of phosphate-buffered saline with 5% normal goat serum for 60 min. Then anti-FLAG M2 mouse monoclonal (1:800, Sigma), anti-hemagglutinin rabbit polyclonal (Y-11, 1:200, Santa Cruz Biotechnology, Santa Cruz, CA), anti-SUFU rabbit monoclonal (C81H7, 1:200, Cell Signaling Technology), and anti-PTCH1 rabbit polyclonal (H-267, 1:100, Santa Cruz Biotechnology) in 0.3% Triton X-100/phosphate-buffered saline were added and incubated overnight at 4 °C. After the cells were washed, fluorescent-tagged secondary antibodies, Alexa Fluor 488-goat anti-mouse IgG (1:6000, Invitrogen), and Alexa Fluor 546-goat anti-rabbit IgG (1:6000, Invitrogen) were applied. Three phosphate-buffered saline washes (5 min) were also used after each treatment. The nuclei were stained with 5 μm DRAQ5 (Alexis Biochemicals, Lausen, Switzerland). Slides were mounted in FluorSave reagent (Carbiochem, Darmstadt, Germany). Fluorescence images were collected using a LSM510 (Carl Zeiss, Oberkochen, Germany) confocal laser-scanning microscope with a Plan APOCHROMAT ×63/1.4 OilDIC objective lens.
Western Blotting—48 h after transfection, proteins were extracted by lysis buffer (50 mm Tris (pH 7.4), 1%. SDS, 250 mm NaCl, 2 mm dithiothreitol, 0.5% Nonidet P-40, 1% phosphatase inhibitor mixture 1 (Sigma), and 1% mammalian protease inhibitor mixture (Sigma)). After normalization based on protein concentration measured by the DC Protein assay kit (Bio-Rad), samples were run on a SDS-acrylamide gel. Thereafter, proteins were transferred onto Hybond-ECL nitrocellulose membrane (GE Healthcare). GLI1 isoforms or α/β-tubulin as internal control were determined by the use of anti-GLI1 rabbit polyclonal (Cell Signaling Technology) or α/β-tubulin rabbit polyclonal antibodies (Cell Signaling Technology). Horseradish peroxidase-conjugated anti-rabbit IgG (GE Healthcare) was used as the secondary antibody, followed by detection of these proteins with the Western Lightning Western blot Chemiluminescence Reagent Plus (PerkinElmer Life Sciences).
RNA Isolation and Reverse Transcription—Total RNA was isolated from cultured cells, using the RNA-Bee reagent (Tel-Test Inc., TX) or the RNeasy kit (Qiagen GmbH, Hilden, Germany) following the manufacturer's protocol. For reverse transcription, 5 μg of total RNA, 4 μl of a 2.5 mm dNTP mixture (2.5 mm each), and 0.5 ng of oligo(dT)18(A/C/G)(A/C/G/T) primer in a total volume of 12 μl were denatured at 65 °C for 5 min. After cooling the mixture on ice, 4 μl of 5× RT buffer, 2 μl of 0.1m dithiothreitol, and 1 μl of ribonuclease inhibitor (New England Biolabs) were added. Following incubation at 45 °C for 2 min, 1 μl of SuperScript II RT (Invitrogen) or water (negative control) was added. Then the mixture was incubated at 45 °C for 90 min. The reaction was stopped by heat inactivation at 75 °C for 15 min.
Real-time RT-PCR—Relative levels of the GLI1 variant RNAs or transcripts of the pathway target genes Gli1, Ptch1, Ptch2, and Sfrp were quantified by real-time RT-PCR using SYBR Green. Duplicate samples of each PCR mixture, each containing 4.7 μl of POWER SYBR Green PCR master mixture (Applied Biosystems), 0.3 μl of a 10 pmol/μl of primer mixture, 0.3–1.0 μl of cDNA, and water to a total volume of 10 μl were transferred into a 96-well plate on an ABI 7500 Fast Real Time PCR System (Applied Biosystems). The samples were initially incubated at 95 °C for 3 min, followed by 45 cycles with 95 °C for 15 s, 65 °C for 15 s, and 72 °C for 30 s. Dissociation curves were generated after each PCR run to ensure that a single, specific product was amplified. The results were analyzed with the comparative Cycle threshold (Ct) method. For normalization, we used the expression level of glyceraldehyde-3-phosphate dehydrogenase (GAPDH), β-actin (ACTB), hypoxanthine phosphoribosyltransferase 1, ribosomal protein, large, P0 (RPLP0), and TATA box-binding protein for the human samples and Acidic ribosomal protein (Arp), Hprt1, and Gapdh for the mouse samples. From the results obtained the two housekeeping genes with the most scattered values were eliminated and then all data were normalized by the average Ct of the remaining housekeeping genes. Samples that were not reverse transcribed were used as negative controls. The PCR primers are shown in supplemental Table S1. The primer specificity was verified by BLAST searches and analysis of the PCR products by agarose gel electrophoresis followed by sequence determination.
Polysome Analysis—GLI1 transcripts associated with polysomes were fractionated as described (31). In brief, cytoplasmic extracts from 1 × 10⁷ RMS13 cells lysed in the presence of 50 μg/ml of cycloheximide or 25 mm EDTA were layered over a 15–40% sucrose (w/v) linear gradient and centrifuged in a SW55 Ti rotor (Beckman Coulter) for 120 min at 45,000 × g at 4 °C. Twenty fractions were collected and the RNA was isolated using the RNA-Bee reagent and LiCl precipitation. Transcript levels were measured by real-time RT-PCR as described above but with the use of random primer 6, 5′(dN6) (New England BioLabs). The percentage of individual transcripts in each gradient fraction was calculated from the Ct values. The isolated RNA from each fraction was also analyzed using denaturing 1.2% formaldehyde-agarose gel electrophoresis.
Statistical Analysis—The statistical significance was calculated using the PRISM software (GraphPad Software, CA).
RESULTS
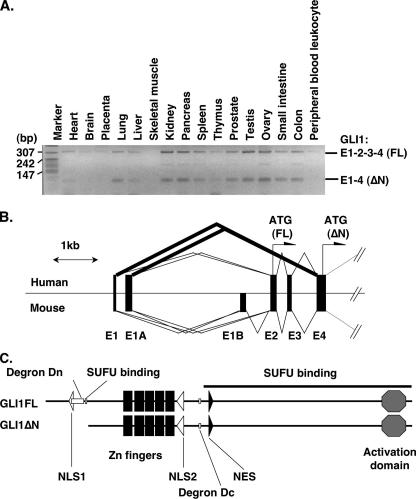
Identification of Novel GLI1 Splice Variants—We have performed in silico screening for novel splice variants in components of the HH signaling pathway, as described in a previous report (16). In a series of analyses, we found a human EST sequence (BX100365) of GLI1 with an uncharacterized splicing event. This sequence juxtaposed exon 1A directly to exon 4. Alternative splicing of GLI1 at the noncoding first exons 1 and 1A has already been reported by Wang et al. (25). Therefore, to analyze in detail the splicing pattern of GLI1, we performed RT-PCR on human and mouse cDNA panels with forward primers within exons 1 or 1A and a reverse primer within exon 4. The results showed that skipping of exons 2 and 3, with exon 1 spliced directly to exon 4, occurs in several human tissues, including lung, kidney, pancreas, and ovary (Fig. 1A). Moreover, the expression ratio of the two mRNAs was ∼1:1 and this was confirmed by real-time RT-PCR (data not shown). Additionally, similar results, with exon 1A and exon 4 spliced together, were also obtained (data not shown). Unexpectedly, these splicing events do not occur in the mouse (Fig. 1B, data not shown).
FIGURE 1.
Identification of novel GLI1 splice variants. A, RT-PCR analysis using exon 1 forward and exon 4 reverse primers for GLI1 expression in human tissues. E1–2–3–4 (FL) represents the full-length GLI1, whereas E1–4 (ΔN) the variant with skipped exons 2 and 3. B, comparison of the genomic structure between human andmouseGLI1in the region from exon 1 to 4. Thicklines show the novel splicing events identified in this report. The position for the initiator methionine codons for the full-length and the N-terminal deleted variants is indicated. Note the presence in the mouse of an additional first exon, E1B, which is inactivated in the human due to an Alu insertion. C, predicted protein domains for full-length GLI1 (GLI1FL) and the variant with the N-terminal deletion (GLI1ΔN). White, gray, and black boxes indicate the Degron, SUFU binding, and zinc finger domains, respectively. The bold line indicates the additional SUFU binding region. Octagons represent the activation domain. White and black triangles show the position of the nuclear localization signals (NLS) and the nuclear export signal (NES).
The deduced protein structure of both exon 1 to exon 4 and exon 1A to exon 4 splice variants lacked 128 amino acids in the N-terminal end and thus the encoded variant is termed GLI1ΔN (Fig. 1C). A SUFU binding sequence has already been reported to be present in the deleted region (26), and its absence is anticipated to influence the functional properties of the protein.
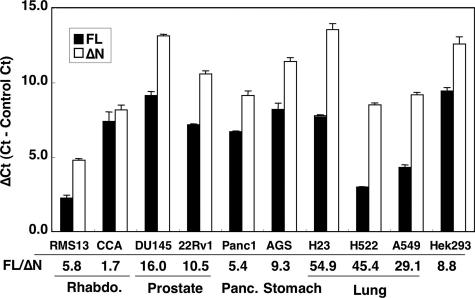
GLI1ΔN Expression in Tumor Cell Lines—We also examined the GLI1 expression levels in nine human tumor cell lines and, as a control, in the human embryonic kidney cell line 293 (HEK293) by real-time RT-PCR (Fig. 2). Expression of both the full-length GLI1, GLI1FL, and GLI1ΔN was observed in all cells analyzed, with the ratio of GLI1FL to GLI1ΔN being about 9 times in HEK293 cells. Moreover, in the RMS13 and CCA cell lines that originate from rhabdomyosarcoma and in the Panc1 cell line originating from pancreatic tumor this expression ratio was less than 6 times. On the contrary, in the H23, H522, and A549 cell lines that originate from lung carcinoma the ratio reached and exceeded the value of 30. At this point it is difficult to determine whether these altered ratios of the GLI1 isoform expression may be relevant for HH signaling-dependent tumorigenesis. However, it is of interest to note that the relatively high GLI1 expression in the RMS13 cell line is also significantly higher than the levels observed in the human tissues analyzed before.
FIGURE 2.
Expression of GLI1FL and GLI1ΔN in tumor cell lines. GLI1FL and GLI1ΔN were quantified by real-time RT-PCR using SYBR Green. Data are presented as relative Ct (Cycle threshold, the cycle number at which the fluorescent emission reaches an arbitrary threshold) values (ΔCt), that is the Ct of GLI1FL or GLI1ΔN minus the average Ct of the housekeeping genes RPLP0, GAPDH, and TATA box-binding protein in each sample. The expression ratio of GLI1FL to GLI1ΔN is shown as FL/ΔN. The error bars indicate the standard deviation. The differences between the GLI1FL and GLI1ΔN values were statistically significant in all but the CCA cell line (p < 0.001, analysis of variance, Bonferroni test).
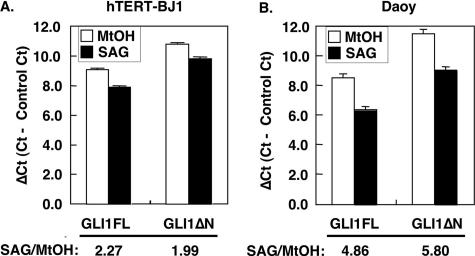
HH Signaling-dependent Transcription of GLI1ΔN—GLI1 is known to be a target gene of HH signaling and is frequently used as a marker of pathway activation. To study the HH signal dependence of GLI1ΔN, we compared its mRNA levels to those of GLI1FL in the human BJ1 fibroblast and EGFP-Daoy medulloblastoma cell lines following treatment with the SMO agonist SAG (32, 33) (Fig. 3). Real-time RT-PCR analysis revealed that GLI1ΔN is up-regulated by SAG to approximately the same extent as GLI1FL. Consequently, transcriptional activation is not altering the GLI1FL/GLI1ΔN expression ratio in these cell lines, even though the phenomena of signaling regulation of splicing patterns are well documented (34). Thus, GLI1ΔNis also a target of the HH pathway and therefore may be considered to represent a novel diagnostic marker for signaling activation.
FIGURE 3.
Up-regulation of GLI1 variants by HH signaling activation. hTERT-BJ1 human fibroblasts (A) or Daoy human medulloblastoma cells stably expressing EGFP (B) were incubated with 100 nm SAG followed by RNA isolation and reverse transcription. RT-PCR data using SYBR Green are presented as relative Ct values (ΔCt), which is the Ct of GLI1FL or GLI1ΔN minus the average Ct of the housekeeping genes RPLP0, hypoxanthine phosphoribosyltransferase 1, and GAPDH, or GAPDH, TATA box-binding protein, and ACTB for the hTERT-BJ1 and EGFP-Daoy cells, respectively. The -fold increase of the GLI1 variants is shown as SAG/MtOH. The error bars indicate the standard deviation. The differences between the MtOH and SAG values were statistically significant in both cell lines (p < 0.01, analysis of variance, Bonferroni test).
We also attempted to detect endogenous expression of the GLI1 isoforms by Western blotting. GLI1FL protein was detected in the RMS13 cell line but not in the SAG-treated EGFP-Daoy cells, in line with their relative mRNA levels. GLI1ΔN could not be detected even in the RMS13 cell lines, as its mRNA levels are comparable with the ones of GLI1FL in the SAG-treated EGFP-Daoy cells (supplemental Fig. S1).
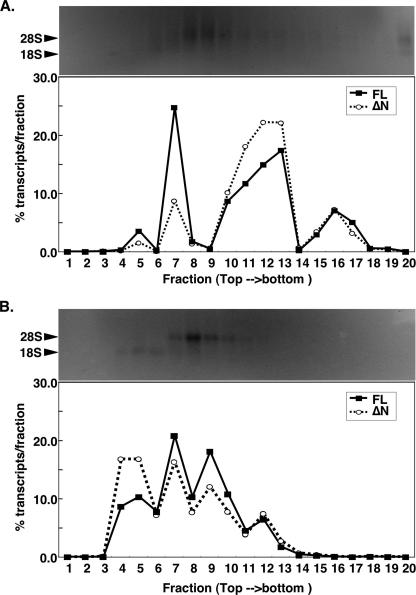
Polysome Profile of GLI1ΔN—The difficulty of detecting the GLI1ΔN protein by Western blotting prompted us to examine whether the GLI1ΔN mRNA is associated with polyribosomes, as this would imply translatability. To this end cytoplasmic extracts of RMS13 cells were subjected to sucrose density gradient centrifugation to separate the polysomal from the ribosome-free mRNA fractions. In the presence of cycloheximide, which prevents ribosome dissociation from the translating mRNA (31), the GLI1ΔN mRNA was mostly found in the heavier fractions containing the polyribosomes, as was the GLI1FL mRNA (Fig. 4A). In the presence of EDTA, which disrupts ribosome-mRNA associations (31), there was a shift of both the GLI1ΔN and GLI1FL mRNAs toward lighter fractions that contain ribosome-free mRNA (Fig. 4B). Thus, the polysome profiles of the GLI1ΔN and GLI1FL mRNAs are quite similar, and therefore it is very likely that the GLI1ΔN mRNA is also translated, even though its low expression prohibits detection of the protein by Western blotting.
FIGURE 4.
Association of GLI1ΔN with polysomes. Cytoplasmic extracts from 1 × 10⁷ RMS13 cells lysed in the presence of either cycloheximide (A) or EDTA (B) were subjected to a 15–40% sucrose density gradient centrifugation. Twenty fractions were collected (fraction 1, top/light; fraction 20, bottom/heavy). The percentage of GLI1FL (filled squares) or GLI1ΔN(empty circles) transcripts per fraction, determined by real-time RT-PCR, are shown (lower panels). The isolated RNAs from the individual fractions were also subjected to denaturing 1.2% formaldehyde-agarose gel electrophoresis followed by staining with ethidium bromide (upper panels).
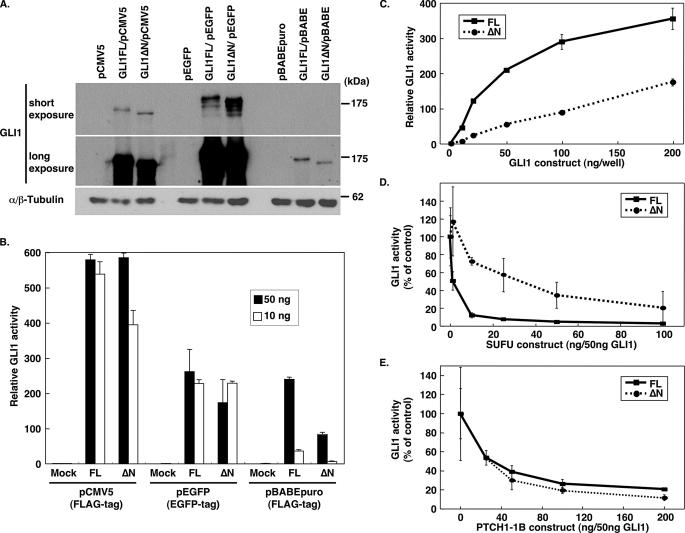
Biochemical Characterization of GLI1ΔN—To elucidate the functional role of GLI1ΔN, this as well as GLI1FL were cloned into the three mammalian expression vectors, pCMV5, pBABEpuro, and pEGFP. Although there were differences in protein expression depending on the vector used, there was a similar expression of both GLI1FL and GLI1ΔN with each vector (Fig. 5A). On the other hand, the transcriptional activity, as determined by the 12xGLIBS-luc reporter, was higher for GLI1FL than GLI1ΔN in the FLAG-tagged pCMV5 and pBABEpuro constructs, regardless of the transfected cell lines (Fig. 5, B and C, and supplemental Fig. S2). However, in the pEGFP constructs the activity of GLI1FL and GLI1ΔN was comparable, possibly indicating that the bulky EGFP tag at the C terminus may interfere with the GLI1 activity. It therefore appears that in the cellular assays used, GLI1ΔN has no increased transcriptional capacity relative to GLI1FL, even though it lacks one binding domain for the negative regulator of the pathway, SUFU.
FIGURE 5.
Biochemical characterization of GLI1ΔN. A, protein expression following transfection of FLAG-tagged pCMV5 and pBABEpuro or EGFP-tagged pEGFP constructs of GLI1ΔN and GLI1FL into HEK293 cells. Western blotting was performed using an anti-GLI1 antibody. α,β-Tubulin expression is also shown as a loading control. B, the luciferase activity of the GLI1ΔN and GLI1FL constructs in HEK293 cells. Ten (white bars) or 50 ng (black bars) of the GLI1 expression constructs were transfected with 200 ng of 12xGLIBS-luc and 50 ng of pRL-SV reporter plasmids. The error bars indicate the standard deviation. The differences between the GLI1FL and GLI1ΔN values were statistically significant with the pBABEpuro constructs and with 10 ng of the pCMV5 constructs (p < 0.001, analysis of variance, Bonferroni test). C, dose-dependent GLI1 activity in NIH3T3 cells. Different amounts of FLAG-tagged pCMV5 GLI1 expression constructs were co-transfected with 200 ng of 12xGLIBS-luc and 50 ng of pRL-SV reporter plasmids. The error bars indicate the standard deviation. The differences between the GLI1FL and GLI1ΔN values were statistically significant (p < 0.01, analysis of variance, Bonferroni test). D, inhibition of GLI1 activity by SUFU. NIH3T3 cells were co-transfected with 50 ng of the FLAG-tagged pCMV5 GLI1 constructs and 1–100 ng of the SUFU expression construct, and the luciferase activity of the 12xGLIBS-luc reporter was measured. The control values represent GLI1 activities without SUFU. The error bars indicate the standard deviation. The differences between the GLI1FL and GLI1ΔN values were statistically significant only when 10 or 25 ng of the SUFU construct were used (p < 0.01, analysis of variance, Bonferroni test). E, inhibition of GLI1 activity by PTCH1-1B. NIH3T3 cells were co-transfected with 50 ng of the FLAG-tagged pCMV5 GLI1 constructs and 20–200 ng of the PTCH1-1B expression construct, and the luciferase activity of the 12xGLIBS-luc reporter was measured. The control values represent GLI1 activities without PTCH1-1B. The error bars indicate the standard deviation. The differences between the GLI1FL and GLI1ΔN values were not statistically significant (analysis of variance, Bonferroni test).
Inhibition of GLI1 activity by SUFU (26, 35), PTCH1 (16, 36), and the small molecule Gli antagonists, GANT58 and GANT61 (37), has already been reported. Therefore we analyzed the sensitivity of GLI1ΔN to these inhibitors. As expected, GLI1ΔN, which lacks the N-terminal SUFU binding domain, had a weaker repression by SUFU in comparison to GLI1FL (Fig. 5D). On the other hand, PTCH1 could inhibit GLI1ΔN activity to the same extent as GLI1FL, and this was not dependent on the PTCH1 splice variant used (Fig. 5E and supplemental Fig. S3). Furthermore, we could not measure a significant difference in repression by GANT58 and GANT61, between GLI1ΔN and GLI1FL.6
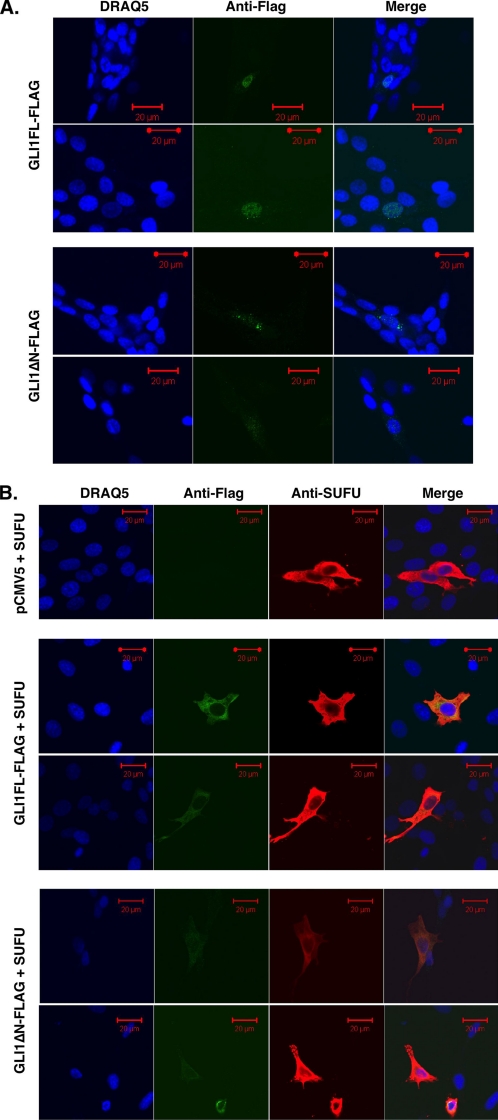
Subcellular Localization of GLI1ΔN—Kogerman et al. (29) showed that the subcellular localization of GLI1 is regulated by SUFU, resulting in sequestration of GLI1 to the cytoplasm. To clarify the effect of the lack of the N-terminal region and the SUFU binding domain of GLI1 on localization, we transfected the FLAG-tagged GLI1ΔN and GLI1FL constructs into NIH3T3 cells (Fig. 6A). GLI1FL localized in the nucleus, but GLI1ΔN had a broader signal in both the nucleus and cytoplasm with a punctiform pattern, in line with its reduced transcriptional capacity. To further examine the relation between GLI1 localization and activity, we co-transfected the GLI1 constructs and SUFU into the NIH3T3 cells (Fig. 6B). Both GLI1FL and GLI1ΔN accumulated in the cytoplasm, indicating a dramatic influence of SUFU on GLI1FL localization, which parallels its strong inhibitory effects on the transcriptional activity. PTCH1 co-transfection also resulted in cytoplasmic accumulation of both GLI1 isoforms, in line with the PTCH1 negative influence on GLI1 activity (supplemental Fig. S4).
FIGURE 6.
Subcellular localization of GLI1ΔN. The FLAG-tagged GLI1ΔN and GLI1FL isoforms (green signal) and the nuclei stained with the marker DRAQ5 (blue signal) were visualized by immunofluorescence microscopy. The majority of the green signal positive cells showed a similar distribution pattern in each case. A, differential localization of the GLI1 variants. NIH3T3 cells were transfected with 100 ng of the constructs. The red scale bars represent 20 μm. B, cytoplasmic sequestration of GLI1ΔN and GLI1FL by SUFU. NIH3T3 cells were co-transfected with 200 ng of the SUFU (red signal) and 100 ng of the GLI1 constructs or a pCMV5 empty vector. The red scale bars represent 20 μm.
Interestingly, the GLI1FL and GLI1ΔN constructs with the EGFP tags, which have a comparable transcriptional activity (Fig. 2B), also have a comparable localization pattern, with presence mainly in the cytoplasm (supplemental Fig. S5). Thus, inclusion of the bulky EGFP tag apparently alters the nuclear-only distribution of the GLI1FL isoform. Consequently, the GLI1 transcriptional activity is positively influenced by nuclear accumulation, with SUFU having a strong capacity for cytoplasmic sequestration of the GLI1FL isoform.
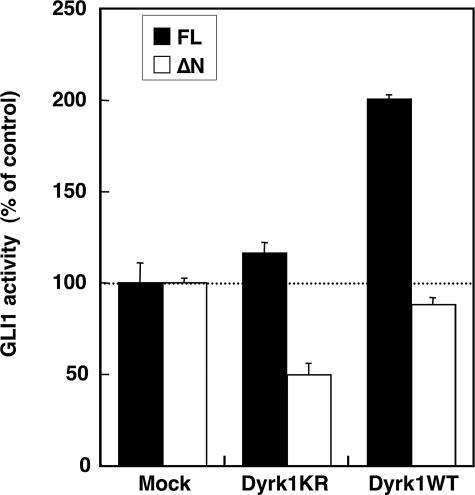
Regulation of GLI1ΔN by the Dual-specificity Tyrosine Phosphorylation-regulated Kinase 1 (Dyrk1)—Mao et al. (27) showed that GLI1 localization and activity are also regulated by the Dyrk1 kinase. To examine the role of Dyrk1 on GLI1ΔN, we first co-transfected the FLAG-tagged pCMV5 GLI1 constructs with either wild type Dyrk1 (Dyrk1WT) or a kinase-null mutant (Dyrk1KR) (27) in NIH3T3 cells, and compared the GLI1 activity. Surprisingly, Dyrk1WT enhanced the activity of GLI1FL, but not of GLI1ΔN (Fig. 7). Moreover, Dyrk1KR repressed GLI1ΔN, but not GLI1FL. This implies that the two isoforms of GLI1 respond differently to Dyrk1 kinase signaling. When the subcellular localization of the GLI1 isoforms was examined in the presence or absence of Dyrk1WT or Dyrk1KR, no major changes were observed (supplemental Fig. S6). However, when instead of the FLAG-tagged the EGFP-tagged GLI1FL construct was used, which shows a mainly cytoplasmic localization, Dyrk1WT co-transfection resulted in a nucleus shift, as observed by Mao et al. (27) (supplemental Fig. S7). These results clearly indicate that the Dyrk1 kinase differentially regulates the activity of GLI1FL and GLI1ΔN, but without significant changes in subcellular localization that are detected at the resolution of the immunofluorescence assay used.
FIGURE 7.
Regulation of GLI1ΔN by Dyrk1. Fifty ng of the FLAG-tagged pCMV5 GLI1 constructs were co-transfected with 100 ng of kinase-null (Dyrk1KR) or wild type Dyrk1 (Dyrk1WT) expression constructs in NIH3T3 cells. The luciferase activity of the 12xGLIBS-luc reporter was measured. The error bars indicate the standard deviation. The differences between the GLI1FL and GLI1ΔN values were statistically significant (p < 0.001, analysis of variance, Bonferroni test).
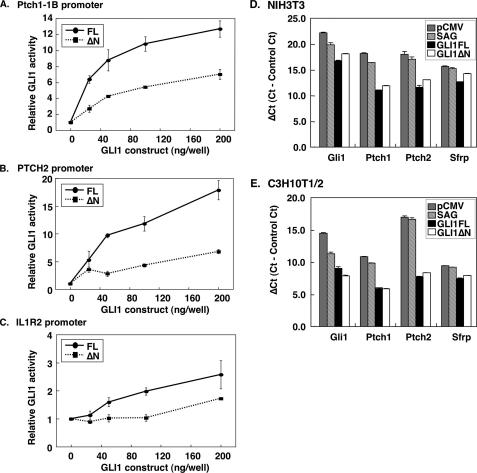
Transcriptional Activity of GLI1ΔN on Target Genes—GLI1 is a transcription factor, which acts as the terminal effector of HH signaling. Targets of the pathway include the well characterized PTCH1, PTCH2, IL1R2, and SFRP genes (13, 30, 38, 39). To evaluate the role of the GLI1 isoforms as effective transducers of HH signaling, we measured the transcriptional activity of GLI1ΔN and GLI1FL, not only with the 12xGLI1BS-luc reporter, but also with Ptch1 exon 1B, PTCH2, and IL1R2 promoter constructs cloned upstream of the luciferase gene (Fig. 8, A–C). GLI1ΔN up-regulated all reporter constructs in NIH3T3 cells, but the activation was not as strong as that seen with GLI1FL. To examine this observation in a more natural context, the transcriptional response of endogenous genes was analyzed by real-time RT-PCR. Overexpression of GLI1FL or GLI1ΔNin NIH3T3 cells up-regulated Gli1, Ptch1, and Ptch2 and to a lesser extent Sfrp transcription, with the GLI1FL effects being more pronounced than GLI1ΔN, as seen with the reporter constructs (Fig. 8D). However, in C3H10T1/2 cells, there was an increase in the relative activation capacity of GLI1ΔN, which in the case of the Gli1 gene was higher than GLI1FL (Fig. 8E). These results suggest that GLI1FL and GLI1ΔN may up-regulate the same target genes but their activities are independently regulated.
FIGURE 8.
Transcriptional activity of GLI1ΔN on target genes. The FLAG-tagged pCMV5 GLI1 constructs were co-transfected with Ptch1-1B-luc (A), PTCH2-luc (B), or IL1R2-luc (C) reporter constructs in NIH3T3 cells. pRL-SV was also co-transfected as an internal control. The error bars indicate the standard deviation. The differences between the GLI1FL and GLI1ΔN values were statistically significant except when 25 ng of GLI1 construct was used in panels B and C (p < 0.01, analysis of variance, Bonferroni test). D and E, up-regulation of endogenous gene expression by GLI1ΔN and GLI1FL. The FLAG-tagged pCMV5 GLI1 constructs or the empty pCMV5 vector were co-transfected with pcDNA3.1His into NIH3T3 or C3H10T1/2 cells. One day after transfection, the culture medium was changed to Dulbecco's modified Eagle's medium including 10% fetal bovine serum and 0.6 mg/ml G418 (GLI1FL and GLI1ΔN), with or without the addition of 100 nm SAG (pCMV5), and then the cells were incubated for 2 days. Expression of the Ptch1, Ptch2, Gli1, and Sfrp genes was measured by real-time RT-PCR using SYBR Green. Data are presented as relative Ct values (ΔCt), which is the Ct of the target genes minus the Ct of the housekeeping gene Arp. The error bars indicate the standard deviation. The differences between the ΔCt values were statistically significant except when the Ptch1 and Sfrp expression was analyzed following GLI1FL or GLI1ΔN transfection (panel E), and Sfrp (both panels) and Ptch2 (panel E) expression was analyzed following pCMV transfection or SAG treatment (p < 0.01, analysis of variance, Bonferroni test).
DISCUSSION
In this report, we identified novel human GLI1 splice variants that skip exons 2 and 3, resulting in the production of an N-terminal truncated protein isoform, GLI1ΔN. Similarly to the full-length GLI1, GLI1FL, the generation of GLI1ΔNis also dependent on HH signaling (Fig. 3). Both GLI1 isoforms can act as transcription factors, with GLI1FL being generally more potent than GLI1ΔN (Figs. 5, B and C, 8, A–D, and supplemental Fig. S2). However, in C3H10T1/2 cells the activation capacity of GLI1ΔN on endogenous genes may be more pronounced than that of GLI1FL (Fig. 8E). Moreover, GLI1ΔN and GLI1FL are under distinct cellular controls, as exemplified by the differential effects of SUFU and the Dyrk1 kinase on their activities (Figs. 5D and 7). Interestingly, GLI1FL is found to be localized in the nucleus, in contrast to previous reports that predominantly detected it in the cytoplasm. This may be due, at least in part, to the fact that a bulky EGFP tag was used in these studies (27, 29). Additionally, the generally higher GLI1FL activity relative to GLI1ΔN correlates with nuclear localization, and the GLI1 inhibitory effects of SUFU and PTCH1 with cytoplasmic sequestration. Finally, the stronger SUFU inhibition and cytoplasmic shifts of GLI1FL versus GLI1ΔN are apparently due to the lack of a SUFU binding domain in the latter isoform.
GLI1 and its paralogue GLI2 recognize and bind to the same DNA sequences and activate transcription (40, 41). However, although the target genes of GLI1 and GLI2 do overlap, there is not a complete identity (42). Similarly, although GLI1ΔN contains the same DNA binding domain as GLI1FL, each isoform appears to be characterized by a partially independent target gene activation mechanism (Fig. 8). This finding strengthens the notion that alternative splicing may be a biological process, in addition to gene duplication, that is able to increase the functional diversity of gene products. In fact, in the Wnt signaling pathway, which antagonizes HH signaling, there are four transcription factors, the TCF/LEF paralogues, capable of generating a number of splice variants, and this diversity is functionally important for mediating tissue- and stage-specific Wnt regulation (43). Thus in the HH and Wnt developmental pathways, splicing variations in the terminal transcription factors may represent an effective means for achieving a highly regulated biological cross-talk.
SAG treatment elicited a nearly equal increase of the GLI1ΔN transcripts as of GLI1FL (Fig. 3). On the other hand the expression ratios of the two GLI1 isoforms varied greatly in the tumor cell lines analyzed (Fig. 2). The GLI1FL/GLI1ΔN ratio tends to be high in cells derived from lung carcinoma, but is significantly lower in cells from rhabdomyosarcoma. This suggests that the expression of the GLI1 isoforms may also be actively controlled by factors other than the ones implicated in HH signaling.
In similarity with the PTCH1-1Ckid mRNA variant characterized previously (16), the GLI1ΔN splice form was detected in the human but not in the mouse. Recent reports indicate that only 10–20% of cassette-type alternative splicing events are conserved between human and mouse (3). It is not yet clear what the implications of these differences in splicing variations among species may be. However, splice variants have the potential to encode a larger variety of functionally different proteins than gene paralogues. It may therefore be important to pay attention to a possible influence of alternative transcription and alternative splicing in the context of developing mouse models for human diseases.
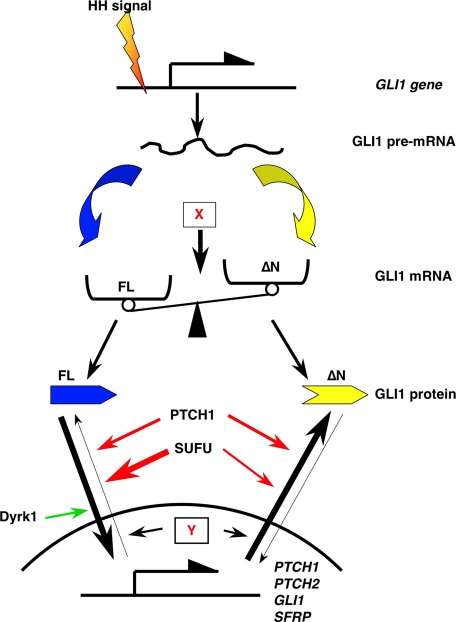
In summary our findings reveal an increased complexity in the activation process of the terminal effector of HH signaling, GLI1, and are summarized in the model of Fig. 9. GLI1ΔN and GLI1FL transcripts are up-regulated not only by HH signaling but also additional factors play a role in balancing their expression levels (Figs. 2 and 3). Moreover, the transcriptional capacity of GLI1ΔN and GLI1FL is differentially regulated by SUFU and the Dyrk1 kinase (Figs. 5D and 7). Additionally, other factors (Fig. 8) are also likely to influence the gene activation properties of the two GLI1 isoforms.
FIGURE 9.
Model for regulation of expression and transcriptional activity of the GLI1 variants. Hedgehog signaling increases the transcription of both GLI1FL (blue) and GLI1ΔN(yellow), with additional factors, exemplified by X, having a role in balancing their expression levels. The subcellular localization and the capacity of the two isoforms to regulate transcription are controlled by SUFU, PTCH1, and the Dyrk1 kinase, with other factors, exemplified by Y, also modulating the specificity of their transcriptional activities. Red arrows indicate inhibitory effects on the GLI1 nuclear accumulation and/or the GLI1 activity, whereas a stimulatory effect is shown by the green arrow. The long black arrows indicate transport to or from the nucleus. The line width of the red and the long black arrows represents the relative intensity of these effects.
Supplementary Material
Acknowledgments
We thank Drs. Fritz Aberger (University of Salzburg), Priit Kogerman (Tallinn Technical University), and Marie Fiaschi, Fahimeh Rahnama, and Stephan Teglund (Karolinska Institute) for reporter and expression plasmids. We are grateful to B. Lindqvist, C. Finta, V. Jaks, and Å. Bergström for helpful discussions and technical support.
Author's Choice—Final version full access.
This work was supported in part by the Swedish Cancer Fund, the Swedish Research Council, and the Magnus Bergvalls and Anders Otto Swärds/Ulrika Eklunds foundations. The costs of publication of this article were defrayed in part by the payment of page charges. This article must therefore be hereby marked “advertisement” in accordance with 18 U.S.C. Section 1734 solely to indicate this fact.
The on-line version of this article (available at http://www.jbc.org) contains supplemental Table S1 and Figs. S1–S7.
The nucleotide sequence(s) reported in this paper has been submitted to the GenBank™/EBI Data Bank with accession number(s) AB239136 (GLI1 E1–4) and AB239328 (GLI1 E1A-4).
Footnotes
The abbreviations used are: HH, hedgehog; GLI1, Glioma-associated oncogene 1; GLI1FL, full-length GLI1; GLI1ΔN, GLI1 with skipped exons 2 and 3; SMO, Smoothened; SUFU, Suppressor of Fused; PTCH, Patched; Dyrk1, dual-specificity tyrosine phosphorylation-regulated kinase 1; SAG, SMO agonist; GANT, Gli antagonist; GLIBS, GLI-binding site; GAPDH, glyceraldehyde-3-phosphate dehydrogenase; RPLP0, ribosomal protein large P0; Arp, acidic ribosomal protein; IL1R2, interleukin 1 receptor, type II; Sfrp, secreted frizzled-related protein; EGFP, enhanced green fluorescent protein; RT, reverse transcriptase.
T. Shimokawa, U. Tostar, M. Lauth, R. Palaniswamy, M. Kasper, R. Toftgård, and P. G. Zaphiropoulos, unpublished data.
M. Lauth, unpublished data.
References
- 1.Johnson, J. M., Castle, J., Garrett-Engele, P., Kan, Z., Loerch, P. M., Armour, C. D., Santos, R., Schadt, E. E., Stoughton, R., and Shoemaker, D. D. (2003) Science 302 2141–2144 [DOI] [PubMed] [Google Scholar]
- 2.Kampa, D., Cheng, J., Kapranov, P., Yamanaka, M., Brubaker, S., Cawley, S., Drenkow, J., Piccolboni, A., Bekiranov, S., Helt, G., Tammana, H., and Gingeras, T. R. (2004) Genome Res. 14 331–342 [DOI] [PMC free article] [PubMed] [Google Scholar]
- 3.Blencowe, B. J. (2006) Cell 126 37–47 [DOI] [PubMed] [Google Scholar]
- 4.Wang, G. S., and Cooper, T. A. (2007) Nat. Rev. Genet. 8 749–761 [DOI] [PubMed] [Google Scholar]
- 5.Pajares, M. J., Ezponda, T., Catena, R., Calvo, A., Pio, R., and Montuenga, L. M. (2007) Lancet Oncol. 8 349–357 [DOI] [PubMed] [Google Scholar]
- 6.Hahn, H., Wicking, C., Zaphiropoulos, P. G., Gailani, M. R., Shanley, S., Chidambaram, A., Vorechovsky, I., Holmberg, E., Unden, A. B., Gillies, S., Negus, K., Smyth, I., Pressman, C., Leffell, D. J., Gerrard, B., Goldstein, A. M., Dean, M., Toftgård, R., Chenevix-Trench, G., Wainwright, B., and Bale, A. E. (1996) Cell 85 841–851 [DOI] [PubMed] [Google Scholar]
- 7.Berman, D. M., Karhadkar, S. S., Maitra, A., Montes De Oca, R., Gerstenblith, M. R., Briggs, K., Parker, A. R., Shimada, Y., Eshleman, J. R., Watkins, D. N., and Beachy, P. A. (2003) Nature 425 846–851 [DOI] [PubMed] [Google Scholar]
- 8.Sanchez, P., Hernandez, A. M., Stecca, B., Kahler, A. J., DeGueme, A. M., Barrett, A., Beyna, M., Datta, M. W., Datta, S., and Ruiz i Altaba, A. (2004) Proc. Natl. Acad. Sci. U. S. A. 101 12561–12566 [DOI] [PMC free article] [PubMed] [Google Scholar]
- 9.Yuan, Z., Goetz, J. A., Singh, S., Ogden, S. K., Petty, W. J., Black, C. C., Memoli, V. A., Dmitrovsky, E., and Robbins, D. J. (2007) Oncogene 26 1046–1055 [DOI] [PubMed] [Google Scholar]
- 10.Ingham, P. W., and Placzek, M. (2006) Nat. Rev. Genet. 7 841–850 [DOI] [PubMed] [Google Scholar]
- 11.Wang, Y., McMahon, A. P., and Allen, B. L. (2007) Curr. Opin. Cell Biol. 19 159–165 [DOI] [PubMed] [Google Scholar]
- 12.Shimokawa, T., Rahnama, F., and Zaphiropoulos, P. G. (2004) FEBS Lett. 578 157–162 [DOI] [PubMed] [Google Scholar]
- 13.Rahnama, F., Toftgård, R., and Zaphiropoulos, P. G. (2004) Biochem. J. 378 325–334 [DOI] [PMC free article] [PubMed] [Google Scholar]
- 14.Nagao, K., Toyoda, M., Takeuchi-Inoue, K., Fujii, K., Yamada, M., and Miyashita, T. (2005) Genomics 85 462–471 [DOI] [PubMed] [Google Scholar]
- 15.Uchikawa, H., Toyoda, M., Nagao, K., Miyauchi, H., Nishikawa, R., Fujii, K., Kohno, Y., Yamada, M., and Miyashita, T. (2006) Biochem. Biophys. Res. Commun. 349 277–283 [DOI] [PubMed] [Google Scholar]
- 16.Shimokawa, T., Svärd, J., Heby-Henricson, K., Teglund, S., Toftgård, R., and Zaphiropoulos, P. G. (2007) Oncogene 26 4889–4896 [DOI] [PubMed] [Google Scholar]
- 17.Regl, G., Neill, G. W., Eichberger, T., Kasper, M., Ikram, M. S., Koller, J., Hintner, H., Quinn, A. G., Frischauf, A. M., and Aberger, F. (2002) Oncogene 21 5529–5539 [DOI] [PubMed] [Google Scholar]
- 18.Roessler, E., Ermilov, A. N., Grange, D. K., Wang, A., Grachtchouk, M., Dlugosz, A. A., and Muenke, M. (2005) Hum. Mol. Genet. 14 2181–2188 [DOI] [PubMed] [Google Scholar]
- 19.Speek, M., Njunkova, O., Pata, I., Valdre, E., and Kogerman, P. (2006) BMC Mol. Biol. 7 13. [DOI] [PMC free article] [PubMed] [Google Scholar]
- 20.Nybakken, K., Vokes, S. A., Lin, T. Y., McMahon, A. P., and Perrimon, N. (2005) Nat. Genet. 37 1323–1332 [DOI] [PMC free article] [PubMed] [Google Scholar]
- 21.Kasper, M., Regl, G., Frischauf, A. M., and Aberger, F. (2006) Eur. J. Cancer 42 437–445 [DOI] [PubMed] [Google Scholar]
- 22.Nilsson, M., Unden, A. B., Krause, D., Malmqwist, U., Raza, K., Zaphiropoulos, P. G., and Toftgård, R. (2000) Proc. Natl. Acad. Sci. U. S. A. 97 3438–3443 [DOI] [PMC free article] [PubMed] [Google Scholar]
- 23.Clement, V., Sanchez, P., de Tribolet, N., Radovanovic, I., and Ruiz i Altaba, A. (2007) Curr. Biol. 17 165–172 [DOI] [PMC free article] [PubMed] [Google Scholar]
- 24.Ruiz, I. A. A., Mas, C., and Stecca, B. (2007) Trends Cell Biol. 17 438–447 [DOI] [PMC free article] [PubMed] [Google Scholar]
- 25.Wang, X. Q., and Rothnagel, J. A. (2001) J. Biol. Chem. 276 1311–1316 [DOI] [PubMed] [Google Scholar]
- 26.Dunaeva, M., Michelson, P., Kogerman, P., and Toftgård, R. (2003) J. Biol. Chem. 278 5116–5122 [DOI] [PubMed] [Google Scholar]
- 27.Mao, J., Maye, P., Kogerman, P., Tejedor, F. J., Toftgård, R., Xie, W., Wu, G., and Wu, D. (2002) J. Biol. Chem. 277 35156–35161 [DOI] [PubMed] [Google Scholar]
- 28.Kogerman, P., Krause, D., Rahnama, F., Kogerman, L., Unden, A. B., Zaphiropoulos, P. G., and Toftgård, R. (2002) Oncogene 21 6007–6016 [DOI] [PubMed] [Google Scholar]
- 29.Kogerman, P., Grimm, T., Kogerman, L., Krause, D., Unden, A. B., Sandstedt, B., Toftgård, R., and Zaphiropoulos, P. G. (1999) Nat. Cell Biol. 1 312–319 [DOI] [PubMed] [Google Scholar]
- 30.Kasper, M., Schnidar, H., Neill, G. W., Hanneder, M., Klingler, S., Blaas, L., Schmid, C., Hauser-Kronberger, C., Regl, G., Philpott, M. P., and Aberger, F. (2006) Mol. Cell. Biol. 26 6283–6298 [DOI] [PMC free article] [PubMed] [Google Scholar]
- 31.del Prete, M. J., Vernal, R., Dolznig, H., Mullner, E. W., and Garcia-Sanz, J. A. (2007) RNA (Cold Spring Harbor) 13 414–421 [DOI] [PMC free article] [PubMed] [Google Scholar]
- 32.Frank-Kamenetsky, M., Zhang, X. M., Bottega, S., Guicherit, O., Wichterle, H., Dudek, H., Bumcrot, D., Wang, F. Y., Jones, S., Shulok, J., Rubin, L. L., and Porter, J. A. (2002) J. Biol. 1 10. [DOI] [PMC free article] [PubMed] [Google Scholar]
- 33.Chen, J. K., Taipale, J., Young, K. E., Maiti, T., and Beachy, P. A. (2002) Proc. Natl. Acad. Sci. U. S. A. 99 14071–14076 [DOI] [PMC free article] [PubMed] [Google Scholar]
- 34.Auboeuf, D., Batsche, E., Dutertre, M., Muchardt, C., and O'Malley, B. W. (2007) Trends Endocrinol. Metab. 18 122–129 [DOI] [PubMed] [Google Scholar]
- 35.Merchant, M., Vajdos, F. F., Ultsch, M., Maun, H. R., Wendt, U., Cannon, J., Desmarais, W., Lazarus, R. A., de Vos, A. M., and de Sauvage, F. J. (2004) Mol. Cell. Biol. 24 8627–8641 [DOI] [PMC free article] [PubMed] [Google Scholar]
- 36.Rahnama, F., Shimokawa, T., Lauth, M., Finta, C., Kogerman, P., Teglund, S., Toftgård, R., and Zaphiropoulos, P. G. (2006) Biochem. J. 394 19–26 [DOI] [PMC free article] [PubMed] [Google Scholar]
- 37.Lauth, M., Bergström, A., Shimokawa, T., and Toftgård, R. (2007) Proc. Natl. Acad. Sci. U. S. A. 104 8455–8460 [DOI] [PMC free article] [PubMed] [Google Scholar]
- 38.Ågren, M., Kogerman, P., Kleman, M. I., Wessling, M., and Toftgård, R. (2004) Gene (Amst.) 330 101–114 [DOI] [PubMed] [Google Scholar]
- 39.He, J., Sheng, T., Stelter, A. A., Li, C., Zhang, X., Sinha, M., Luxon, B. A., and Xie, J. (2006) J. Biol. Chem. 281 35598–35602 [DOI] [PubMed] [Google Scholar]
- 40.Kinzler, K. W., Ruppert, J. M., Bigner, S. H., and Vogelstein, B. (1988) Nature 332 371–374 [DOI] [PubMed] [Google Scholar]
- 41.Hallikas, O., Palin, K., Sinjushina, N., Rautiainen, R., Partanen, J., Ukkonen, E., and Taipale, J. (2006) Cell 124 47–59 [DOI] [PubMed] [Google Scholar]
- 42.Eichberger, T., Sander, V., Schnidar, H., Regl, G., Kasper, M., Schmid, C., Plamberger, S., Kaser, A., Aberger, F., and Frischauf, A. M. (2006) Genomics 87 616–632 [DOI] [PubMed] [Google Scholar]
- 43.Hoppler, S., and Kavanagh, C. L. (2007) J. Cell Sci. 120 385–393 [DOI] [PubMed] [Google Scholar]
Associated Data
This section collects any data citations, data availability statements, or supplementary materials included in this article.


